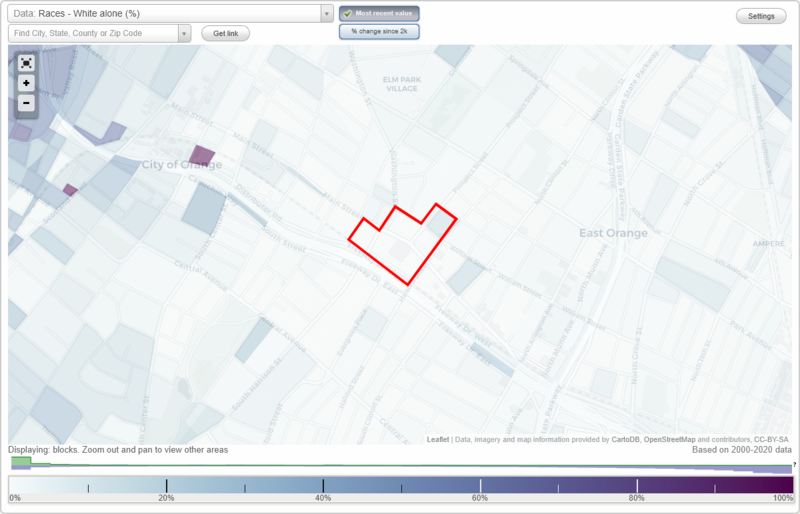
Muir's Berkeley neighborhood in East Orange, New Jersey (NJ), 07017, 07018 detailed profile
Settings
X

Business Search - 14 Million verified businesses
Area: 0.048 square miles
Population: 521
Population density:
| Muir's Berkeley: | 10,806 people per square mile |
| East Orange: | 17,426 people per square mile |

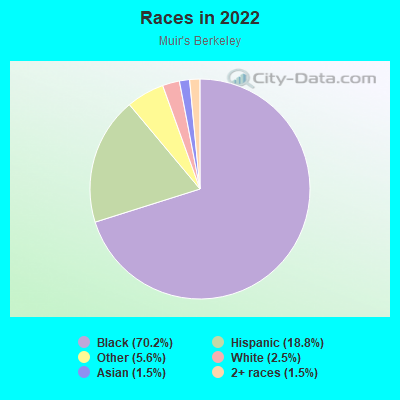
- 47870.2%Black
- 12818.8%Hispanic or Latino
- 385.6%Some other race
- 172.5%White
- 101.5%Asian
- 101.5%Two or more races
Median household income in 2022:
| Muir's Berkeley: | $53,887 |
| East Orange: | $43,527 |
Distribution of median household income
![Distribution of median household income]()
- 20Less than $10,000
- 28$10,000 to $19,999
- 28$20,000 to $29,999
- 52$30,000 to $39,999
- 73$40,000 to $49,999
- 21$50,000 to $59,999
- 36$60,000 to $74,999
- 48$75,000 to $99,999
- 15$100,000 to $124,999
- 10$125,000 to $149,999
- 6$150,000 to $199,999
- 44$200,000 or more

Distribution of owner-occupied house/condo value
![Distribution of owner-occupied house/condo value]()
- 14Less than $50,000
- 3$50,000 to $99,999
- 33$100,000 to $149,999
- 19$150,000 to $199,999
- 11$200,000 to $249,999
- 10$250,000 to $299,999
- 23$300,000 to $399,999
- 20$500,000 to $749,999

Distribution of rent paid by renters
![Distribution of rent paid by renters]()
- 6$100 to $199
- 42$200 to $299
- 13$300 to $399
- 16$400 to $499
- 21$500 to $599
- 7$600 to $699
- 9$800 to $899
- 9$900 to $999
- 56$1,000 to $1,249
- 42$1,250 to $1,499
- 82$1,500 to $1,999
- 44$2,000 or more

Median rent in 2022:
| Muir's Berkeley: | $1,385 |
| East Orange: | $1,074 |
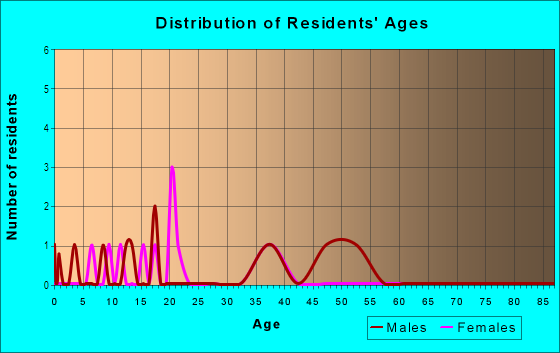
| Males: | 168 |
| Females: | 353 |
Males:
| This neighborhood: | 40.7 years |
| Whole city: | 34.0 years |
| This neighborhood: | 35.4 years |
| Whole city: | 39.2 years |
Average household size:
| Muir's Berkeley: | 9.6 people |
| East Orange: | 2.4 people |
Percentage of family households:
| Muir's Berkeley: | 33.0% |
| East Orange: | 35.5% |
| Here: | 10.7% |
| East Orange: | 21.9% |
Percentage of married-couple families with children (among all households):
| Muir's Berkeley: | 24.7% |
| East Orange: | 17.7% |
Percentage of single-mother households (among all households):
| Muir's Berkeley: | 21.1% |
| East Orange: | 19.1% |
Percentage of never married males 15 years old and over:
Percentage of never married females 15 years old and over:
| Muir's Berkeley: | 10.9% |
| East Orange: | 27.1% |
Percentage of never married females 15 years old and over:
| Muir's Berkeley: | 28.7% |
| city: | 26.2% |
Percentage of people that speak English not well or not at all:
| Muir's Berkeley: | 2.8% |
| East Orange: | 4.0% |
Percentage of people born in this state:
Percentage of people born in another U.S. state:
Percentage of native residents but born outside the U.S.:
Percentage of foreign born residents:
| Here: | 31.3% |
| East Orange: | 44.2% |
Percentage of people born in another U.S. state:
| Muir's Berkeley: | 20.6% |
| East Orange: | 18.0% |
Percentage of native residents but born outside the U.S.:
| Here: | 3.0% |
| city: | 2.4% |
Percentage of foreign born residents:
| Here: | 45.0% |
| East Orange: | 35.4% |
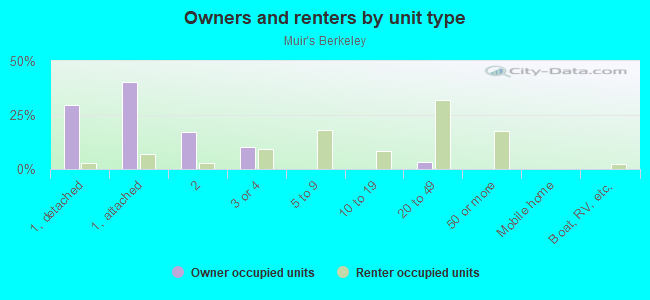
Owner-occupied
Renter-occupied

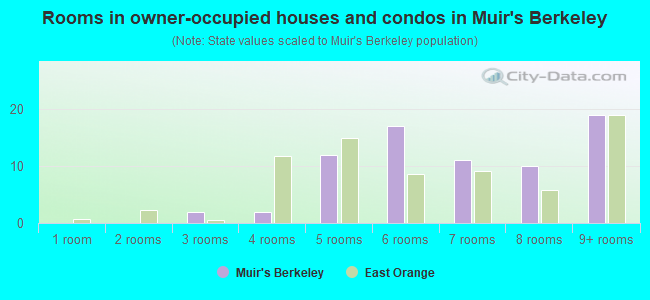
- Rooms in owner-occupied houses and condos in Muir's Berkeley
- 01 room
- 02 rooms
- 23 rooms
- 24 rooms
- 125 rooms
- 176 rooms
- 117 rooms
- 108 rooms
- 199+ rooms
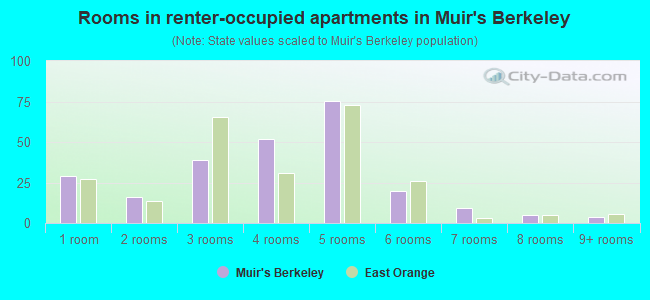
- Rooms in renter-occupied apartments in Muir's Berkeley
- 291 room
- 162 rooms
- 393 rooms
- 524 rooms
- 755 rooms
- 206 rooms
- 97 rooms
- 58 rooms
- 49+ rooms
Owner-occupied
Renter-occupied
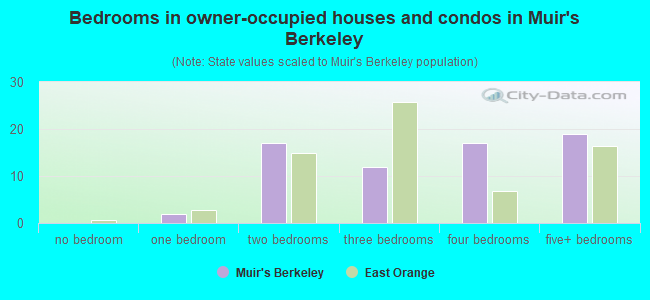
- Bedrooms in owner-occupied houses and condos in Muir's Berkeley
- 0no bedroom
- 21 bedroom
- 172 bedrooms
- 123 bedrooms
- 174 bedrooms
- 195+ bedrooms
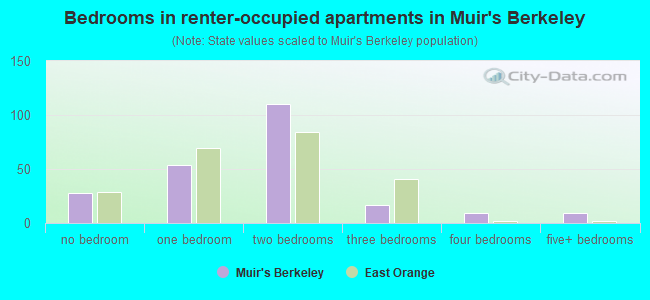
- Bedrooms in renter-occupied apartments in Muir's Berkeley
- 28no bedroom
- 541 bedroom
- 1102 bedrooms
- 173 bedrooms
- 94 bedrooms
- 95+ bedrooms
Average number of cars or other vehicles available in houses/condos:
Average number of cars or other vehicles available in apartments:
| This neighborhood: | 2.9 |
| East Orange: | 1.9 |
Average number of cars or other vehicles available in apartments:
| Here: | 1.5 |
| city: | 0.7 |
Percentage of units with a mortgage:
| Muir's Berkeley: | 54.3% |
| East Orange: | 72.5% |
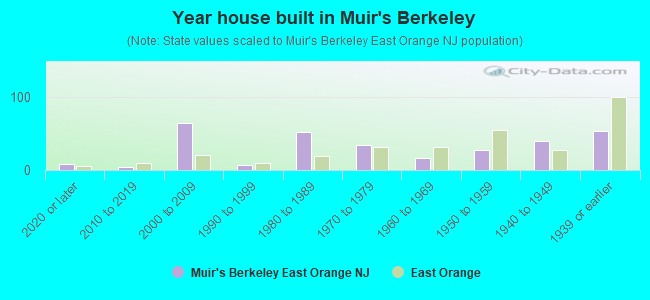
- Year house built in Muir's Berkeley
- 82020 or later
- 42010 to 2019
- 652000 to 2009
- 71990 to 1999
- 521980 to 1989
- 351970 to 1979
- 161960 to 1969
- 281950 to 1959
- 401940 to 1949
- 541939 or earlier
City-data.com crime index for city in 2020 (higher means more crime):
| City: | 201.2 |
| U.S. average: | 219.5 |
Travel time to work (commute)
![Travel time to work (commute)]()
- 12Less than 5 minutes
- 145 to 9 minutes
- 2310 to 14 minutes
- 2915 to 19 minutes
- 9920 to 24 minutes
- 3825 to 29 minutes
- 3130 to 34 minutes
- 835 to 39 minutes
- 2840 to 44 minutes
- 3845 to 59 minutes
- 4860 to 89 minutes
- 390 or more minutes

Means of transportation to work
![Means of transportation to work]()
- 47.2%81Drove a car alone
- 31.5%54Carpooled
- 12.2%21Bus
- 10.5%18Subway or elevated rail
- 18.1%31Long-distance train or commuter rail
- 15.7%27Taxi
- 20.4%35Walked
- 3.5%6Other means
- 60.7%104Worked at home

Time leaving home to go to work
![Time leaving home to go to work]()
- 2812:00 a.m. to 4:59 a.m.
- 115:00 a.m. to 5:29 a.m.
- 26:00 a.m. to 6:29 a.m.
- 226:30 a.m. to 6:59 a.m.
- 227:00 a.m. to 7:29 a.m.
- 207:30 a.m. to 7:59 a.m.
- 668:00 a.m. to 8:29 a.m.
- 298:30 a.m. to 8:59 a.m.
- 319:00 a.m. to 9:59 a.m.
- 610:00 a.m. to 10:59 a.m.
- 3111:00 a.m. to 11:59 a.m.
- 7312:00 p.m. to 3:59 p.m.
- 514:00 p.m. to 11:59 p.m.

Occupations of males:
- Percentage of males in management occupations (except farmers):
Here: 13.5% city: 6.9%
- Percentage of males in business and financial operations occupations:
Here: 8.3% city: 4.1%
- Percentage of males in computer and mathematical occupations:
Here: 4.7% city: 2.9%
- Percentage of males in architecture and engineering occupations:
Here: 7.7% city: 3.3%
- Percentage of males in community and social services occupations:
Here: 3.5% city: 1.3%
- Percentage of males in legal occupations:
Here: 20.8% city: 0.6%
- Percentage of males in service occupations:
Here: 6.9% city: 21.2%
- Percentage of males in sales and office occupations:
Here: 8.7% city: 16.5%
- Percentage of males in construction, extraction, and maintenance occupations:
Here: 5.2% city: 6.4%
- Percentage of males in transportation occupations:
Here: 17.3% city: 12.2%
- Percentage of males in material moving occupations:
Here: 32.5% city: 10.6%
Occupations of females:
- Percentage of females in management occupations (except farmers):
Here: 1.9% city: 6.5%
- Percentage of females in business and financial operations occupations:
Here: 1.2% city: 5.7%
- Percentage of females in life, physical, and social science occupations:
Here: 1.1% city: 0.2%
- Percentage of females in community and social services occupations:
Here: 2.3% city: 4.4%
- Percentage of females in healthcare practitioners and technical occupations:
Here: 5.2% city: 6.6%
- Percentage of females in service occupations:
Here: 55.5% city: 32.6%
- Percentage of females in sales and office occupations:
Here: 29.0% city: 27.4%
- Percentage of females in transportation occupations:
Here: 1.1% city: 2.5%
- Percentage of females in material moving occupations:
Here: 3.8% city: 3.3%
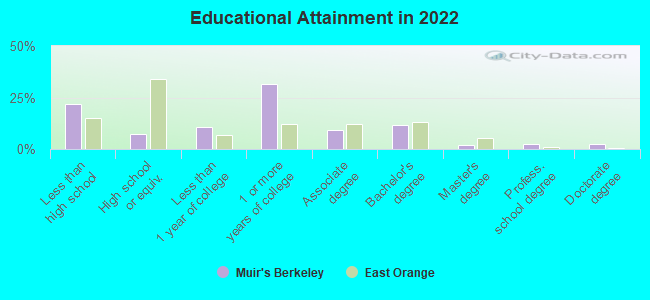
Education in this neighborhood (subdivision or community):
- Percentage of people 3 years and older in K-12 schools:
Muir's Berkeley: 65.3% East Orange: 19.7%
- Percentage of people 3 years and older in undergraduate colleges:
Muir's Berkeley: 7.2% East Orange: 7.0%
- Percentage of people 3 years and older in grad. or professional schools:
Muir's Berkeley: 7.0% East Orange: 0.4%
- Percentage of students K-12 enrolled in private schools:
Muir's Berkeley: 17.7% East Orange: 11.6%
Percentage of population below poverty level:
| Muir's Berkeley: | 15.5% |
| East Orange: | 22.1% |
Median year renter moved in (as recorded in 2022):
| Muir's Berkeley: | 2015 |
| East Orange: | 2016 |
Percentage of married-couple families with both working:
| Muir's Berkeley: | 100.0% |
| East Orange: | 72.4% |
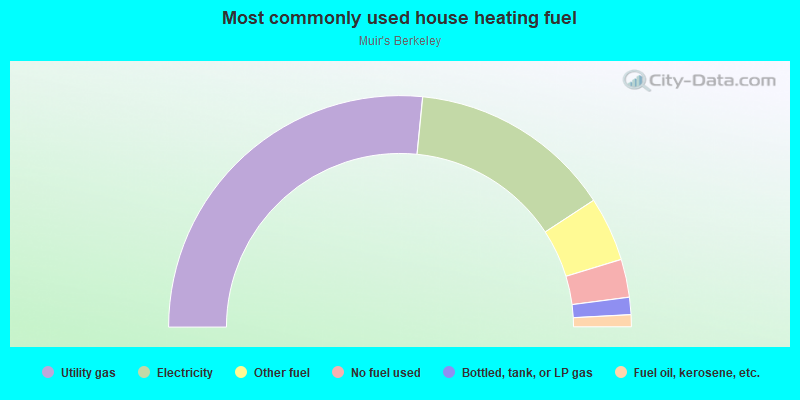
- 53.1%Utility gas
- 28.4%Electricity
- 9.0%Other fuel
- 5.3%No fuel used
- 2.4%Bottled, tank, or LP gas
- 1.7%Fuel oil, kerosene, etc.
Roads and streets:
Brick Church Plz
Length: 0.15 miles
Direction: SE-NW
Direction: SE-NW
Dr Martin Luther King Jr Blvd (Main St)
Length: 0.15 miles
Directions: E-W, SE-NW
Address range: 525 to 584
Directions: E-W, SE-NW
Address range: 525 to 584
William St
Length: 0.14 miles
Directions: E-W, SE-NW
Address range: 543 to 582
Directions: E-W, SE-NW
Address range: 543 to 582
Evergreen Pl
Length: 0.13 miles
Direction: SW-NE
Direction: SW-NE
N Harrison St
Length: 0.09 miles
Directions: N-S, SW-NE
Address range: 1 to 35
Directions: N-S, SW-NE
Address range: 1 to 35
Prospect St
Length: 0.09 miles
Direction: SW-NE
Address range: 2 to 27
Direction: SW-NE
Address range: 2 to 27
Railroad features:
N J Transit RR
Length: 0.06 miles
Direction: SE-NW
Direction: SE-NW