Mitchell Park neighborhood in Tempe, Arizona (AZ), 85281 detailed profile
Settings
X


Business Search - 14 Million verified businesses
Area: 0.234 square miles
Population: 1,178
Population density:
| Mitchell Park: | 5,043 people per square mile |
| Tempe: | 4,641 people per square mile |

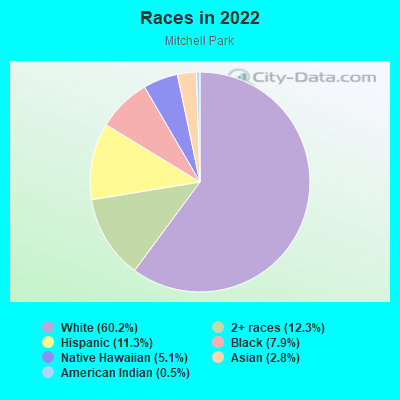
- 78560.2%White
- 16012.3%Two or more races
- 14711.3%Hispanic or Latino
- 1037.9%Black
- 665.1%Native Hawaiian and Other
Pacific Islander - 362.8%Asian
- 70.5%American Indian
Median household income in 2022:
| Mitchell Park: | $82,161 |
| Tempe: | $76,007 |
Distribution of median household income
![Distribution of median household income]()
- 31Less than $10,000
- 22$10,000 to $19,999
- 49$20,000 to $29,999
- 73$30,000 to $39,999
- 36$40,000 to $49,999
- 80$50,000 to $59,999
- 33$60,000 to $74,999
- 36$75,000 to $99,999
- 146$100,000 to $124,999
- 28$125,000 to $149,999
- 14$150,000 to $199,999
- 15$200,000 or more

Distribution of owner-occupied house/condo value
![Distribution of owner-occupied house/condo value]()
- 56Less than $50,000
- 5$150,000 to $199,999
- 21$200,000 to $249,999
- 33$250,000 to $299,999
- 44$300,000 to $399,999
- 39$400,000 to $499,999
- 18$500,000 to $749,999

Distribution of rent paid by renters
![Distribution of rent paid by renters]()
- 31$500 to $599
- 51$600 to $699
- 18$700 to $799
- 45$800 to $899
- 65$900 to $999
- 84$1,000 to $1,249
- 9$1,250 to $1,499
- 159$1,500 to $1,999
- 19$2,000 or more

Median rent in 2022:
| Mitchell Park: | $1,434 |
| Tempe: | $1,566 |
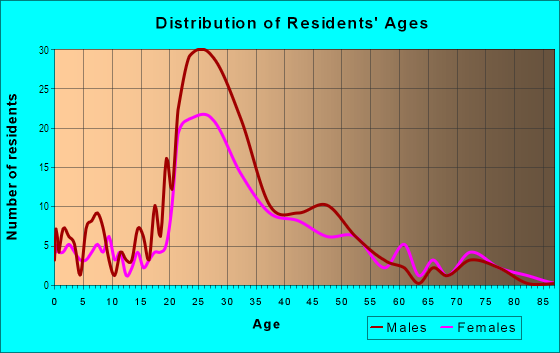
| Males: | 801 |
| Females: | 376 |
Males:
| This neighborhood: | 32.9 years |
| Whole city: | 28.9 years |
| This neighborhood: | 32.8 years |
| Whole city: | 30.5 years |
Average household size:
| Mitchell Park: | 2.4 people |
| Tempe: | 2.3 people |
Percentage of family households:
| Mitchell Park: | 18.1% |
| Tempe: | 36.3% |
| Here: | 12.0% |
| Tempe: | 32.6% |
Percentage of married-couple families with children (among all households):
| Mitchell Park: | 35.7% |
| Tempe: | 26.9% |
Percentage of single-mother households (among all households):
| Mitchell Park: | 9.0% |
| Tempe: | 8.3% |
Percentage of never married males 15 years old and over:
Percentage of never married females 15 years old and over:
| Mitchell Park: | 54.4% |
| Tempe: | 32.9% |
Percentage of never married females 15 years old and over:
| Mitchell Park: | 19.4% |
| city: | 21.7% |
Percentage of people that speak English not well or not at all:
| Mitchell Park: | 0.6% |
| Tempe: | 2.0% |
Percentage of people born in this state:
Percentage of people born in another U.S. state:
Percentage of native residents but born outside the U.S.:
Percentage of foreign born residents:
| Here: | 44.4% |
| Tempe: | 39.3% |
Percentage of people born in another U.S. state:
| Mitchell Park: | 43.5% |
| Tempe: | 46.0% |
Percentage of native residents but born outside the U.S.:
| Here: | 2.2% |
| city: | 1.8% |
Percentage of foreign born residents:
| Here: | 9.9% |
| Tempe: | 12.9% |
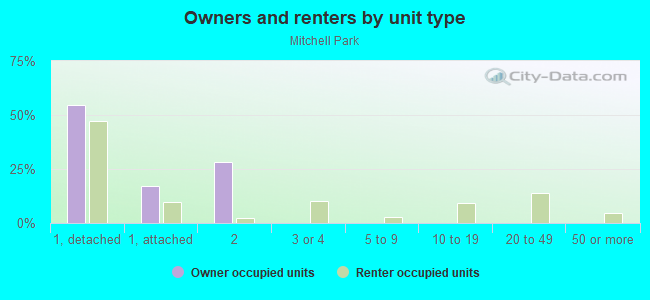
Owner-occupied
Renter-occupied

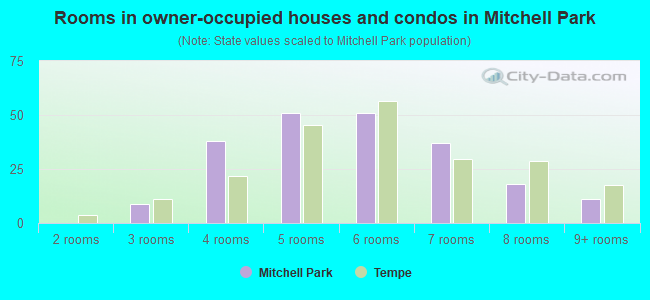
- Rooms in owner-occupied houses and condos in Mitchell Park
- 01 room
- 02 rooms
- 93 rooms
- 384 rooms
- 515 rooms
- 516 rooms
- 377 rooms
- 188 rooms
- 119+ rooms
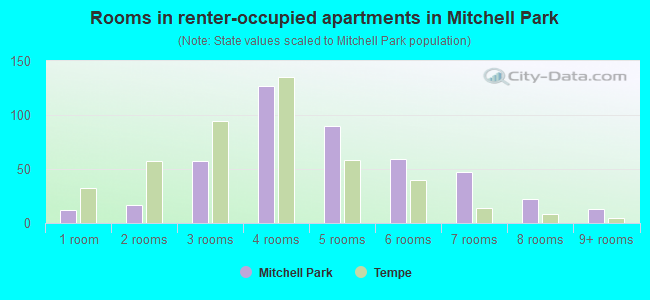
- Rooms in renter-occupied apartments in Mitchell Park
- 121 room
- 172 rooms
- 573 rooms
- 1274 rooms
- 905 rooms
- 596 rooms
- 477 rooms
- 228 rooms
- 139+ rooms
Owner-occupied
Renter-occupied
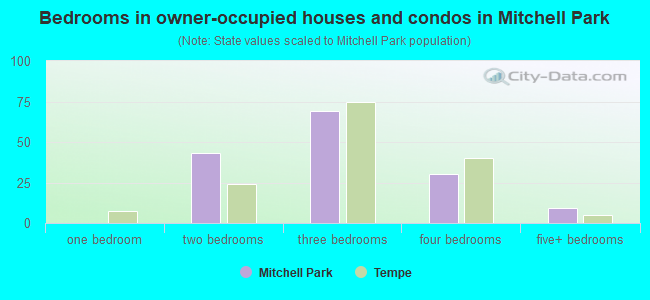
- Bedrooms in owner-occupied houses and condos in Mitchell Park
- 0no bedroom
- 01 bedroom
- 432 bedrooms
- 693 bedrooms
- 304 bedrooms
- 95+ bedrooms
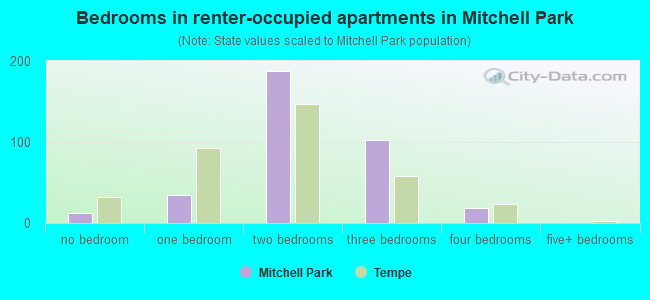
- Bedrooms in renter-occupied apartments in Mitchell Park
- 12no bedroom
- 341 bedroom
- 1882 bedrooms
- 1023 bedrooms
- 184 bedrooms
- 05+ bedrooms
Average number of cars or other vehicles available in houses/condos:
Average number of cars or other vehicles available in apartments:
| This neighborhood: | 1.8 |
| Tempe: | 2.0 |
Average number of cars or other vehicles available in apartments:
| Here: | 1.9 |
| city: | 1.6 |
Percentage of units with a mortgage:
| Mitchell Park: | 66.4% |
| Tempe: | 69.2% |
Housing prices:
- Average estimated value of detached houses in 2022 (64.8% of all units):
Mitchell Park: $389,040 Tempe: $535,475
- Average estimated value of townhouses or other attached units in 2022 (16.7% of all units):
This neighborhood: $106,839 city: $325,212
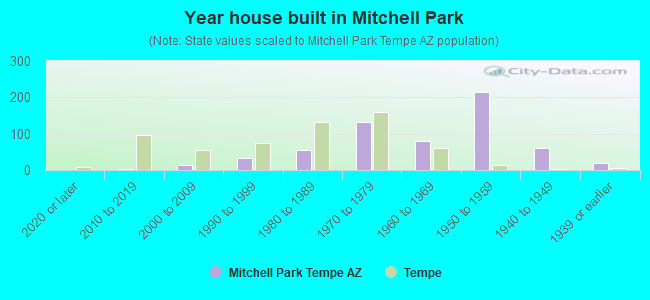
- Year house built in Mitchell Park
- 02020 or later
- 42010 to 2019
- 142000 to 2009
- 341990 to 1999
- 561980 to 1989
- 1311970 to 1979
- 801960 to 1969
- 2141950 to 1959
- 611940 to 1949
- 191939 or earlier
City-data.com crime index for city in 2020 (higher means more crime):
| City: | 347.1 |
| U.S. average: | 219.5 |
Travel time to work (commute)
![Travel time to work (commute)]()
- 12Less than 5 minutes
- 1155 to 9 minutes
- 9210 to 14 minutes
- 15315 to 19 minutes
- 18020 to 24 minutes
- 10625 to 29 minutes
- 8030 to 34 minutes
- 1935 to 39 minutes
- 1140 to 44 minutes
- 1545 to 59 minutes
- 1360 to 89 minutes
- 1690 or more minutes

Means of transportation to work
![Means of transportation to work]()
- 70.8%563Drove a car alone
- 4.3%34Carpooled
- 3.9%31Bus
- 0.3%2Taxi
- 0.9%7Motorcycle
- 6.8%54Bicycle
- 1.4%11Walked
- 3.4%27Other means
- 13.3%106Worked at home

Time leaving home to go to work
![Time leaving home to go to work]()
- 3712:00 a.m. to 4:59 a.m.
- 125:00 a.m. to 5:29 a.m.
- 575:30 a.m. to 5:59 a.m.
- 566:00 a.m. to 6:29 a.m.
- 226:30 a.m. to 6:59 a.m.
- 1607:00 a.m. to 7:29 a.m.
- 857:30 a.m. to 7:59 a.m.
- 518:00 a.m. to 8:29 a.m.
- 928:30 a.m. to 8:59 a.m.
- 679:00 a.m. to 9:59 a.m.
- 2110:00 a.m. to 10:59 a.m.
- 2511:00 a.m. to 11:59 a.m.
- 6912:00 p.m. to 3:59 p.m.
- 614:00 p.m. to 11:59 p.m.

Occupations of males:
- Percentage of males in management occupations (except farmers):
Here: 11.6% city: 10.2%
- Percentage of males in business and financial operations occupations:
Here: 2.9% city: 6.5%
- Percentage of males in computer and mathematical occupations:
Here: 5.2% city: 8.4%
- Percentage of males in architecture and engineering occupations:
Here: 2.7% city: 5.0%
- Percentage of males in life, physical, and social science occupations:
Here: 3.9% city: 1.9%
- Percentage of males in community and social services occupations:
Here: 1.1% city: 1.1%
- Percentage of males in education, training, and library occupations:
Here: 16.9% city: 6.1%
- Percentage of males in arts, design, entertainment, sports, and media occupations:
Here: 5.2% city: 2.8%
- Percentage of males in service occupations:
Here: 7.0% city: 14.4%
- Percentage of males in sales and office occupations:
Here: 7.8% city: 19.0%
- Percentage of males in construction, extraction, and maintenance occupations:
Here: 5.8% city: 5.1%
- Percentage of males in production occupations:
Here: 23.2% city: 4.4%
Occupations of females:
- Percentage of females in management occupations (except farmers):
Here: 2.2% city: 7.5%
- Percentage of females in business and financial operations occupations:
Here: 12.3% city: 9.3%
- Percentage of females in computer and mathematical occupations:
Here: 4.9% city: 3.3%
- Percentage of females in architecture and engineering occupations:
Here: 2.4% city: 0.9%
- Percentage of females in life, physical, and social science occupations:
Here: 7.0% city: 1.5%
- Percentage of females in community and social services occupations:
Here: 6.1% city: 3.4%
- Percentage of females in legal occupations:
Here: 4.5% city: 1.4%
- Percentage of females in education, training, and library occupations:
Here: 13.8% city: 12.0%
- Percentage of females in arts, design, entertainment, sports, and media occupations:
Here: 5.2% city: 3.1%
- Percentage of females in healthcare practitioners and technical occupations:
Here: 2.6% city: 7.4%
- Percentage of females in service occupations:
Here: 25.9% city: 18.9%
- Percentage of females in sales and office occupations:
Here: 24.1% city: 26.9%
- Percentage of females in material moving occupations:
Here: 1.5% city: 1.4%
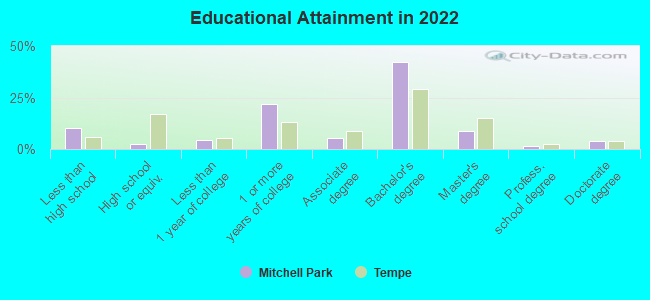
Education in this neighborhood (subdivision or community):
- Percentage of people 3 years and older in K-12 schools:
Mitchell Park: 11.4% Tempe: 12.5%
- Percentage of people 3 years and older in undergraduate colleges:
Mitchell Park: 16.4% Tempe: 15.4%
- Percentage of people 3 years and older in grad. or professional schools:
Mitchell Park: 5.9% Tempe: 6.3%
- Percentage of students K-12 enrolled in private schools:
Mitchell Park: 43.8% Tempe: 9.2%
Percentage of population below poverty level:
| Mitchell Park: | 20.2% |
| Tempe: | 15.0% |
Median year owner moved in (as recorded in 2022):
| Mitchell Park: | 2003 |
| Tempe: | 2013 |
Percentage of married-couple families with both working:
| Mitchell Park: | 77.7% |
| Tempe: | 77.6% |
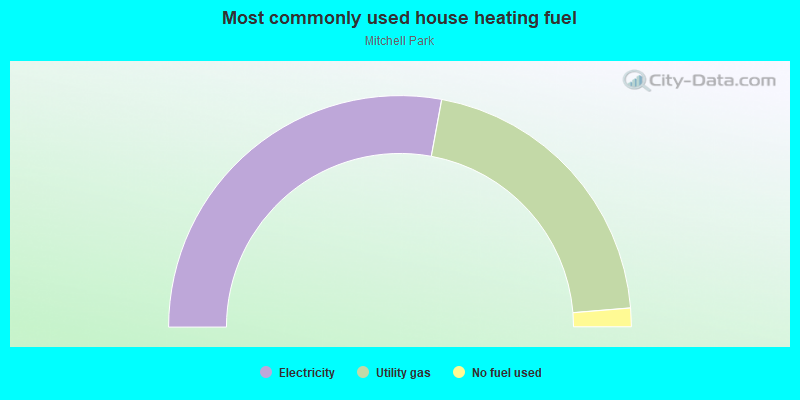
- 55.8%Electricity
- 41.6%Utility gas
- 2.6%No fuel used
Roads and streets:
W 13th St
Length: 0.50 miles
Direction: E-W
Address range: 401 to 863
Direction: E-W
Address range: 401 to 863
S Wilson St
Length: 0.41 miles
Direction: N-S
Address range: 900 to 1299
Direction: N-S
Address range: 900 to 1299
S Roosevelt St
Length: 0.41 miles
Direction: N-S
Address range: 900 to 1299
Direction: N-S
Address range: 900 to 1299
S Farmer Ave
Length: 0.41 miles
Direction: N-S
Address range: 903 to 1299
Direction: N-S
Address range: 903 to 1299
W 11th St
Length: 0.40 miles
Direction: E-W
Address range: 300 to 799
Direction: E-W
Address range: 300 to 799
W Howe St
Length: 0.40 miles
Direction: E-W
Address range: 400 to 799
Direction: E-W
Address range: 400 to 799
W 10th St
Length: 0.39 miles
Direction: E-W
Address range: 403 to 799
Direction: E-W
Address range: 403 to 799
W 9th St
Length: 0.39 miles
Direction: E-W
Address range: 400 to 799
Direction: E-W
Address range: 400 to 799
S McKemy St
Length: 0.34 miles
Directions: N-S, SW-NE
Address range: 900 to 1299
Directions: N-S, SW-NE
Address range: 900 to 1299
W 12th St
Length: 0.30 miles
Direction: E-W
Address range: 400 to 699
Direction: E-W
Address range: 400 to 699
S Judd St
Length: 0.28 miles
Direction: N-S
Address range: 1000 to 1299
Direction: N-S
Address range: 1000 to 1299
S Mitchell Dr
Length: 0.19 miles
Directions: N-S, SE-NW
Address range: 850 to 1099
Directions: N-S, SE-NW
Address range: 850 to 1099
W 12th Pl
Length: 0.18 miles
Directions: E-W, SW-NE
Address range: 700 to 899
Directions: E-W, SW-NE
Address range: 700 to 899
W 10th Pl
Length: 0.05 miles
Directions: E-W, SE-NW
Address range: 600 to 699
Directions: E-W, SE-NW
Address range: 600 to 699