Millenia neighborhood in Orlando, Florida (FL), 32839 detailed profile
Settings
X


Business Search - 14 Million verified businesses
Area: 1.509 square miles
Population: 2,388
Population density:
| Millenia: | 1,583 people per square mile |
| Orlando: | 3,381 people per square mile |

- 1,51159.1%Hispanic or Latino
- 36214.2%Black
- 32412.7%White
- 1877.3%Two or more races
- 1375.4%Some other race
- 361.4%Asian

Median household income in 2022:
| Millenia: | $42,756 |
| Orlando: | $65,354 |
Distribution of median household income
![Distribution of median household income]()
- 56Less than $10,000
- 41$10,000 to $19,999
- 222$20,000 to $29,999
- 94$30,000 to $39,999
- 177$40,000 to $49,999
- 69$50,000 to $59,999
- 74$60,000 to $74,999
- 72$75,000 to $99,999
- 30$100,000 to $124,999
- 30$125,000 to $149,999
- 46$150,000 to $199,999
- 37$200,000 or more

Distribution of owner-occupied house/condo value
![Distribution of owner-occupied house/condo value]()
- 149Less than $50,000
- 46$50,000 to $99,999
- 78$100,000 to $149,999
- 64$150,000 to $199,999
- 31$200,000 to $249,999
- 82$250,000 to $299,999
- 24$300,000 to $399,999
- 66$400,000 to $499,999
- 25$500,000 to $749,999
- 8$750,000 to $999,999
- 22$1,000,000 or more

Distribution of rent paid by renters
![Distribution of rent paid by renters]()
- 32$600 to $699
- 48$700 to $799
- 46$800 to $899
- 137$900 to $999
- 293$1,000 to $1,249
- 92$1,250 to $1,499
- 44$1,500 to $1,999
- 55$2,000 or more

Median rent in 2022:
| Millenia: | $1,102 |
| Orlando: | $1,425 |
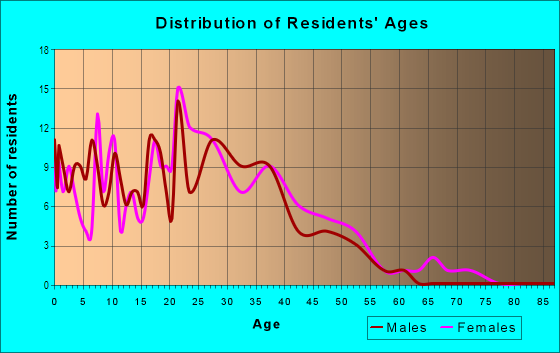
| Males: | 983 |
| Females: | 1,404 |
Males:
| This neighborhood: | 33.4 years |
| Whole city: | 34.1 years |
| This neighborhood: | 33.2 years |
| Whole city: | 37.3 years |
Average household size:
| Millenia: | 10.6 people |
| Orlando: | 2.3 people |
Percentage of family households:
| Millenia: | 62.1% |
| Orlando: | 43.6% |
| Here: | 39.7% |
| Orlando: | 35.3% |
Percentage of married-couple families with children (among all households):
| Millenia: | 16.8% |
| Orlando: | 25.1% |
Percentage of single-mother households (among all households):
| Millenia: | 11.5% |
| Orlando: | 15.2% |
Percentage of never married males 15 years old and over:
Percentage of never married females 15 years old and over:
| Millenia: | 15.6% |
| Orlando: | 21.6% |
Percentage of never married females 15 years old and over:
| Millenia: | 28.0% |
| city: | 19.5% |
Percentage of people that speak English not well or not at all:
| Millenia: | 0.0% |
| Orlando: | 8.8% |
Percentage of people born in this state:
Percentage of people born in another U.S. state:
Percentage of native residents but born outside the U.S.:
Percentage of foreign born residents:
| Here: | 25.1% |
| Orlando: | 34.9% |
Percentage of people born in another U.S. state:
| Millenia: | 20.7% |
| Orlando: | 33.1% |
Percentage of native residents but born outside the U.S.:
| Here: | 6.3% |
| city: | 8.5% |
Percentage of foreign born residents:
| Here: | 47.9% |
| Orlando: | 23.6% |

Owner-occupied
Renter-occupied


- Rooms in owner-occupied houses and condos in Millenia
- 151 room
- 02 rooms
- 303 rooms
- 544 rooms
- 485 rooms
- 556 rooms
- 297 rooms
- 158 rooms
- 329+ rooms

- Rooms in renter-occupied apartments in Millenia
- 1821 room
- 812 rooms
- 1993 rooms
- 1574 rooms
- 1745 rooms
- 816 rooms
- 347 rooms
- 108 rooms
- 269+ rooms
Owner-occupied
Renter-occupied

- Bedrooms in owner-occupied houses and condos in Millenia
- 15no bedroom
- 261 bedroom
- 932 bedrooms
- 1413 bedrooms
- 514 bedrooms
- 325+ bedrooms

- Bedrooms in renter-occupied apartments in Millenia
- 230no bedroom
- 2261 bedroom
- 3432 bedrooms
- 173 bedrooms
- 814 bedrooms
- 265+ bedrooms
Average number of cars or other vehicles available in houses/condos:
Average number of cars or other vehicles available in apartments:
| This neighborhood: | 2.2 |
| Orlando: | 1.9 |
Average number of cars or other vehicles available in apartments:
| Here: | 1.2 |
| city: | 1.3 |
Percentage of units with a mortgage:
| Millenia: | 53.8% |
| Orlando: | 71.0% |

- Year house built in Millenia
- 02020 or later
- 592010 to 2019
- 1182000 to 2009
- 1531990 to 1999
- 4371980 to 1989
- 2421970 to 1979
- 1071960 to 1969
- 691950 to 1959
- 201940 to 1949
- 261939 or earlier

City-data.com crime index for city in 2020 (higher means more crime):
| City: | 423.0 |
| U.S. average: | 219.5 |
Travel time to work (commute)
![Travel time to work (commute)]()
- 39Less than 5 minutes
- 665 to 9 minutes
- 30210 to 14 minutes
- 39715 to 19 minutes
- 41420 to 24 minutes
- 57125 to 29 minutes
- 52030 to 34 minutes
- 3535 to 39 minutes
- 3840 to 44 minutes
- 6545 to 59 minutes
- 10360 to 89 minutes
- 8390 or more minutes

Means of transportation to work
![Means of transportation to work]()
- 55.3%652Drove a car alone
- 20.0%236Carpooled
- 9.0%106Bus
- 1.4%16Taxi
- 0.5%6Motorcycle
- 1.0%12Bicycle
- 6.2%73Walked
- 4.8%57Other means
- 8.2%97Worked at home

Time leaving home to go to work
![Time leaving home to go to work]()
- 42712:00 a.m. to 4:59 a.m.
- 565:00 a.m. to 5:29 a.m.
- 875:30 a.m. to 5:59 a.m.
- 1586:00 a.m. to 6:29 a.m.
- 2876:30 a.m. to 6:59 a.m.
- 3667:00 a.m. to 7:29 a.m.
- 1787:30 a.m. to 7:59 a.m.
- 1678:00 a.m. to 8:29 a.m.
- 2018:30 a.m. to 8:59 a.m.
- 1889:00 a.m. to 9:59 a.m.
- 4610:00 a.m. to 10:59 a.m.
- 2411:00 a.m. to 11:59 a.m.
- 26312:00 p.m. to 3:59 p.m.
- 2654:00 p.m. to 11:59 p.m.

Occupations of males:
- Percentage of males in management occupations (except farmers):
Here: 12.1% city: 13.1%
- Percentage of males in business and financial operations occupations:
Here: 9.2% city: 6.3%
- Percentage of males in computer and mathematical occupations:
Here: 2.2% city: 4.7%
- Percentage of males in life, physical, and social science occupations:
Here: 3.1% city: 0.6%
- Percentage of males in arts, design, entertainment, sports, and media occupations:
Here: 1.6% city: 3.3%
- Percentage of males in healthcare practitioners and technical occupations:
Here: 3.5% city: 4.4%
- Percentage of males in service occupations:
Here: 19.1% city: 15.4%
- Percentage of males in sales and office occupations:
Here: 14.8% city: 18.7%
- Percentage of males in construction, extraction, and maintenance occupations:
Here: 35.5% city: 7.6%
- Percentage of males in production occupations:
Here: 2.1% city: 2.7%
- Percentage of males in transportation occupations:
Here: 3.9% city: 7.4%
- Percentage of males in material moving occupations:
Here: 4.4% city: 4.9%
Occupations of females:
- Percentage of females in management occupations (except farmers):
Here: 5.4% city: 10.7%
- Percentage of females in business and financial operations occupations:
Here: 6.0% city: 7.6%
- Percentage of females in computer and mathematical occupations:
Here: 1.7% city: 1.8%
- Percentage of females in community and social services occupations:
Here: 1.7% city: 2.0%
- Percentage of females in education, training, and library occupations:
Here: 2.7% city: 6.5%
- Percentage of females in arts, design, entertainment, sports, and media occupations:
Here: 2.8% city: 2.5%
- Percentage of females in healthcare practitioners and technical occupations:
Here: 9.6% city: 8.2%
- Percentage of females in service occupations:
Here: 35.6% city: 20.2%
- Percentage of females in sales and office occupations:
Here: 23.4% city: 28.3%
- Percentage of females in farming, fishing, and forestry occupations:
Here: 1.9% city: 0.2%
- Percentage of females in construction, extraction, and maintenance occupations:
Here: 3.3% city: 0.5%
- Percentage of females in production occupations:
Here: 2.9% city: 1.9%
- Percentage of females in transportation occupations:
Here: 3.3% city: 2.9%
- Percentage of females in material moving occupations:
Here: 2.8% city: 2.5%
Education in this neighborhood (subdivision or community):
- Percentage of people 3 years and older in K-12 schools:
Millenia: 36.7% Orlando: 14.9%
- Percentage of people 3 years and older in undergraduate colleges:
Millenia: 8.3% Orlando: 5.5%
- Percentage of people 3 years and older in grad. or professional schools:
Millenia: 1.4% Orlando: 1.6%
- Percentage of students K-12 enrolled in private schools:
Millenia: 13.7% Orlando: 13.8%
Percentage of population below poverty level:
| Millenia: | 18.6% |
| Orlando: | 14.2% |
Median year owner moved in (as recorded in 2022):
Median year renter moved in (as recorded in 2022):
| Millenia: | 2015 |
| Orlando: | 2015 |
Median year renter moved in (as recorded in 2022):
| Millenia: | 2016 |
| Orlando: | 2020 |
Percentage of married-couple families with both working:
| Millenia: | 50.9% |
| Orlando: | 64.1% |

- 75.1%Electricity
- 9.8%No fuel used
- 9.4%Utility gas
- 5.8%Bottled, tank, or LP gas
Highways in this neighborhood:
S John Young Pkwy (State Hwy 423)
Length: 0.15 miles
Direction: N-S
Address range: 5118 to 5187
Direction: N-S
Address range: 5118 to 5187
Roads and streets:
Millenia Blvd
Length: 1.99 miles
Directions: E-W, N-S, SW-NE
Address range: 3400 to 5359
Directions: E-W, N-S, SW-NE
Address range: 3400 to 5359
Conroy Rd
Length: 0.57 miles
Directions: E-W, N-S, SE-NW
Address range: 2650 to 4311
Directions: E-W, N-S, SE-NW
Address range: 2650 to 4311
Eastgate Dr
Length: 0.41 miles
Directions: E-W, N-S, SW-NE
Directions: E-W, N-S, SW-NE
Millenia Plaza Way
Length: 0.07 miles
Directions: N-S, SE-NW
Address range: 4400 to 4799
Directions: N-S, SE-NW
Address range: 4400 to 4799
Centre View Ct
Length: 0.07 miles
Direction: SW-NE
Direction: SW-NE
Gardenia Ave
Length: 0.06 miles
Direction: N-S
Address range: 3801 to 3899
Direction: N-S
Address range: 3801 to 3899
Northmall Ct
Length: 0.06 miles
Direction: N-S
Direction: N-S
Harcourt Ave
Length: 0.00 miles
Direction: N-S
Address range: 5600 to 5635
Direction: N-S
Address range: 5600 to 5635