Michigan Avenue neighborhood in Fort Wayne, Indiana (IN), 46802 detailed profile
Settings
X


Business Search - 14 Million verified businesses
Area: 0.141 square miles
Population: 607
Population density:
| Michigan Avenue: | 4,304 people per square mile |
| Fort Wayne: | 3,387 people per square mile |

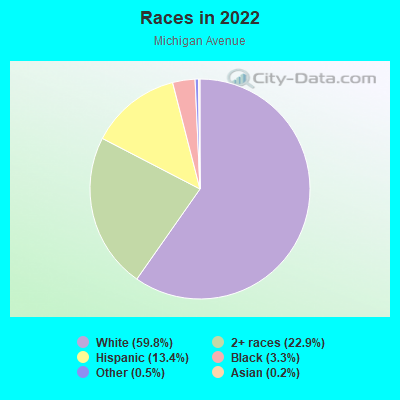
- 37659.8%White
- 14422.9%Two or more races
- 8413.4%Hispanic or Latino
- 213.3%Black
- 30.5%Some other race
- 10.2%Asian
Median household income in 2022:
| Michigan Avenue: | $77,141 |
| Fort Wayne: | $58,439 |
Distribution of median household income
![Distribution of median household income]()
- 6Less than $10,000
- 34$10,000 to $19,999
- 22$20,000 to $29,999
- 28$30,000 to $39,999
- 33$40,000 to $49,999
- 15$50,000 to $59,999
- 32$60,000 to $74,999
- 8$75,000 to $99,999
- 71$100,000 to $124,999
- 12$125,000 to $149,999
- 1$150,000 to $199,999

Distribution of owner-occupied house/condo value
![Distribution of owner-occupied house/condo value]()
- 101Less than $50,000
- 113$50,000 to $99,999
- 9$100,000 to $149,999
- 2$150,000 to $199,999
- 9$200,000 to $249,999
- 14$250,000 to $299,999
- 8$400,000 to $499,999

Distribution of rent paid by renters
![Distribution of rent paid by renters]()
- 3Less than $100
- 2$100 to $199
- 12$300 to $399
- 21$400 to $499
- 11$500 to $599
- 14$600 to $699
- 33$700 to $799
- 10$800 to $899
- 2$900 to $999
- 5$1,000 to $1,249
- 6$1,250 to $1,499

Median rent in 2022:
| Michigan Avenue: | $1,033 |
| Fort Wayne: | $761 |
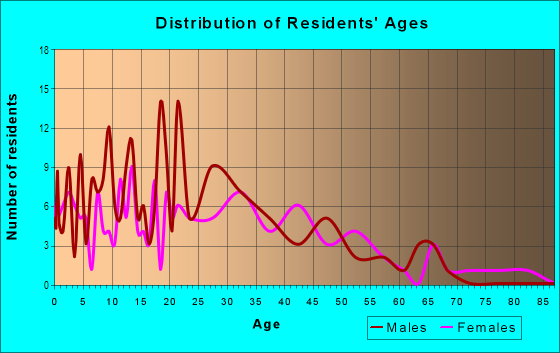
| Males: | 351 |
| Females: | 256 |
Males:
| This neighborhood: | 41.5 years |
| Whole city: | 34.6 years |
| This neighborhood: | 52.1 years |
| Whole city: | 36.5 years |
Average household size:
| Michigan Avenue: | 3.9 people |
| Fort Wayne: | 2.4 people |
Percentage of family households:
| Michigan Avenue: | 70.8% |
| Fort Wayne: | 43.5% |
| Here: | 26.8% |
| Fort Wayne: | 41.1% |
Percentage of married-couple families with children (among all households):
| Michigan Avenue: | 3.2% |
| Fort Wayne: | 26.8% |
Percentage of single-mother households (among all households):
| Michigan Avenue: | 27.9% |
| Fort Wayne: | 12.2% |
Percentage of never married males 15 years old and over:
Percentage of never married females 15 years old and over:
| Michigan Avenue: | 31.0% |
| Fort Wayne: | 18.5% |
Percentage of never married females 15 years old and over:
| Michigan Avenue: | 22.2% |
| city: | 18.1% |
Percentage of people that speak English not well or not at all:
| Michigan Avenue: | 3.9% |
| Fort Wayne: | 2.8% |
Percentage of people born in this state:
Percentage of people born in another U.S. state:
Percentage of native residents but born outside the U.S.:
Percentage of foreign born residents:
| Here: | 74.6% |
| Fort Wayne: | 63.3% |
Percentage of people born in another U.S. state:
| Michigan Avenue: | 18.2% |
| Fort Wayne: | 25.5% |
Percentage of native residents but born outside the U.S.:
| Here: | 1.3% |
| city: | 1.3% |
Percentage of foreign born residents:
| Here: | 7.1% |
| Fort Wayne: | 9.9% |
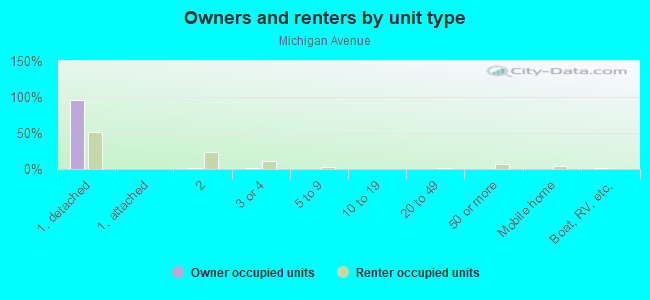
Owner-occupied
Renter-occupied

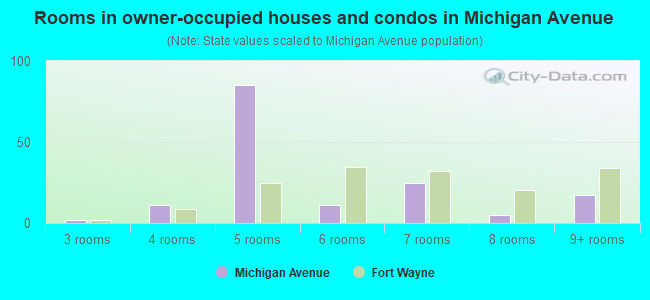
- Rooms in owner-occupied houses and condos in Michigan Avenue
- 01 room
- 02 rooms
- 23 rooms
- 114 rooms
- 855 rooms
- 116 rooms
- 257 rooms
- 58 rooms
- 179+ rooms
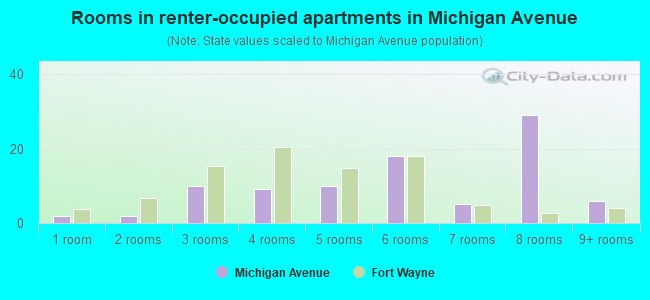
- Rooms in renter-occupied apartments in Michigan Avenue
- 21 room
- 22 rooms
- 103 rooms
- 94 rooms
- 105 rooms
- 186 rooms
- 57 rooms
- 298 rooms
- 69+ rooms
Owner-occupied
Renter-occupied
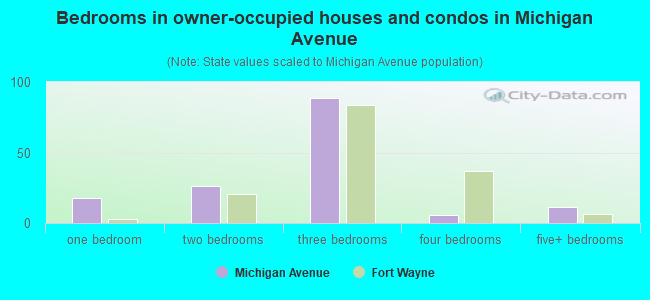
- Bedrooms in owner-occupied houses and condos in Michigan Avenue
- 0no bedroom
- 181 bedroom
- 262 bedrooms
- 893 bedrooms
- 64 bedrooms
- 115+ bedrooms
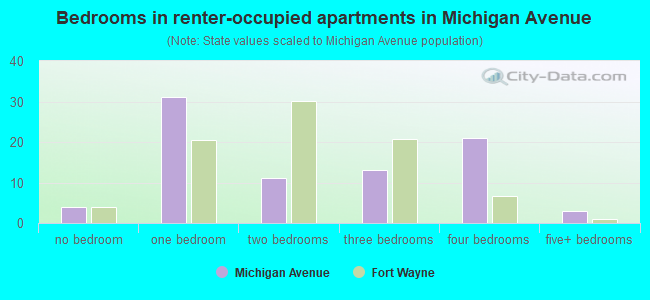
- Bedrooms in renter-occupied apartments in Michigan Avenue
- 4no bedroom
- 311 bedroom
- 112 bedrooms
- 133 bedrooms
- 214 bedrooms
- 35+ bedrooms
Average number of cars or other vehicles available in houses/condos:
Average number of cars or other vehicles available in apartments:
| This neighborhood: | 2.2 |
| Fort Wayne: | 2.0 |
Average number of cars or other vehicles available in apartments:
| Here: | 1.0 |
| city: | 1.3 |
Percentage of units with a mortgage:
| Michigan Avenue: | 58.6% |
| Fort Wayne: | 62.9% |
Average estimated value of detached houses in 2022 (98.2% of all units):
| Michigan Avenue: | $78,050 |
| Indiana: | $257,916 |
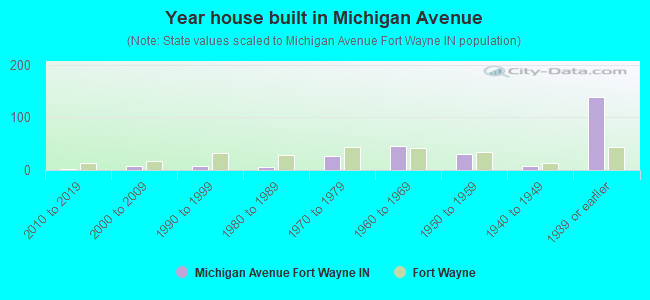
- Year house built in Michigan Avenue
- 02020 or later
- 12010 to 2019
- 72000 to 2009
- 71990 to 1999
- 61980 to 1989
- 271970 to 1979
- 451960 to 1969
- 301950 to 1959
- 81940 to 1949
- 1381939 or earlier
City-data.com crime index for city in 2020 (higher means more crime):
| City: | 243.3 |
| U.S. average: | 219.5 |
Travel time to work (commute)
![Travel time to work (commute)]()
- 1Less than 5 minutes
- 225 to 9 minutes
- 4710 to 14 minutes
- 2015 to 19 minutes
- 2220 to 24 minutes
- 1525 to 29 minutes
- 2530 to 34 minutes
- 835 to 39 minutes
- 640 to 44 minutes
- 645 to 59 minutes
- 690 or more minutes

Means of transportation to work
![Means of transportation to work]()
- 90.7%218Drove a car alone
- 4.2%10Carpooled
- 2.5%6Bus
- 0.4%1Taxi
- 0.8%2Bicycle
- 2.5%6Walked
- 4.6%11Other means
- 0.4%1Worked at home

Time leaving home to go to work
![Time leaving home to go to work]()
- 1712:00 a.m. to 4:59 a.m.
- 35:00 a.m. to 5:29 a.m.
- 65:30 a.m. to 5:59 a.m.
- 256:00 a.m. to 6:29 a.m.
- 126:30 a.m. to 6:59 a.m.
- 217:00 a.m. to 7:29 a.m.
- 87:30 a.m. to 7:59 a.m.
- 38:00 a.m. to 8:29 a.m.
- 58:30 a.m. to 8:59 a.m.
- 99:00 a.m. to 9:59 a.m.
- 410:00 a.m. to 10:59 a.m.
- 411:00 a.m. to 11:59 a.m.
- 3112:00 p.m. to 3:59 p.m.
- 304:00 p.m. to 11:59 p.m.

Occupations of males:
- Percentage of males in management occupations (except farmers):
Here: 3.3% city: 9.3%
- Percentage of males in architecture and engineering occupations:
Here: 2.6% city: 3.4%
- Percentage of males in life, physical, and social science occupations:
Here: 4.4% city: 0.5%
- Percentage of males in community and social services occupations:
Here: 2.1% city: 1.8%
- Percentage of males in education, training, and library occupations:
Here: 4.2% city: 2.9%
- Percentage of males in arts, design, entertainment, sports, and media occupations:
Here: 1.8% city: 1.6%
- Percentage of males in service occupations:
Here: 22.2% city: 12.5%
- Percentage of males in sales and office occupations:
Here: 9.7% city: 16.0%
- Percentage of males in construction, extraction, and maintenance occupations:
Here: 49.0% city: 6.6%
- Percentage of males in production occupations:
Here: 10.7% city: 15.0%
- Percentage of males in material moving occupations:
Here: 7.1% city: 8.5%
Occupations of females:
- Percentage of females in management occupations (except farmers):
Here: 4.3% city: 7.1%
- Percentage of females in computer and mathematical occupations:
Here: 12.6% city: 1.4%
- Percentage of females in education, training, and library occupations:
Here: 5.3% city: 8.7%
- Percentage of females in healthcare practitioners and technical occupations:
Here: 1.2% city: 10.3%
- Percentage of females in service occupations:
Here: 36.9% city: 21.5%
- Percentage of females in sales and office occupations:
Here: 7.2% city: 26.3%
- Percentage of females in construction, extraction, and maintenance occupations:
Here: 3.0% city: 0.2%
- Percentage of females in production occupations:
Here: 36.9% city: 8.4%
- Percentage of females in material moving occupations:
Here: 9.5% city: 3.5%
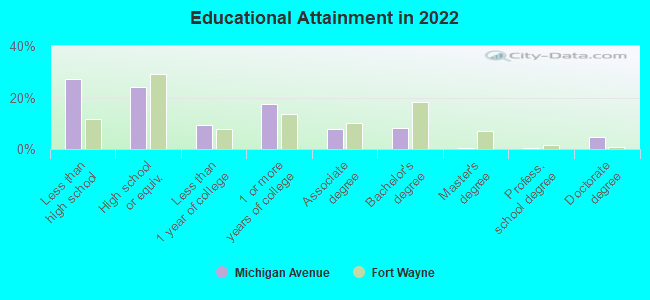
Education in this neighborhood (subdivision or community):
- Percentage of people 3 years and older in K-12 schools:
Michigan Avenue: 25.4% Fort Wayne: 17.8%
- Percentage of people 3 years and older in undergraduate colleges:
Michigan Avenue: 12.4% Fort Wayne: 4.6%
- Percentage of people 3 years and older in grad. or professional schools:
Michigan Avenue: 1.4% Fort Wayne: 1.4%
- Percentage of students K-12 enrolled in private schools:
Michigan Avenue: 10.0% Fort Wayne: 22.8%
Percentage of population below poverty level:
| Michigan Avenue: | 17.7% |
| Fort Wayne: | 14.0% |
Median year owner moved in (as recorded in 2022):
| Michigan Avenue: | 2861 |
| Fort Wayne: | 2010 |
Percentage of married-couple families with both working:
| Michigan Avenue: | 75.0% |
| Fort Wayne: | 62.3% |
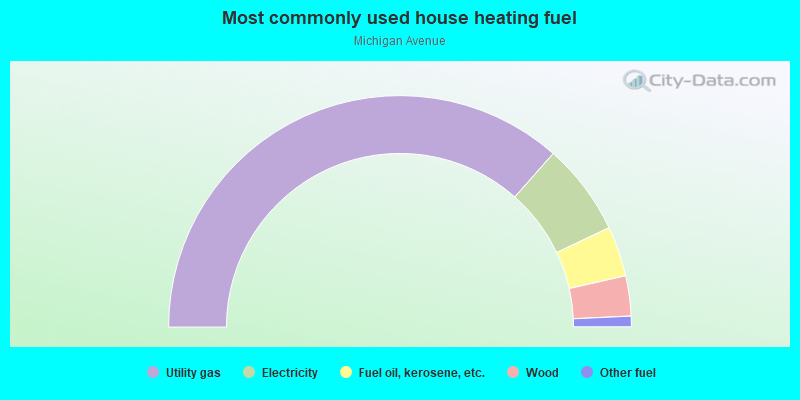
- 73.1%Utility gas
- 12.9%Electricity
- 7.0%Fuel oil, kerosene, etc.
- 5.6%Wood
- 1.5%Other fuel
Roads and streets:
Guthrie St
Length: 0.43 miles
Directions: E-W, SW-NE
Address range: 1100 to 1499
Directions: E-W, SW-NE
Address range: 1100 to 1499
Michigan Ave
Length: 0.39 miles
Directions: E-W, SW-NE
Address range: 1100 to 1499
Directions: E-W, SW-NE
Address range: 1100 to 1499
Thompson Ave
Length: 0.23 miles
Directions: N-S, SE-NW, SW-NE
Address range: 2028 to 2399
Directions: N-S, SE-NW, SW-NE
Address range: 2028 to 2399
Riedmiller Ave
Length: 0.18 miles
Directions: N-S, SE-NW
Address range: 2031 to 2299
Directions: N-S, SE-NW
Address range: 2031 to 2299
Hale Ave
Length: 0.18 miles
Directions: E-W, SW-NE
Address range: 1500 to 1699
Directions: E-W, SW-NE
Address range: 1500 to 1699
Zollars Ave
Length: 0.16 miles
Direction: E-W
Address range: 1300 to 1499
Direction: E-W
Address range: 1300 to 1499
Nelson St
Length: 0.14 miles
Directions: E-W, N-S
Address range: 2020 to 2199
Directions: E-W, N-S
Address range: 2020 to 2199
Leland St
Length: 0.12 miles
Direction: E-W
Address range: 1100 to 1299
Direction: E-W
Address range: 1100 to 1299
Eagle St
Length: 0.10 miles
Direction: E-W
Address range: 1400 to 1499
Direction: E-W
Address range: 1400 to 1499
Broadway
Length: 0.10 miles
Directions: E-W, N-S, SW-NE
Address range: 2019 to 2099
Directions: E-W, N-S, SW-NE
Address range: 2019 to 2099
Brookside St
Length: 0.03 miles
Directions: E-W, N-S
Address range: 2013 to 2099
Directions: E-W, N-S
Address range: 2013 to 2099
Railroad features:
Norfolk and Western Rlwy
Length: 0.52 miles
Direction: SW-NE
Direction: SW-NE