Maryland Manor neighborhood in Tampa, Florida (FL), 33629 detailed profile
Settings
X


Business Search - 14 Million verified businesses
Area: 0.295 square miles
Population: 2,006
Population density:
| Maryland Manor: | 6,794 people per square mile |
| Tampa: | 3,553 people per square mile |

- 1,41366.3%White
- 32115.1%Hispanic or Latino
- 1677.8%Black
- 1165.4%Asian
- 612.9%Two or more races
- 542.5%Some other race

Median household income in 2022:
| Maryland Manor: | $183,277 |
| Tampa: | $71,089 |
Distribution of median household income
![Distribution of median household income]()
- 49Less than $10,000
- 51$10,000 to $19,999
- 32$20,000 to $29,999
- 62$30,000 to $39,999
- 47$40,000 to $49,999
- 85$50,000 to $59,999
- 29$60,000 to $74,999
- 59$75,000 to $99,999
- 23$100,000 to $124,999
- 101$125,000 to $149,999
- 46$150,000 to $199,999
- 261$200,000 or more

Distribution of owner-occupied house/condo value
![Distribution of owner-occupied house/condo value]()
- 4Less than $50,000
- 30$100,000 to $149,999
- 27$150,000 to $199,999
- 29$200,000 to $249,999
- 43$250,000 to $299,999
- 25$300,000 to $399,999
- 125$400,000 to $499,999
- 191$500,000 to $749,999
- 150$750,000 to $999,999
- 132$1,000,000 or more

Distribution of rent paid by renters
![Distribution of rent paid by renters]()
- 45$600 to $699
- 30$700 to $799
- 3$800 to $899
- 6$900 to $999
- 26$1,000 to $1,249
- 128$1,250 to $1,499
- 50$1,500 to $1,999
- 59$2,000 or more

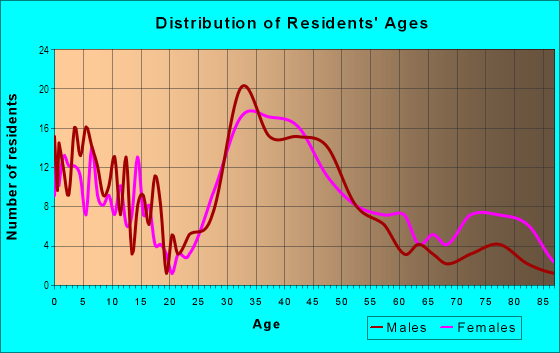
| Males: | 1,024 |
| Females: | 981 |
Males:
| This neighborhood: | 41.5 years |
| Whole city: | 35.5 years |
| This neighborhood: | 42.2 years |
| Whole city: | 35.1 years |
Average household size:
| Maryland Manor: | 7.2 people |
| Tampa: | 2.3 people |
Percentage of family households:
| Maryland Manor: | 65.1% |
| Tampa: | 39.9% |
| Here: | 68.9% |
| Tampa: | 35.4% |
Percentage of married-couple families with children (among all households):
| Maryland Manor: | 25.6% |
| Tampa: | 25.1% |
Percentage of single-mother households (among all households):
| Maryland Manor: | 11.9% |
| Tampa: | 12.2% |
Percentage of never married males 15 years old and over:
Percentage of never married females 15 years old and over:
| Maryland Manor: | 18.3% |
| Tampa: | 23.6% |
Percentage of never married females 15 years old and over:
| Maryland Manor: | 15.1% |
| city: | 20.9% |
Percentage of people that speak English not well or not at all:
| Maryland Manor: | 0.0% |
| Tampa: | 6.4% |
Percentage of people born in this state:
Percentage of people born in another U.S. state:
Percentage of native residents but born outside the U.S.:
Percentage of foreign born residents:
| Here: | 46.2% |
| Tampa: | 39.7% |
Percentage of people born in another U.S. state:
| Maryland Manor: | 42.8% |
| Tampa: | 35.7% |
Percentage of native residents but born outside the U.S.:
| Here: | 4.1% |
| city: | 4.6% |
Percentage of foreign born residents:
| Here: | 6.9% |
| Tampa: | 20.0% |

Owner-occupied
Renter-occupied


- Rooms in owner-occupied houses and condos in Maryland Manor
- 01 room
- 12 rooms
- 233 rooms
- 884 rooms
- 505 rooms
- 1126 rooms
- 1067 rooms
- 1318 rooms
- 1329+ rooms

- Rooms in renter-occupied apartments in Maryland Manor
- 01 room
- 172 rooms
- 263 rooms
- 1284 rooms
- 725 rooms
- 316 rooms
- 27 rooms
- 428 rooms
- 79+ rooms
Owner-occupied
Renter-occupied

- Bedrooms in owner-occupied houses and condos in Maryland Manor
- 0no bedroom
- 11 bedroom
- 762 bedrooms
- 2113 bedrooms
- 2174 bedrooms
- 1115+ bedrooms

- Bedrooms in renter-occupied apartments in Maryland Manor
- 0no bedroom
- 261 bedroom
- 1502 bedrooms
- 483 bedrooms
- 444 bedrooms
- 05+ bedrooms
Average number of cars or other vehicles available in houses/condos:
Average number of cars or other vehicles available in apartments:
| This neighborhood: | 2.4 |
| Tampa: | 1.9 |
Average number of cars or other vehicles available in apartments:
| Here: | |
| city: |
Percentage of units with a mortgage:
| Maryland Manor: | 68.1% |
| Tampa: | 65.8% |
Average estimated value of detached houses in 2022 (92.4% of all units):
| Maryland Manor: | $710,908 |
| Tampa: | $505,567 |

- Year house built in Maryland Manor
- 192020 or later
- 662010 to 2019
- 862000 to 2009
- 281990 to 1999
- 1331980 to 1989
- 231970 to 1979
- 741960 to 1969
- 2901950 to 1959
- 771940 to 1949
- 351939 or earlier

City-data.com crime index for city in 2020 (higher means more crime):
| City: | 212.7 |
| U.S. average: | 219.5 |
Travel time to work (commute)
![Travel time to work (commute)]()
- 9Less than 5 minutes
- 615 to 9 minutes
- 10310 to 14 minutes
- 16715 to 19 minutes
- 14220 to 24 minutes
- 11425 to 29 minutes
- 14730 to 34 minutes
- 4635 to 39 minutes
- 1440 to 44 minutes
- 2145 to 59 minutes
- 2060 to 89 minutes
- 590 or more minutes

Means of transportation to work
![Means of transportation to work]()
- 75.3%768Drove a car alone
- 4.5%46Carpooled
- 1.2%12Bus
- 0.8%8Bicycle
- 0.3%3Walked
- 1.8%18Other means
- 19.9%203Worked at home

Time leaving home to go to work
![Time leaving home to go to work]()
- 1712:00 a.m. to 4:59 a.m.
- 75:00 a.m. to 5:29 a.m.
- 95:30 a.m. to 5:59 a.m.
- 336:00 a.m. to 6:29 a.m.
- 596:30 a.m. to 6:59 a.m.
- 2037:00 a.m. to 7:29 a.m.
- 1387:30 a.m. to 7:59 a.m.
- 1768:00 a.m. to 8:29 a.m.
- 1048:30 a.m. to 8:59 a.m.
- 699:00 a.m. to 9:59 a.m.
- 1310:00 a.m. to 10:59 a.m.
- 2112:00 p.m. to 3:59 p.m.
- 44:00 p.m. to 11:59 p.m.

Occupations of males:
- Percentage of males in management occupations (except farmers):
Here: 11.7% city: 14.3%
- Percentage of males in business and financial operations occupations:
Here: 8.2% city: 7.8%
- Percentage of males in computer and mathematical occupations:
Here: 4.6% city: 6.0%
- Percentage of males in architecture and engineering occupations:
Here: 3.8% city: 2.6%
- Percentage of males in life, physical, and social science occupations:
Here: 6.4% city: 0.8%
- Percentage of males in legal occupations:
Here: 9.5% city: 2.8%
- Percentage of males in arts, design, entertainment, sports, and media occupations:
Here: 1.5% city: 2.5%
- Percentage of males in healthcare practitioners and technical occupations:
Here: 6.6% city: 4.9%
- Percentage of males in service occupations:
Here: 12.1% city: 13.7%
- Percentage of males in sales and office occupations:
Here: 16.6% city: 16.3%
- Percentage of males in farming, fishing, and forestry occupations:
Here: 1.1% city: 0.6%
- Percentage of males in construction, extraction, and maintenance occupations:
Here: 9.0% city: 8.2%
- Percentage of males in production occupations:
Here: 2.5% city: 3.7%
- Percentage of males in transportation occupations:
Here: 1.5% city: 5.8%
- Percentage of males in material moving occupations:
Here: 4.2% city: 3.8%
Occupations of females:
- Percentage of females in management occupations (except farmers):
Here: 14.6% city: 10.9%
- Percentage of females in business and financial operations occupations:
Here: 13.0% city: 8.5%
- Percentage of females in computer and mathematical occupations:
Here: 7.9% city: 2.4%
- Percentage of females in community and social services occupations:
Here: 9.9% city: 2.1%
- Percentage of females in legal occupations:
Here: 2.7% city: 2.7%
- Percentage of females in education, training, and library occupations:
Here: 8.5% city: 7.2%
- Percentage of females in healthcare practitioners and technical occupations:
Here: 13.1% city: 10.3%
- Percentage of females in service occupations:
Here: 4.4% city: 19.1%
- Percentage of females in sales and office occupations:
Here: 23.8% city: 27.1%
Percentage of people 16-64 in Armed Forces:
| Maryland Manor: | 1.0% |
| Tampa: | 1.1% |
Education in this neighborhood (subdivision or community):
- Percentage of people 3 years and older in K-12 schools:
Maryland Manor: 26.1% Tampa: 14.3%
- Percentage of people 3 years and older in undergraduate colleges:
Maryland Manor: 3.8% Tampa: 7.8%
- Percentage of people 3 years and older in grad. or professional schools:
Maryland Manor: 2.5% Tampa: 2.0%
- Percentage of students K-12 enrolled in private schools:
Maryland Manor: 42.4% Tampa: 12.5%
Percentage of population below poverty level:
| Maryland Manor: | 8.1% |
| Tampa: | 16.3% |
Median year owner moved in (as recorded in 2022):
| Maryland Manor: | 2010 |
| Tampa: | 2013 |
Percentage of married-couple families with both working:
| Maryland Manor: | 81.0% |
| Tampa: | 70.4% |

- 80.8%Electricity
- 9.8%Utility gas
- 5.5%Bottled, tank, or LP gas
- 2.2%Solar energy
- 1.8%No fuel used
Roads and streets:
S Hubert Ave
Length: 0.59 miles
Direction: N-S
Address range: 2450 to 3399
Direction: N-S
Address range: 2450 to 3399
W Obispo St
Length: 0.54 miles
Directions: E-W, SW-NE
Address range: 4000 to 4399
Directions: E-W, SW-NE
Address range: 4000 to 4399
W San Pedro St
Length: 0.53 miles
Direction: E-W
Address range: 4000 to 4399
Direction: E-W
Address range: 4000 to 4399
W Tacon St
Length: 0.53 miles
Direction: E-W
Address range: 4000 to 4399
Direction: E-W
Address range: 4000 to 4399
W San Juan St
Length: 0.53 miles
Direction: E-W
Address range: 4000 to 4399
Direction: E-W
Address range: 4000 to 4399
S Manhattan Ave
Length: 0.43 miles
Direction: N-S
Address range: 2950 to 3099
Direction: N-S
Address range: 2950 to 3099
W Leona St
Length: 0.42 miles
Direction: E-W
Address range: 4000 to 4299
Direction: E-W
Address range: 4000 to 4299
W Corona St
Length: 0.42 miles
Direction: E-W
Address range: 4000 to 4299
Direction: E-W
Address range: 4000 to 4299
W Vasconia St
Length: 0.42 miles
Direction: E-W
Address range: 4000 to 4299
Direction: E-W
Address range: 4000 to 4299
Sevilla St
Length: 0.42 miles
Direction: E-W
Address range: 4000 to 4299
Direction: E-W
Address range: 4000 to 4299
S Lois Ave
Length: 0.36 miles
Direction: N-S
Direction: N-S
S Clark Ave
Length: 0.31 miles
Direction: N-S
Address range: 3100 to 3449
Direction: N-S
Address range: 3100 to 3449
W Santiago St
Length: 0.25 miles
Direction: E-W
Address range: 4200 to 4399
Direction: E-W
Address range: 4200 to 4399
W Empedrado St
Length: 0.25 miles
Direction: E-W
Address range: 4200 to 4399
Direction: E-W
Address range: 4200 to 4399
W Barcelona St
Length: 0.25 miles
Direction: E-W
Address range: 4200 to 4399
Direction: E-W
Address range: 4200 to 4399
W Granada St
Length: 0.25 miles
Direction: E-W
Address range: 4200 to 4399
Direction: E-W
Address range: 4200 to 4399
W Palmira Ave
Length: 0.14 miles
Direction: E-W
Address range: 4200 to 4299
Direction: E-W
Address range: 4200 to 4299
W Bay To Bay Blvd
Length: 0.11 miles
Direction: E-W
Address range: 4300 to 4399
Direction: E-W
Address range: 4300 to 4399