Mandalay neighborhood in Wantagh, New York (NY), 11793 detailed profile
Settings
X


Business Search - 14 Million verified businesses
Area: 0.142 square miles
Population: 204
Population density:
| Mandalay: | 1,432 people per square mile |
| Wantagh: | 4,682 people per square mile |

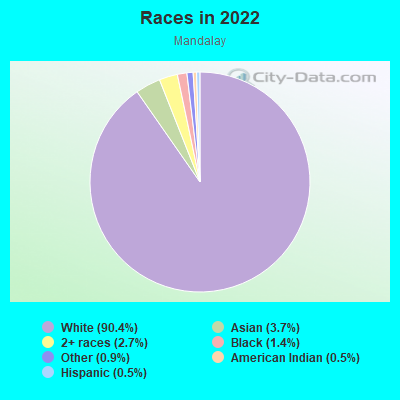
- 19890.4%White
- 83.7%Asian
- 62.7%Two or more races
- 31.4%Black
- 20.9%Some other race
- 10.5%American Indian
- 10.5%Hispanic or Latino

Median household income in 2022:
| Mandalay: | $125,179 |
| Wantagh: | $180,167 |
Distribution of median household income
![Distribution of median household income]()
- 2Less than $10,000
- 4$10,000 to $19,999
- 3$20,000 to $29,999
- 4$30,000 to $39,999
- 3$40,000 to $49,999
- 7$50,000 to $59,999
- 7$60,000 to $74,999
- 4$75,000 to $99,999
- 15$100,000 to $124,999
- 15$125,000 to $149,999
- 7$150,000 to $199,999
- 9$200,000 or more

Distribution of owner-occupied house/condo value
![Distribution of owner-occupied house/condo value]()
- 3$50,000 to $99,999
- 1$250,000 to $299,999
- 2$300,000 to $399,999
- 7$400,000 to $499,999
- 47$500,000 to $749,999
- 4$750,000 to $999,999
- 17$1,000,000 or more

Distribution of rent paid by renters
![Distribution of rent paid by renters]()
- 4$100 to $199
- 3$1,250 to $1,499
- 2$2,000 or more

| Males: | 75 |
| Females: | 128 |
Males:
| This neighborhood: | 47.7 years |
| Whole city: | 37.4 years |
| This neighborhood: | 20.9 years |
| Whole city: | 43.8 years |
Average household size:
| Mandalay: | 3.5 people |
| Wantagh: | 38.0 people |
Percentage of family households:
| Mandalay: | 61.6% |
| Wantagh: | 59.9% |
| Here: | 73.0% |
| Wantagh: | 67.3% |
Percentage of married-couple families with children (among all households):
| Mandalay: | 27.4% |
| Wantagh: | 27.5% |
Percentage of single-mother households (among all households):
| Mandalay: | 1.2% |
| Wantagh: | 4.1% |
Percentage of never married males 15 years old and over:
Percentage of never married females 15 years old and over:
| Mandalay: | 6.2% |
| Wantagh: | 18.5% |
Percentage of never married females 15 years old and over:
| Mandalay: | 33.1% |
| place: | 12.0% |
Percentage of people that speak English not well or not at all:
| Mandalay: | 6.2% |
| Wantagh: | 1.0% |
Percentage of people born in this state:
Percentage of people born in another U.S. state:
Percentage of native residents but born outside the U.S.:
Percentage of foreign born residents:
| Here: | 85.7% |
| Wantagh: | 86.5% |
Percentage of people born in another U.S. state:
| Mandalay: | 3.7% |
| Wantagh: | 4.7% |
Percentage of native residents but born outside the U.S.:
| Here: | 0.3% |
| place: | 0.6% |
Percentage of foreign born residents:
| Here: | 10.3% |
| Wantagh: | 8.2% |
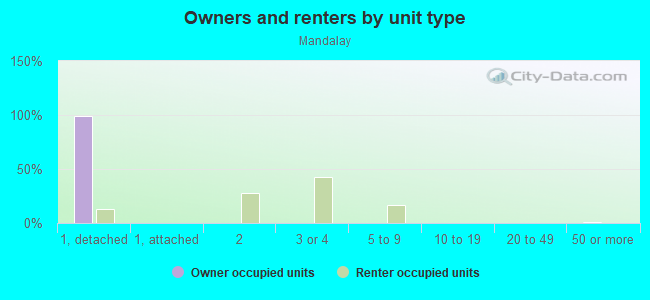
Owner-occupied
Renter-occupied

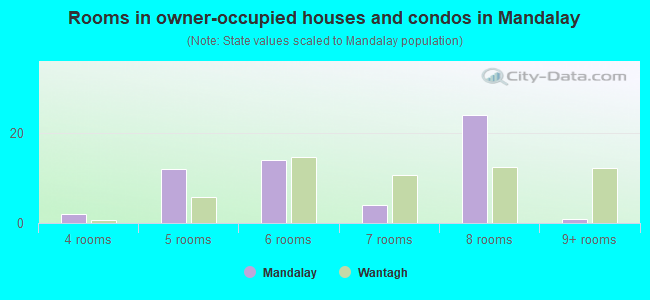
- Rooms in owner-occupied houses and condos in Mandalay
- 01 room
- 02 rooms
- 03 rooms
- 24 rooms
- 125 rooms
- 146 rooms
- 47 rooms
- 248 rooms
- 19+ rooms
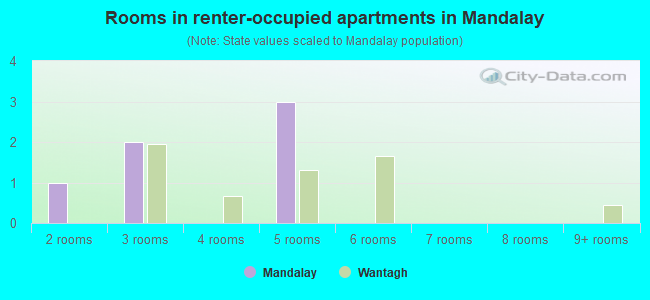
- Rooms in renter-occupied apartments in Mandalay
- 01 room
- 12 rooms
- 23 rooms
- 04 rooms
- 35 rooms
- 06 rooms
- 07 rooms
- 08 rooms
- 09+ rooms
Owner-occupied
Renter-occupied
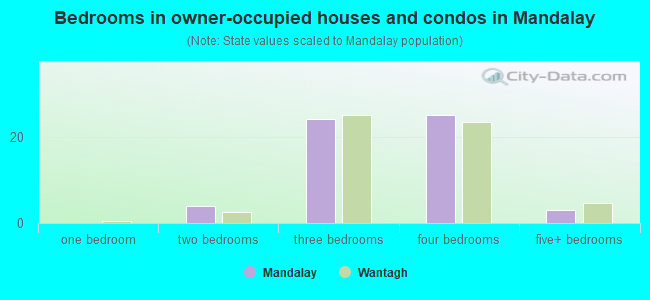
- Bedrooms in owner-occupied houses and condos in Mandalay
- 0no bedroom
- 01 bedroom
- 42 bedrooms
- 243 bedrooms
- 254 bedrooms
- 35+ bedrooms
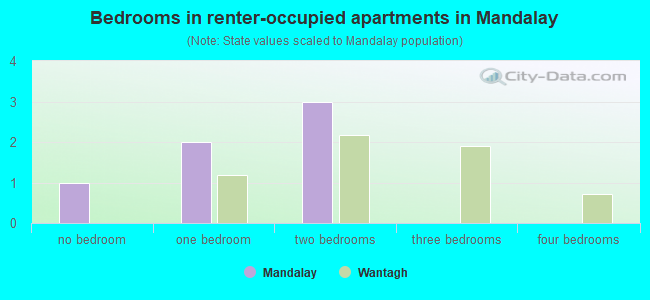
- Bedrooms in renter-occupied apartments in Mandalay
- 1no bedroom
- 21 bedroom
- 32 bedrooms
- 03 bedrooms
- 04 bedrooms
- 05+ bedrooms
Average number of cars or other vehicles available in houses/condos:
Average number of cars or other vehicles available in apartments:
| This neighborhood: | 2.4 |
| Wantagh: | 2.2 |
Average number of cars or other vehicles available in apartments:
| Here: | |
| place: |
Percentage of units with a mortgage:
| Mandalay: | 76.2% |
| Wantagh: | 61.7% |
Average estimated value of detached houses in 2022 (100.0% of all units):
| Mandalay: | $594,336 |
| New York: | $476,719 |
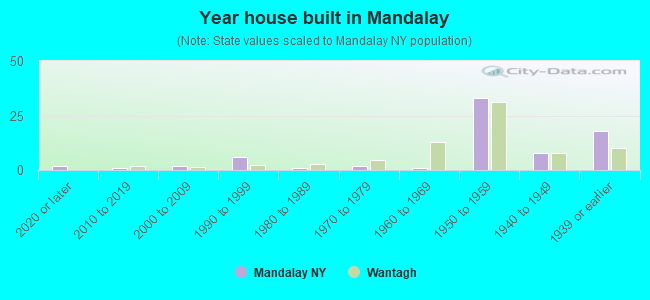
- Year house built in Mandalay
- 22020 or later
- 12010 to 2019
- 22000 to 2009
- 61990 to 1999
- 11980 to 1989
- 21970 to 1979
- 11960 to 1969
- 331950 to 1959
- 81940 to 1949
- 181939 or earlier
Travel time to work (commute)
![Travel time to work (commute)]()
- 1Less than 5 minutes
- 75 to 9 minutes
- 810 to 14 minutes
- 1715 to 19 minutes
- 3320 to 24 minutes
- 1125 to 29 minutes
- 2930 to 34 minutes
- 435 to 39 minutes
- 1640 to 44 minutes
- 545 to 59 minutes
- 1860 to 89 minutes
- 1690 or more minutes

Means of transportation to work
![Means of transportation to work]()
- 68.2%44Drove a car alone
- 3.1%2Carpooled
- 1.5%1Bus
- 9.3%6Subway or elevated rail
- 10.8%7Long-distance train or commuter rail
- 1.5%1Walked
- 1.5%1Other means
- 15.5%10Worked at home

Time leaving home to go to work
![Time leaving home to go to work]()
- 412:00 a.m. to 4:59 a.m.
- 45:00 a.m. to 5:29 a.m.
- 75:30 a.m. to 5:59 a.m.
- 206:00 a.m. to 6:29 a.m.
- 116:30 a.m. to 6:59 a.m.
- 397:00 a.m. to 7:29 a.m.
- 277:30 a.m. to 7:59 a.m.
- 228:00 a.m. to 8:29 a.m.
- 208:30 a.m. to 8:59 a.m.
- 39:00 a.m. to 9:59 a.m.
- 110:00 a.m. to 10:59 a.m.
- 211:00 a.m. to 11:59 a.m.
- 1012:00 p.m. to 3:59 p.m.
- 34:00 p.m. to 11:59 p.m.

Occupations of males:
- Percentage of males in management occupations (except farmers):
Here: 46.2% place: 16.9%
- Percentage of males in business and financial operations occupations:
Here: 9.2% place: 11.6%
- Percentage of males in computer and mathematical occupations:
Here: 5.1% place: 2.3%
- Percentage of males in architecture and engineering occupations:
Here: 56.9% place: 3.1%
- Percentage of males in community and social services occupations:
Here: 184.9% place: 2.3%
- Percentage of males in legal occupations:
Here: 47.3% place: 2.9%
- Percentage of males in education, training, and library occupations:
Here: 217.8% place: 5.5%
- Percentage of males in arts, design, entertainment, sports, and media occupations:
Here: 65.2% place: 1.8%
- Percentage of males in healthcare practitioners and technical occupations:
Here: 225.0% place: 4.2%
- Percentage of males in service occupations:
Here: 11.3% place: 14.9%
- Percentage of males in sales and office occupations:
Here: 448.1% place: 16.1%
- Percentage of males in construction, extraction, and maintenance occupations:
Here: 7.2% place: 5.8%
- Percentage of males in production occupations:
Here: 51.6% place: 3.2%
- Percentage of males in transportation occupations:
Here: 14.9% place: 2.5%
- Percentage of males in material moving occupations:
Here: 38.6% place: 2.0%
Occupations of females:
- Percentage of females in management occupations (except farmers):
Here: 232.0% place: 11.3%
- Percentage of females in business and financial operations occupations:
Here: 3.0% place: 8.5%
- Percentage of females in computer and mathematical occupations:
Here: 20.5% place: 1.4%
- Percentage of females in architecture and engineering occupations:
Here: 21.5% place: 0.3%
- Percentage of females in life, physical, and social science occupations:
Here: 71.6% place: 1.0%
- Percentage of females in community and social services occupations:
Here: 4.2% place: 3.9%
- Percentage of females in legal occupations:
Here: 123.5% place: 3.9%
- Percentage of females in education, training, and library occupations:
Here: 50.2% place: 20.3%
- Percentage of females in arts, design, entertainment, sports, and media occupations:
Here: 150.8% place: 3.2%
- Percentage of females in healthcare practitioners and technical occupations:
Here: 6.8% place: 8.6%
- Percentage of females in service occupations:
Here: 9.3% place: 11.7%
- Percentage of females in sales and office occupations:
Here: 21.5% place: 22.1%
- Percentage of females in production occupations:
Here: 41.9% place: 2.2%
- Percentage of females in transportation occupations:
Here: 66.2% place: 0.9%
- Percentage of females in material moving occupations:
Here: 5.1% place: 0.5%
Percentage of people 16-64 in Armed Forces:
| Mandalay: | 0.0% |
| Wantagh: | 0.0% |
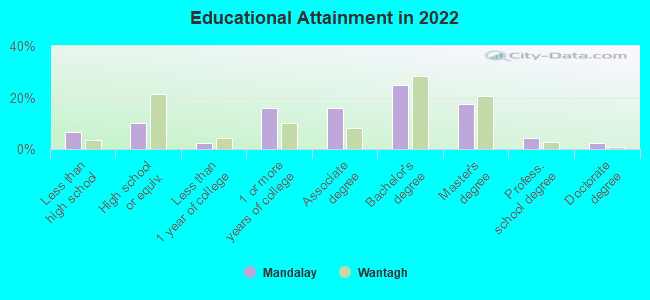
Education in this neighborhood (subdivision or community):
- Percentage of people 3 years and older in K-12 schools:
Mandalay: 28.5% Wantagh: 20.1%
- Percentage of people 3 years and older in undergraduate colleges:
Mandalay: 10.5% Wantagh: 4.7%
- Percentage of people 3 years and older in grad. or professional schools:
Mandalay: 1.0% Wantagh: 1.4%
- Percentage of students K-12 enrolled in private schools:
Mandalay: 0.0% Wantagh: 3.5%
Percentage of population below poverty level:
| Mandalay: | 4.7% |
| Wantagh: | 3.6% |
Median year owner moved in (as recorded in 2022):
| Mandalay: | 2001 |
| Wantagh: | 2000 |
Percentage of married-couple families with both working:
| Mandalay: | 65.3% |
| Wantagh: | 74.6% |
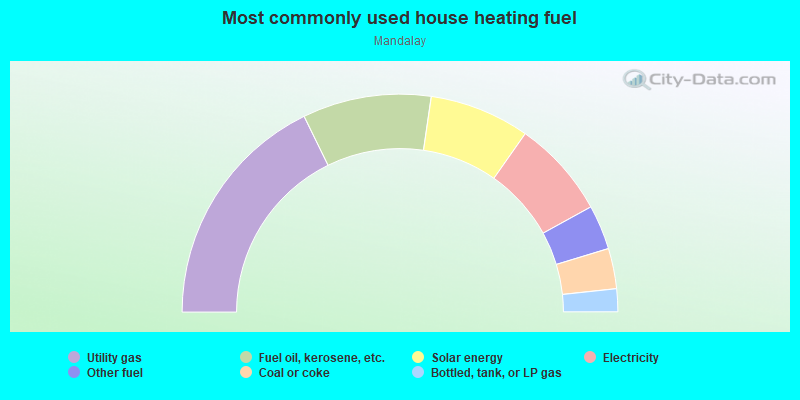
- 35.5%Utility gas
- 19.1%Fuel oil, kerosene, etc.
- 14.9%Solar energy
- 14.5%Electricity
- 6.6%Other fuel
- 6.0%Coal or coke
- 3.4%Bottled, tank, or LP gas
Roads and streets:
Riverside Dr
Length: 0.93 miles
Directions: E-W, N-S, SE-NW, SW-NE
Address range: 2617 to 3198
Directions: E-W, N-S, SE-NW, SW-NE
Address range: 2617 to 3198
Bayview Ave
Length: 0.73 miles
Directions: E-W, N-S, SE-NW, SW-NE
Address range: 2669 to 3099
Directions: E-W, N-S, SE-NW, SW-NE
Address range: 2669 to 3099
Mandalay Beach Rd
Length: 0.73 miles
Directions: N-S, SW-NE
Address range: 2646 to 3028
Directions: N-S, SW-NE
Address range: 2646 to 3028
Seaford Ct
Length: 0.18 miles
Direction: E-W
Address range: 2916 to 2999
Direction: E-W
Address range: 2916 to 2999
Huntington Ct
Length: 0.18 miles
Direction: E-W
Address range: 2941 to 3009
Direction: E-W
Address range: 2941 to 3009
Hampton Ct
Length: 0.17 miles
Direction: E-W
Address range: 2918 to 2999
Direction: E-W
Address range: 2918 to 2999
Bayview Ct (Riverside Dr)
Length: 0.15 miles
Directions: E-W, N-S, SE-NW
Address range: 3035 to 3139
Directions: E-W, N-S, SE-NW
Address range: 3035 to 3139
Bayside Ct
Length: 0.15 miles
Direction: E-W
Address range: 2928 to 2999
Direction: E-W
Address range: 2928 to 2999
Hemlock Pl
Length: 0.13 miles
Direction: E-W
Address range: 2964 to 3015
Direction: E-W
Address range: 2964 to 3015
Other features:
Bellmore Crk
Length: 0.02 miles
Direction: SW-NE
Direction: SW-NE