Lower Main Street neighborhood in East Orange, New Jersey (NJ), 07017, 07018 detailed profile
Settings
X


Business Search - 14 Million verified businesses
Area: 0.089 square miles
Population: 2,031
Population density:
| Lower Main Street: | 22,758 people per square mile |
| East Orange: | 17,426 people per square mile |

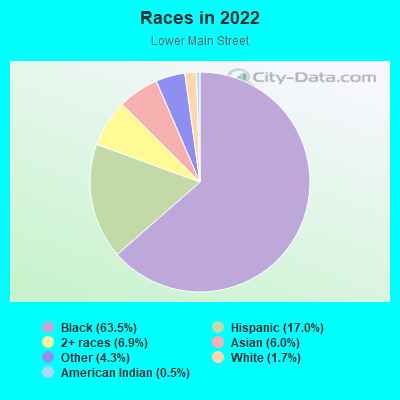
- 1,52063.5%Black
- 40717.0%Hispanic or Latino
- 1646.9%Two or more races
- 1446.0%Asian
- 1034.3%Some other race
- 411.7%White
- 130.5%American Indian
Median household income in 2022:
| Lower Main Street: | $50,765 |
| East Orange: | $43,527 |
Distribution of median household income
![Distribution of median household income]()
- 94Less than $10,000
- 122$10,000 to $19,999
- 134$20,000 to $29,999
- 75$30,000 to $39,999
- 192$40,000 to $49,999
- 63$50,000 to $59,999
- 111$60,000 to $74,999
- 138$75,000 to $99,999
- 145$100,000 to $124,999
- 33$125,000 to $149,999
- 10$150,000 to $199,999
- 90$200,000 or more

Distribution of owner-occupied house/condo value
![Distribution of owner-occupied house/condo value]()
- 11Less than $50,000
- 4$50,000 to $99,999
- 22$100,000 to $149,999
- 34$150,000 to $199,999
- 45$200,000 to $249,999
- 19$250,000 to $299,999
- 49$300,000 to $399,999
- 9$400,000 to $499,999
- 137$500,000 to $749,999
- 6$1,000,000 or more

Distribution of rent paid by renters
![Distribution of rent paid by renters]()
- 58Less than $100
- 51$100 to $199
- 116$200 to $299
- 94$300 to $399
- 30$400 to $499
- 39$500 to $599
- 189$600 to $699
- 33$700 to $799
- 18$800 to $899
- 97$900 to $999
- 230$1,000 to $1,249
- 79$1,250 to $1,499
- 137$1,500 to $1,999
- 88$2,000 or more

Median rent in 2022:
| Lower Main Street: | $1,159 |
| East Orange: | $1,074 |
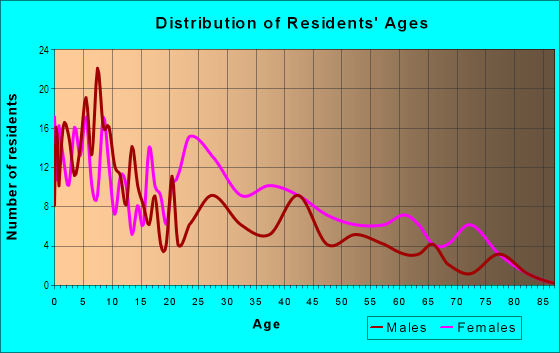
| Males: | 986 |
| Females: | 1,045 |
Males:
| This neighborhood: | 38.6 years |
| Whole city: | 34.0 years |
| This neighborhood: | 36.8 years |
| Whole city: | 39.2 years |
Average household size:
| Lower Main Street: | 4.7 people |
| East Orange: | 2.4 people |
Percentage of family households:
| Lower Main Street: | 43.9% |
| East Orange: | 35.5% |
| Here: | 21.4% |
| East Orange: | 21.9% |
Percentage of married-couple families with children (among all households):
| Lower Main Street: | 13.3% |
| East Orange: | 17.7% |
Percentage of single-mother households (among all households):
| Lower Main Street: | 22.3% |
| East Orange: | 19.1% |
Percentage of never married males 15 years old and over:
Percentage of never married females 15 years old and over:
| Lower Main Street: | 13.5% |
| East Orange: | 27.1% |
Percentage of never married females 15 years old and over:
| Lower Main Street: | 25.0% |
| city: | 26.2% |
Percentage of people that speak English not well or not at all:
| Lower Main Street: | 6.5% |
| East Orange: | 4.0% |
Percentage of people born in this state:
Percentage of people born in another U.S. state:
Percentage of native residents but born outside the U.S.:
Percentage of foreign born residents:
| Here: | 45.3% |
| East Orange: | 44.2% |
Percentage of people born in another U.S. state:
| Lower Main Street: | 16.6% |
| East Orange: | 18.0% |
Percentage of native residents but born outside the U.S.:
| Here: | 2.4% |
| city: | 2.4% |
Percentage of foreign born residents:
| Here: | 37.1% |
| East Orange: | 35.4% |
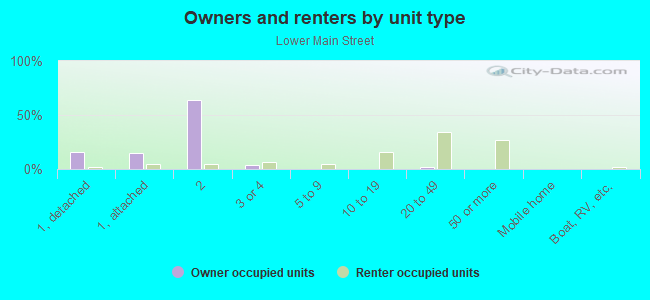
Owner-occupied
Renter-occupied

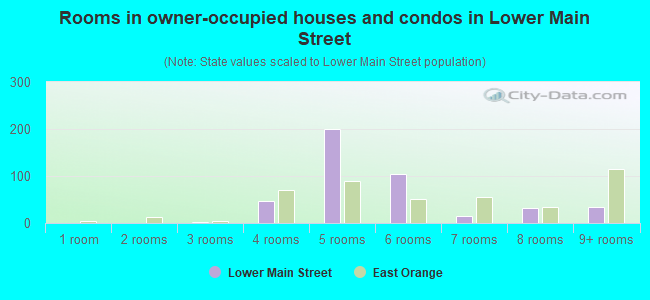
- Rooms in owner-occupied houses and condos in Lower Main Street
- 01 room
- 02 rooms
- 33 rooms
- 474 rooms
- 2005 rooms
- 1046 rooms
- 157 rooms
- 328 rooms
- 359+ rooms
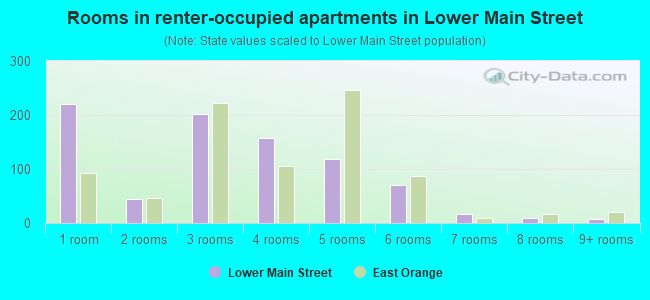
- Rooms in renter-occupied apartments in Lower Main Street
- 2211 room
- 442 rooms
- 2013 rooms
- 1584 rooms
- 1195 rooms
- 716 rooms
- 167 rooms
- 98 rooms
- 79+ rooms
Owner-occupied
Renter-occupied
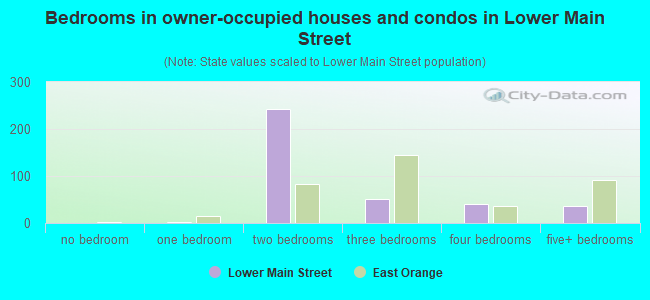
- Bedrooms in owner-occupied houses and condos in Lower Main Street
- 0no bedroom
- 31 bedroom
- 2432 bedrooms
- 513 bedrooms
- 404 bedrooms
- 365+ bedrooms
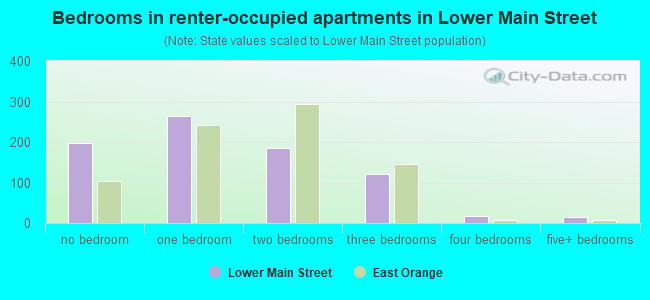
- Bedrooms in renter-occupied apartments in Lower Main Street
- 198no bedroom
- 2641 bedroom
- 1862 bedrooms
- 1213 bedrooms
- 174 bedrooms
- 165+ bedrooms
Average number of cars or other vehicles available in houses/condos:
Average number of cars or other vehicles available in apartments:
| This neighborhood: | 1.0 |
| East Orange: | 1.9 |
Average number of cars or other vehicles available in apartments:
| Here: | 0.8 |
| city: | 0.7 |
Percentage of units with a mortgage:
| Lower Main Street: | 32.5% |
| East Orange: | 72.5% |
Housing prices:
- Average estimated value of detached houses in 2022 (4.5% of all units):
Lower Main Street: $2,137,736 East Orange: $351,364
- Average estimated value of housing units in 2-unit structures in 2022 (19.0% of all units):
This neighborhood: $142,702 East Orange: $450,324
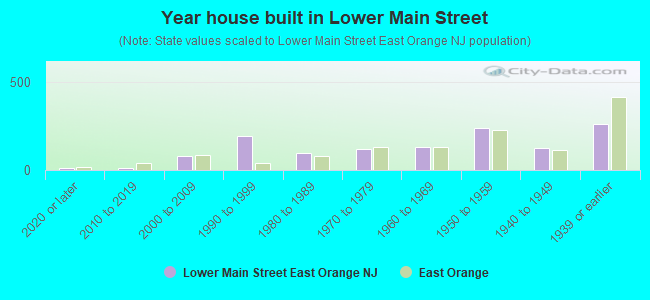
- Year house built in Lower Main Street
- 142020 or later
- 132010 to 2019
- 772000 to 2009
- 1931990 to 1999
- 991980 to 1989
- 1211970 to 1979
- 1331960 to 1969
- 2411950 to 1959
- 1251940 to 1949
- 2601939 or earlier
City-data.com crime index for city in 2020 (higher means more crime):
| City: | 201.2 |
| U.S. average: | 219.5 |
Travel time to work (commute)
![Travel time to work (commute)]()
- 19Less than 5 minutes
- 265 to 9 minutes
- 3610 to 14 minutes
- 6515 to 19 minutes
- 13320 to 24 minutes
- 5625 to 29 minutes
- 18330 to 34 minutes
- 1735 to 39 minutes
- 3640 to 44 minutes
- 10145 to 59 minutes
- 7360 to 89 minutes
- 5490 or more minutes

Means of transportation to work
![Means of transportation to work]()
- 38.8%322Drove a car alone
- 17.0%141Carpooled
- 19.4%161Bus
- 6.0%50Subway or elevated rail
- 11.3%94Long-distance train or commuter rail
- 4.1%34Taxi
- 11.3%94Walked
- 11.0%91Other means
- 2.7%22Worked at home

Time leaving home to go to work
![Time leaving home to go to work]()
- 5012:00 a.m. to 4:59 a.m.
- 135:00 a.m. to 5:29 a.m.
- 205:30 a.m. to 5:59 a.m.
- 196:00 a.m. to 6:29 a.m.
- 386:30 a.m. to 6:59 a.m.
- 1017:00 a.m. to 7:29 a.m.
- 887:30 a.m. to 7:59 a.m.
- 1098:00 a.m. to 8:29 a.m.
- 558:30 a.m. to 8:59 a.m.
- 249:00 a.m. to 9:59 a.m.
- 2210:00 a.m. to 10:59 a.m.
- 5511:00 a.m. to 11:59 a.m.
- 8312:00 p.m. to 3:59 p.m.
- 964:00 p.m. to 11:59 p.m.

Occupations of males:
- Percentage of males in management occupations (except farmers):
Here: 2.5% city: 6.9%
- Percentage of males in architecture and engineering occupations:
Here: 1.4% city: 3.3%
- Percentage of males in community and social services occupations:
Here: 3.9% city: 1.3%
- Percentage of males in legal occupations:
Here: 1.9% city: 0.6%
- Percentage of males in education, training, and library occupations:
Here: 1.6% city: 2.2%
- Percentage of males in arts, design, entertainment, sports, and media occupations:
Here: 1.2% city: 1.6%
- Percentage of males in healthcare practitioners and technical occupations:
Here: 2.4% city: 2.7%
- Percentage of males in service occupations:
Here: 21.8% city: 21.2%
- Percentage of males in sales and office occupations:
Here: 9.4% city: 16.5%
- Percentage of males in construction, extraction, and maintenance occupations:
Here: 2.6% city: 6.4%
- Percentage of males in production occupations:
Here: 2.2% city: 4.7%
- Percentage of males in transportation occupations:
Here: 21.8% city: 12.2%
- Percentage of males in material moving occupations:
Here: 18.3% city: 10.6%
Occupations of females:
- Percentage of females in management occupations (except farmers):
Here: 3.3% city: 6.5%
- Percentage of females in business and financial operations occupations:
Here: 1.9% city: 5.7%
- Percentage of females in computer and mathematical occupations:
Here: 1.8% city: 1.0%
- Percentage of females in community and social services occupations:
Here: 4.3% city: 4.4%
- Percentage of females in healthcare practitioners and technical occupations:
Here: 4.7% city: 6.6%
- Percentage of females in service occupations:
Here: 40.4% city: 32.6%
- Percentage of females in sales and office occupations:
Here: 28.3% city: 27.4%
- Percentage of females in production occupations:
Here: 7.1% city: 1.1%
- Percentage of females in material moving occupations:
Here: 7.6% city: 3.3%
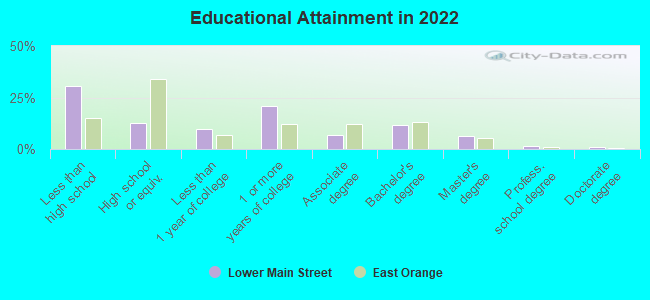
Education in this neighborhood (subdivision or community):
- Percentage of people 3 years and older in K-12 schools:
Lower Main Street: 37.4% East Orange: 19.7%
- Percentage of people 3 years and older in undergraduate colleges:
Lower Main Street: 4.4% East Orange: 7.0%
- Percentage of people 3 years and older in grad. or professional schools:
Lower Main Street: 5.6% East Orange: 0.4%
- Percentage of students K-12 enrolled in private schools:
Lower Main Street: 14.1% East Orange: 11.6%
Percentage of population below poverty level:
| Lower Main Street: | 20.7% |
| East Orange: | 22.1% |
Median year renter moved in (as recorded in 2022):
| Lower Main Street: | 2015 |
| East Orange: | 2016 |
Percentage of married-couple families with both working:
| Lower Main Street: | 153.6% |
| East Orange: | 72.4% |
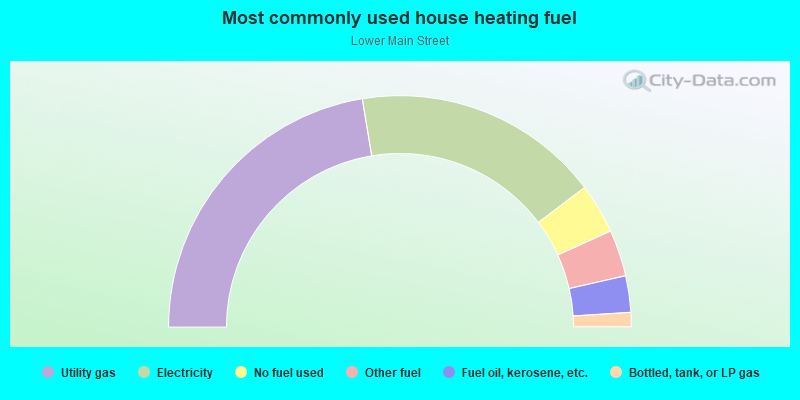
- 44.8%Utility gas
- 34.6%Electricity
- 7.0%No fuel used
- 6.5%Other fuel
- 5.1%Fuel oil, kerosene, etc.
- 2.0%Bottled, tank, or LP gas
Roads and streets:
Dr Martin Luther King Jr Blvd (Main St)
Length: 0.53 miles
Directions: N-S, SE-NW
Address range: 214 to 514
Directions: N-S, SE-NW
Address range: 214 to 514
Freeway Dr W
Length: 0.38 miles
Direction: SE-NW
Direction: SE-NW
N Arlington Ave
Length: 0.24 miles
Direction: SW-NE
Address range: 1 to 80
Direction: SW-NE
Address range: 1 to 80
Halsted St
Length: 0.10 miles
Direction: SW-NE
Address range: 1 to 42
Direction: SW-NE
Address range: 1 to 42
City Hall Plz
Length: 0.08 miles
Direction: SE-NW
Direction: SE-NW
S Clinton St
Length: 0.08 miles
Direction: SW-NE
Address range: 2 to 6
Direction: SW-NE
Address range: 2 to 6
S Burnett St
Length: 0.06 miles
Direction: SW-NE
Address range: 1 to 13
Direction: SW-NE
Address range: 1 to 13
S Walnut St
Length: 0.05 miles
Direction: SW-NE
Direction: SW-NE
Railroad features:
N J Transit RR
Length: 0.55 miles
Direction: SE-NW
Direction: SE-NW