Lowell Manor neighborhood in Yuma, Arizona (AZ), 85364 detailed profile
Settings
X


Business Search - 14 Million verified businesses
Area: 0.082 square miles
Population: 799
Population density:
| Lowell Manor: | 9,786 people per square mile |
| Yuma: | 924 people per square mile |

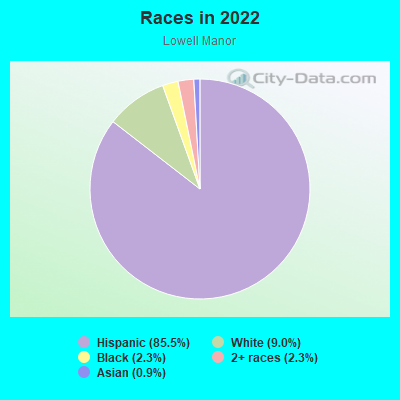
- 70485.5%Hispanic or Latino
- 749.0%White
- 192.3%Black
- 192.3%Two or more races
- 70.9%Asian
Median household income in 2022:
| Lowell Manor: | $42,676 |
| Yuma: | $58,043 |
Distribution of median household income
![Distribution of median household income]()
- 19Less than $10,000
- 11$10,000 to $19,999
- 76$20,000 to $29,999
- 12$30,000 to $39,999
- 34$40,000 to $49,999
- 72$50,000 to $59,999
- 31$60,000 to $74,999
- 23$75,000 to $99,999
- 19$100,000 to $124,999
- 6$125,000 to $149,999
- 6$150,000 to $199,999
- 5$200,000 or more

Distribution of owner-occupied house/condo value
![Distribution of owner-occupied house/condo value]()
- 14Less than $50,000
- 15$50,000 to $99,999
- 25$100,000 to $149,999
- 78$150,000 to $199,999
- 19$300,000 to $399,999
- 3$1,000,000 or more

Distribution of rent paid by renters
![Distribution of rent paid by renters]()
- 2Less than $100
- 17$100 to $199
- 12$200 to $299
- 16$300 to $399
- 17$400 to $499
- 63$500 to $599
- 32$600 to $699
- 29$700 to $799
- 17$800 to $899
- 16$900 to $999
- 1$1,000 to $1,249
- 8$1,500 to $1,999

Median rent in 2022:
| Lowell Manor: | $632 |
| Yuma: | $799 |
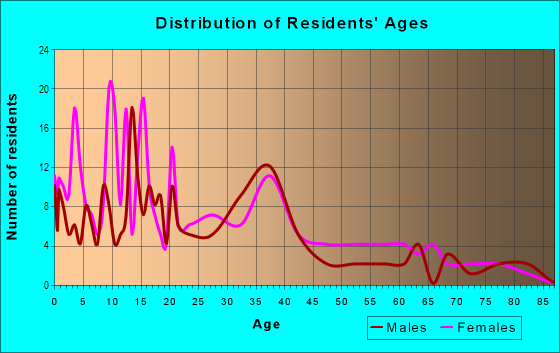
| Males: | 431 |
| Females: | 367 |
Males:
| This neighborhood: | 31.7 years |
| Whole city: | 30.9 years |
| This neighborhood: | 37.2 years |
| Whole city: | 34.5 years |
Average household size:
| Lowell Manor: | 2.3 people |
| Yuma: | 2.5 people |
Percentage of family households:
| Lowell Manor: | 57.4% |
| Yuma: | 50.2% |
| Here: | 33.7% |
| Yuma: | 48.2% |
Percentage of married-couple families with children (among all households):
| Lowell Manor: | 3.6% |
| Yuma: | 27.1% |
Percentage of single-mother households (among all households):
| Lowell Manor: | 22.6% |
| Yuma: | 9.1% |
Percentage of never married males 15 years old and over:
Percentage of never married females 15 years old and over:
| Lowell Manor: | 19.1% |
| Yuma: | 17.2% |
Percentage of never married females 15 years old and over:
| Lowell Manor: | 16.1% |
| city: | 14.0% |
Percentage of people that speak English not well or not at all:
| Lowell Manor: | 12.2% |
| Yuma: | 8.1% |
Percentage of people born in this state:
Percentage of people born in another U.S. state:
Percentage of native residents but born outside the U.S.:
Percentage of foreign born residents:
| Here: | 52.0% |
| Yuma: | 41.5% |
Percentage of people born in another U.S. state:
| Lowell Manor: | 27.5% |
| Yuma: | 36.5% |
Percentage of native residents but born outside the U.S.:
| Here: | 0.6% |
| city: | 2.6% |
Percentage of foreign born residents:
| Here: | 19.9% |
| Yuma: | 19.4% |
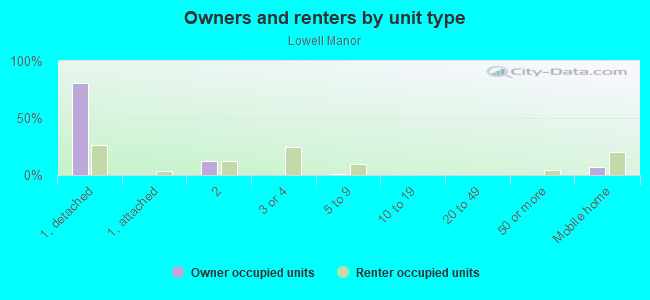
Owner-occupied
Renter-occupied

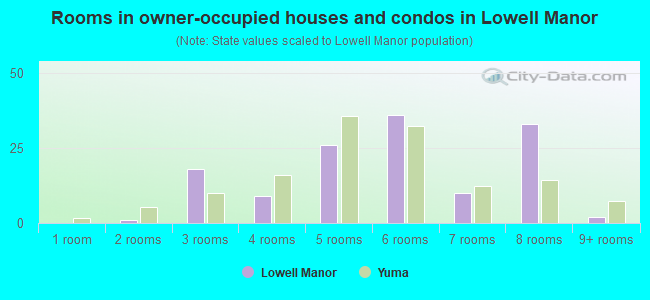
- Rooms in owner-occupied houses and condos in Lowell Manor
- 01 room
- 12 rooms
- 183 rooms
- 94 rooms
- 265 rooms
- 366 rooms
- 107 rooms
- 338 rooms
- 29+ rooms
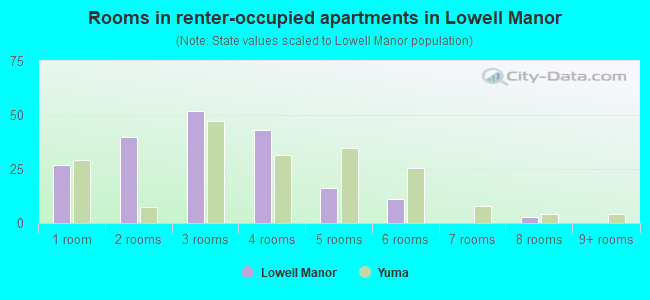
- Rooms in renter-occupied apartments in Lowell Manor
- 271 room
- 402 rooms
- 523 rooms
- 434 rooms
- 165 rooms
- 116 rooms
- 07 rooms
- 38 rooms
- 09+ rooms
Owner-occupied
Renter-occupied
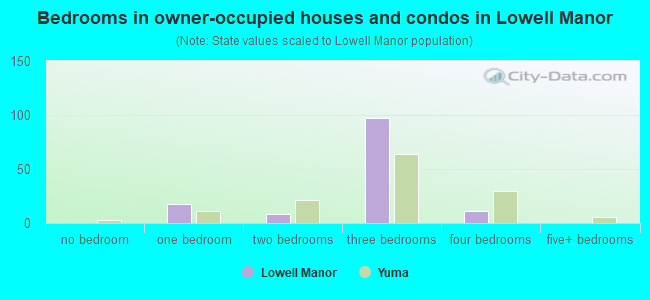
- Bedrooms in owner-occupied houses and condos in Lowell Manor
- 0no bedroom
- 181 bedroom
- 82 bedrooms
- 973 bedrooms
- 114 bedrooms
- 05+ bedrooms
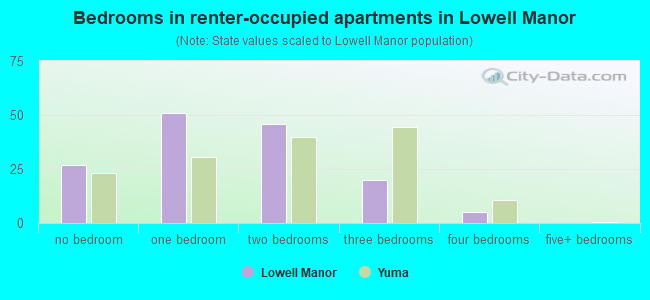
- Bedrooms in renter-occupied apartments in Lowell Manor
- 27no bedroom
- 511 bedroom
- 462 bedrooms
- 203 bedrooms
- 54 bedrooms
- 05+ bedrooms
Average number of cars or other vehicles available in houses/condos:
Average number of cars or other vehicles available in apartments:
| This neighborhood: | 1.9 |
| Yuma: | 2.1 |
Average number of cars or other vehicles available in apartments:
| Here: | 1.0 |
| city: | 1.3 |
Percentage of units with a mortgage:
| Lowell Manor: | 61.6% |
| Yuma: | 59.1% |
Housing prices:
- Average estimated value of detached houses in 2022 (57.4% of all units):
Lowell Manor: $127,710 Yuma: $212,447
- Average estimated value of mobile home in 2022 (11.1% of all units):
Lowell Manor: $286,527 Yuma: $91,509
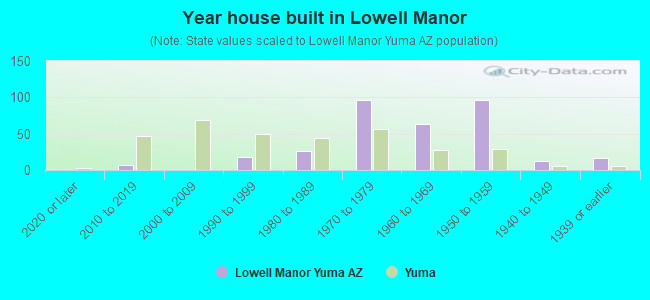
- Year house built in Lowell Manor
- 02020 or later
- 72010 to 2019
- 02000 to 2009
- 181990 to 1999
- 261980 to 1989
- 971970 to 1979
- 631960 to 1969
- 971950 to 1959
- 131940 to 1949
- 161939 or earlier
City-data.com crime index for city in 2020 (higher means more crime):
| City: | 243.7 |
| U.S. average: | 219.5 |
Travel time to work (commute)
![Travel time to work (commute)]()
- 8Less than 5 minutes
- 325 to 9 minutes
- 6610 to 14 minutes
- 3915 to 19 minutes
- 1220 to 24 minutes
- 525 to 29 minutes
- 530 to 34 minutes
- 140 to 44 minutes
- 3045 to 59 minutes
- 160 to 89 minutes

Means of transportation to work
![Means of transportation to work]()
- 81.5%266Drove a car alone
- 6.4%21Carpooled
- 4.0%13Motorcycle
- 1.5%5Bicycle
- 7.4%24Worked at home

Time leaving home to go to work
![Time leaving home to go to work]()
- 1412:00 a.m. to 4:59 a.m.
- 65:00 a.m. to 5:29 a.m.
- 245:30 a.m. to 5:59 a.m.
- 236:00 a.m. to 6:29 a.m.
- 246:30 a.m. to 6:59 a.m.
- 117:00 a.m. to 7:29 a.m.
- 137:30 a.m. to 7:59 a.m.
- 138:00 a.m. to 8:29 a.m.
- 68:30 a.m. to 8:59 a.m.
- 19:00 a.m. to 9:59 a.m.
- 1210:00 a.m. to 10:59 a.m.
- 111:00 a.m. to 11:59 a.m.
- 1012:00 p.m. to 3:59 p.m.
- 174:00 p.m. to 11:59 p.m.

Occupations of males:
- Percentage of males in management occupations (except farmers):
Here: 7.3% city: 7.9%
- Percentage of males in community and social services occupations:
Here: 2.8% city: 1.0%
- Percentage of males in arts, design, entertainment, sports, and media occupations:
Here: 1.0% city: 1.1%
- Percentage of males in service occupations:
Here: 7.4% city: 18.5%
- Percentage of males in sales and office occupations:
Here: 23.6% city: 16.9%
- Percentage of males in farming, fishing, and forestry occupations:
Here: 1.5% city: 3.8%
- Percentage of males in construction, extraction, and maintenance occupations:
Here: 6.0% city: 6.9%
- Percentage of males in production occupations:
Here: 19.1% city: 5.7%
- Percentage of males in transportation occupations:
Here: 7.3% city: 9.0%
- Percentage of males in material moving occupations:
Here: 23.4% city: 7.3%
Occupations of females:
- Percentage of females in management occupations (except farmers):
Here: 1.1% city: 8.0%
- Percentage of females in community and social services occupations:
Here: 3.0% city: 2.7%
- Percentage of females in education, training, and library occupations:
Here: 20.7% city: 8.8%
- Percentage of females in healthcare practitioners and technical occupations:
Here: 6.5% city: 9.2%
- Percentage of females in service occupations:
Here: 26.5% city: 24.0%
- Percentage of females in sales and office occupations:
Here: 32.8% city: 32.5%
- Percentage of females in production occupations:
Here: 2.1% city: 2.1%
- Percentage of females in transportation occupations:
Here: 13.4% city: 1.2%
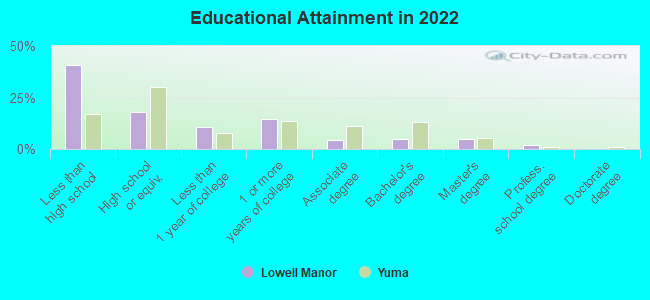
Education in this neighborhood (subdivision or community):
- Percentage of people 3 years and older in K-12 schools:
Lowell Manor: 27.9% Yuma: 18.6%
- Percentage of people 3 years and older in undergraduate colleges:
Lowell Manor: 1.2% Yuma: 4.4%
- Percentage of people 3 years and older in grad. or professional schools:
Lowell Manor: 1.1% Yuma: 0.6%
- Percentage of students K-12 enrolled in private schools:
Lowell Manor: 8.6% Yuma: 14.7%
Percentage of population below poverty level:
| Lowell Manor: | 26.7% |
| Yuma: | 9.8% |
Median year owner moved in (as recorded in 2022):
Median year renter moved in (as recorded in 2022):
| Lowell Manor: | 2003 |
| Yuma: | 2015 |
Median year renter moved in (as recorded in 2022):
| Lowell Manor: | 2019 |
| Yuma: | 2021 |
Percentage of married-couple families with both working:
| Lowell Manor: | 117.9% |
| Yuma: | 58.7% |
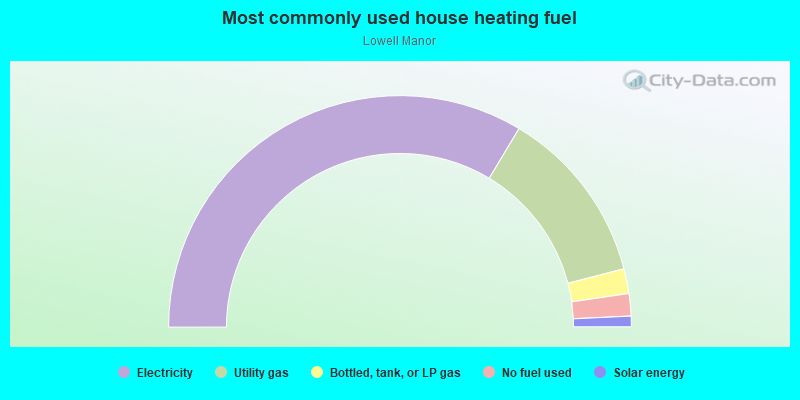
- 67.2%Electricity
- 24.7%Utility gas
- 3.5%Bottled, tank, or LP gas
- 3.1%No fuel used
- 1.5%Solar energy
Roads and streets:
W 20th St
Length: 0.15 miles
Direction: E-W
Address range: 100 to 221
Direction: E-W
Address range: 100 to 221
S 1st Ave
Length: 0.02 miles
Direction: N-S
Address range: 2329 to 2354
Direction: N-S
Address range: 2329 to 2354