Little Italy neighborhood in New York, New York (NY), 10012, 10013 detailed profile
Settings
X


Business Search - 14 Million verified businesses
Area: 0.052 square miles
Population: 4,668
Population density:
| Little Italy: | 90,271 people per square mile |
| New York: | 27,483 people per square mile |

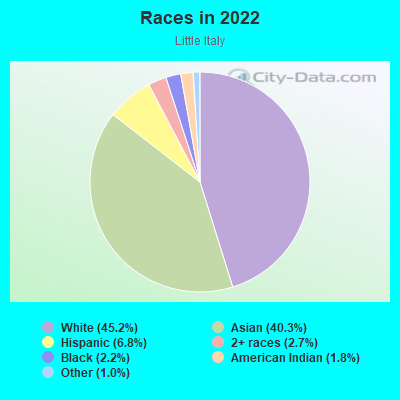
- 2,21545.2%White
- 1,97540.3%Asian
- 3316.8%Hispanic or Latino
- 1322.7%Two or more races
- 1072.2%Black
- 891.8%American Indian
- 511.0%Some other race
Distribution of median household income
![Distribution of median household income]()
- 66Less than $10,000
- 673$10,000 to $19,999
- 161$20,000 to $29,999
- 256$30,000 to $39,999
- 217$40,000 to $49,999
- 108$50,000 to $59,999
- 215$60,000 to $74,999
- 187$75,000 to $99,999
- 243$100,000 to $124,999
- 203$125,000 to $149,999
- 340$150,000 to $199,999
- 491$200,000 or more

Distribution of owner-occupied house/condo value
![Distribution of owner-occupied house/condo value]()
- 12$150,000 to $199,999
- 27$250,000 to $299,999
- 123$400,000 to $499,999
- 29$500,000 to $749,999
- 219$750,000 to $999,999
- 148$1,000,000 or more

Distribution of rent paid by renters
![Distribution of rent paid by renters]()
- 67Less than $100
- 167$100 to $199
- 177$200 to $299
- 237$300 to $399
- 132$400 to $499
- 67$500 to $599
- 80$600 to $699
- 316$700 to $799
- 112$800 to $899
- 243$900 to $999
- 249$1,000 to $1,249
- 163$1,250 to $1,499
- 325$1,500 to $1,999
- 710$2,000 or more

Median rent in 2022:
| Little Italy: | $1,630 |
| New York: | $1,573 |
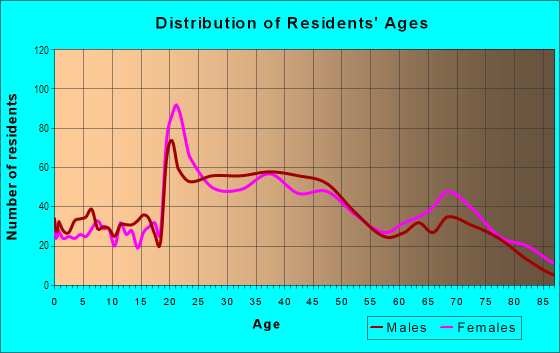
| Males: | 2,267 |
| Females: | 2,400 |
Males:
| This neighborhood: | 39.9 years |
| Whole city: | 37.0 years |
| This neighborhood: | 38.4 years |
| Whole city: | 39.8 years |
Average household size:
| Little Italy: | 2.1 people |
| New York: | 2.4 people |
Percentage of family households:
| Little Italy: | 25.1% |
| New York: | 38.3% |
| Here: | 29.1% |
| New York: | 34.8% |
Percentage of married-couple families with children (among all households):
| Little Italy: | 40.8% |
| New York: | 25.9% |
Percentage of single-mother households (among all households):
| Little Italy: | 18.4% |
| New York: | 11.8% |
Percentage of never married males 15 years old and over:
Percentage of never married females 15 years old and over:
| Little Italy: | 24.1% |
| New York: | 21.7% |
Percentage of never married females 15 years old and over:
| Little Italy: | 26.1% |
| city: | 22.4% |
Percentage of people that speak English not well or not at all:
| Little Italy: | 21.0% |
| New York: | 12.2% |
Percentage of people born in this state:
Percentage of people born in another U.S. state:
Percentage of native residents but born outside the U.S.:
Percentage of foreign born residents:
| Here: | 26.7% |
| New York: | 48.0% |
Percentage of people born in another U.S. state:
| Little Italy: | 29.1% |
| New York: | 11.7% |
Percentage of native residents but born outside the U.S.:
| Here: | 2.7% |
| city: | 3.6% |
Percentage of foreign born residents:
| Here: | 41.5% |
| New York: | 36.8% |
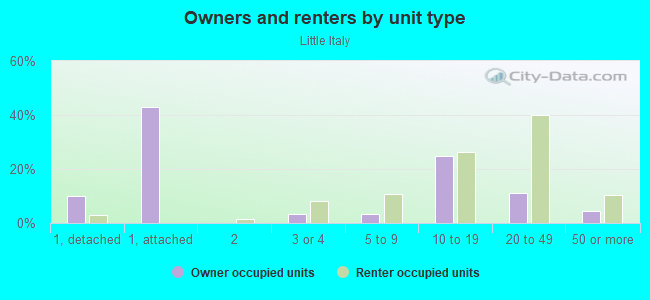
Owner-occupied
Renter-occupied

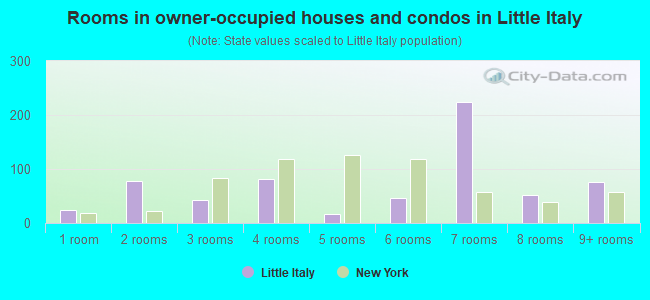
- Rooms in owner-occupied houses and condos in Little Italy
- 241 room
- 782 rooms
- 423 rooms
- 824 rooms
- 165 rooms
- 476 rooms
- 2247 rooms
- 518 rooms
- 769+ rooms
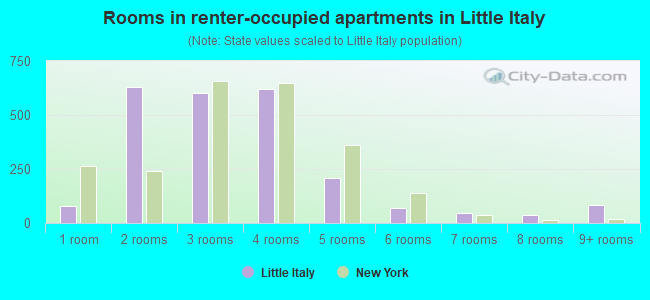
- Rooms in renter-occupied apartments in Little Italy
- 801 room
- 6312 rooms
- 6033 rooms
- 6194 rooms
- 2075 rooms
- 706 rooms
- 457 rooms
- 388 rooms
- 839+ rooms
Owner-occupied
Renter-occupied
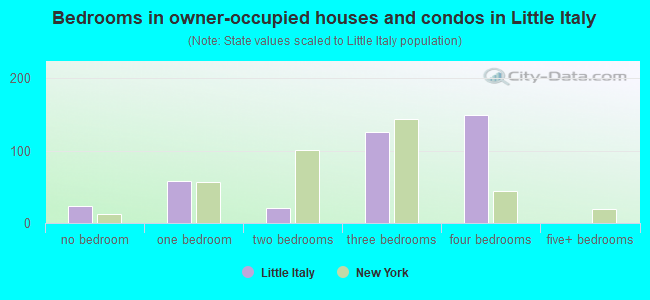
- Bedrooms in owner-occupied houses and condos in Little Italy
- 24no bedroom
- 581 bedroom
- 212 bedrooms
- 1253 bedrooms
- 1494 bedrooms
- 05+ bedrooms
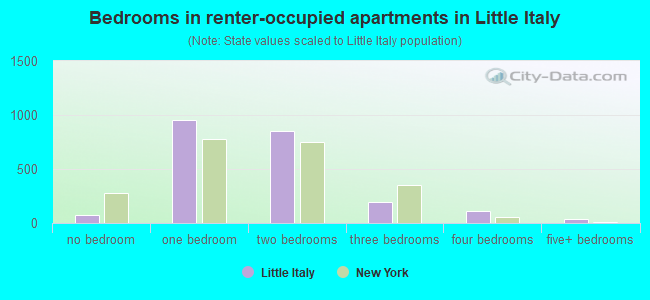
- Bedrooms in renter-occupied apartments in Little Italy
- 74no bedroom
- 9561 bedroom
- 8542 bedrooms
- 1963 bedrooms
- 1144 bedrooms
- 395+ bedrooms
Average number of cars or other vehicles available in houses/condos:
Average number of cars or other vehicles available in apartments:
| This neighborhood: | |
| New York: |
Average number of cars or other vehicles available in apartments:
| Here: | 0.2 |
| city: | 0.4 |
Percentage of units with a mortgage:
| Little Italy: | 55.1% |
| New York: | 56.2% |
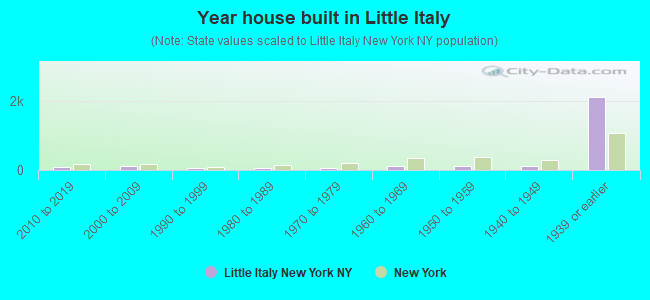
- Year house built in Little Italy
- 02020 or later
- 852010 to 2019
- 1082000 to 2009
- 701990 to 1999
- 711980 to 1989
- 651970 to 1979
- 1251960 to 1969
- 1101950 to 1959
- 1171940 to 1949
- 2,0981939 or earlier
City-data.com crime index for city in 2020 (higher means more crime):
| City: | 229.7 |
| U.S. average: | 219.5 |
Travel time to work (commute)
![Travel time to work (commute)]()
- 18Less than 5 minutes
- 1215 to 9 minutes
- 17810 to 14 minutes
- 29015 to 19 minutes
- 44820 to 24 minutes
- 17925 to 29 minutes
- 38230 to 34 minutes
- 9035 to 39 minutes
- 6440 to 44 minutes
- 7745 to 59 minutes
- 7360 to 89 minutes
- 1590 or more minutes

Means of transportation to work
![Means of transportation to work]()
- 4.4%113Drove a car alone
- 2.5%63Carpooled
- 2.8%72Bus
- 38.6%990Subway or elevated rail
- 1.0%26Ferryboat
- 5.0%129Taxi
- 6.9%177Bicycle
- 28.0%718Walked
- 24.9%638Worked at home

Time leaving home to go to work
![Time leaving home to go to work]()
- 6112:00 a.m. to 4:59 a.m.
- 505:30 a.m. to 5:59 a.m.
- 426:00 a.m. to 6:29 a.m.
- 1586:30 a.m. to 6:59 a.m.
- 887:00 a.m. to 7:29 a.m.
- 4307:30 a.m. to 7:59 a.m.
- 3828:00 a.m. to 8:29 a.m.
- 3038:30 a.m. to 8:59 a.m.
- 3849:00 a.m. to 9:59 a.m.
- 4010:00 a.m. to 10:59 a.m.
- 1511:00 a.m. to 11:59 a.m.
- 6612:00 p.m. to 3:59 p.m.
- 564:00 p.m. to 11:59 p.m.

Occupations of males:
- Percentage of males in management occupations (except farmers):
Here: 18.7% city: 11.2%
- Percentage of males in business and financial operations occupations:
Here: 3.5% city: 6.4%
- Percentage of males in computer and mathematical occupations:
Here: 12.0% city: 5.3%
- Percentage of males in architecture and engineering occupations:
Here: 3.4% city: 1.7%
- Percentage of males in life, physical, and social science occupations:
Here: 1.1% city: 1.0%
- Percentage of males in education, training, and library occupations:
Here: 2.9% city: 4.0%
- Percentage of males in arts, design, entertainment, sports, and media occupations:
Here: 16.1% city: 4.8%
- Percentage of males in service occupations:
Here: 9.8% city: 18.7%
- Percentage of males in sales and office occupations:
Here: 17.2% city: 15.0%
- Percentage of males in construction, extraction, and maintenance occupations:
Here: 1.7% city: 7.8%
- Percentage of males in transportation occupations:
Here: 2.5% city: 8.1%
- Percentage of males in material moving occupations:
Here: 9.1% city: 3.3%
Occupations of females:
- Percentage of females in management occupations (except farmers):
Here: 15.0% city: 10.4%
- Percentage of females in business and financial operations occupations:
Here: 11.5% city: 7.1%
- Percentage of females in computer and mathematical occupations:
Here: 4.9% city: 1.9%
- Percentage of females in legal occupations:
Here: 3.1% city: 2.2%
- Percentage of females in education, training, and library occupations:
Here: 4.6% city: 9.5%
- Percentage of females in arts, design, entertainment, sports, and media occupations:
Here: 11.9% city: 4.9%
- Percentage of females in healthcare practitioners and technical occupations:
Here: 5.5% city: 7.8%
- Percentage of females in service occupations:
Here: 12.8% city: 25.1%
- Percentage of females in sales and office occupations:
Here: 25.7% city: 22.5%
- Percentage of females in production occupations:
Here: 3.4% city: 1.5%
Percentage of people 16-64 in Armed Forces:
| Little Italy: | 0.0% |
| New York: | 0.1% |
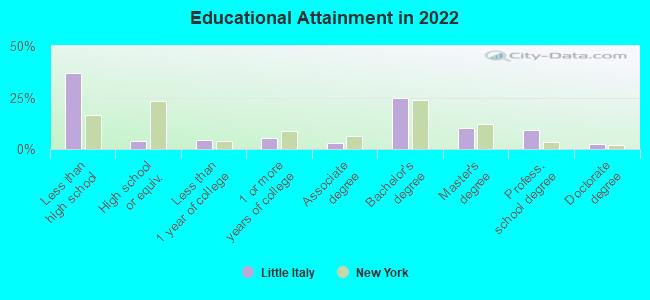
Education in this neighborhood (subdivision or community):
- Percentage of people 3 years and older in K-12 schools:
Little Italy: 27.6% New York: 15.2%
- Percentage of people 3 years and older in undergraduate colleges:
Little Italy: 13.0% New York: 5.1%
- Percentage of people 3 years and older in grad. or professional schools:
Little Italy: 3.1% New York: 2.1%
- Percentage of students K-12 enrolled in private schools:
Little Italy: 71.1% New York: 19.6%
Percentage of population below poverty level:
| Little Italy: | 11.3% |
| New York: | 18.3% |
Median year renter moved in (as recorded in 2022):
| Little Italy: | 2012 |
| New York: | 2016 |
Percentage of married-couple families with both working:
| Little Italy: | 113.3% |
| New York: | 65.6% |
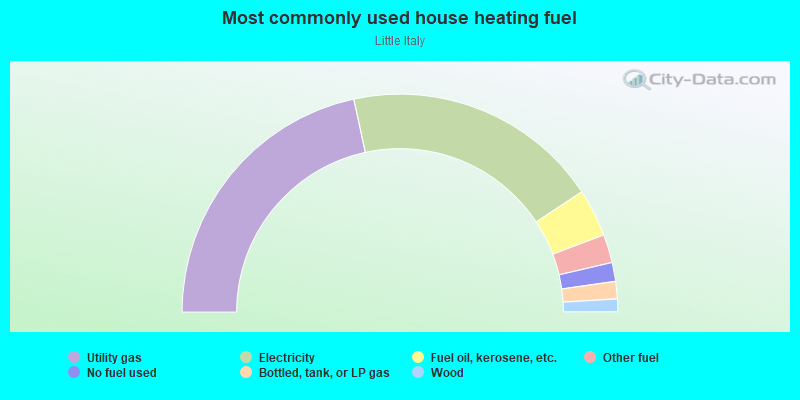
- 43.2%Utility gas
- 38.2%Electricity
- 7.1%Fuel oil, kerosene, etc.
- 4.2%Other fuel
- 2.8%No fuel used
- 2.6%Bottled, tank, or LP gas
- 1.9%Wood
Roads and streets:
Hester St
Length: 0.29 miles
Direction: E-W
Address range: 140 to 219
Direction: E-W
Address range: 140 to 219
Grand St
Length: 0.27 miles
Directions: E-W, SE-NW
Address range: 164 to 235
Directions: E-W, SE-NW
Address range: 164 to 235
Broome St
Length: 0.22 miles
Direction: E-W
Address range: 339 to 399
Direction: E-W
Address range: 339 to 399
Mulberry St
Length: 0.18 miles
Directions: N-S, SW-NE
Address range: 129 to 177
Directions: N-S, SW-NE
Address range: 129 to 177
Mott St
Length: 0.18 miles
Directions: N-S, SW-NE
Address range: 116 to 173
Directions: N-S, SW-NE
Address range: 116 to 173
Elizabeth St
Length: 0.17 miles
Directions: N-S, SW-NE
Address range: 66 to 136
Directions: N-S, SW-NE
Address range: 66 to 136
Bowery
Length: 0.17 miles
Directions: N-S, SW-NE
Address range: 90 to 151
Directions: N-S, SW-NE
Address range: 90 to 151
Centre St
Length: 0.10 miles
Direction: SW-NE
Address range: 188 to 228
Direction: SW-NE
Address range: 188 to 228
Baxter St
Length: 0.10 miles
Directions: E-W, N-S, SW-NE
Address range: 131 to 161
Directions: E-W, N-S, SW-NE
Address range: 131 to 161
Centre Market Pl
Length: 0.09 miles
Direction: SW-NE
Direction: SW-NE