Lincoln Park neighborhood in Clermont, Florida (FL), 34711 detailed profile
Settings
X


Business Search - 14 Million verified businesses
Area: 0.872 square miles
Population: 886
Population density:
| Lincoln Park: | 1,015 people per square mile |
| Clermont: | 4,126 people per square mile |

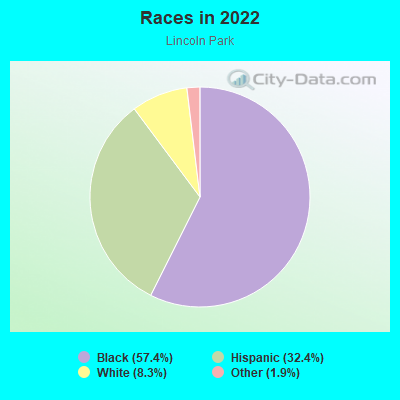
- 67675.7%White
- 15617.5%Hispanic or Latino
- 323.6%Two or more races
- 212.4%Black
- 70.8%Asian
- 10.1%Some other race
Median household income in 2022:
| Lincoln Park: | $139,140 |
| Clermont: | $75,951 |
Distribution of median household income
![Distribution of median household income]()
- 2Less than $10,000
- 15$10,000 to $19,999
- 4$20,000 to $29,999
- 9$30,000 to $39,999
- 17$40,000 to $49,999
- 20$50,000 to $59,999
- 38$60,000 to $74,999
- 31$75,000 to $99,999
- 37$100,000 to $124,999
- 45$125,000 to $149,999
- 32$150,000 to $199,999
- 62$200,000 or more

Distribution of owner-occupied house/condo value
![Distribution of owner-occupied house/condo value]()
- 7Less than $50,000
- 20$50,000 to $99,999
- 8$100,000 to $149,999
- 6$150,000 to $199,999
- 11$200,000 to $249,999
- 14$250,000 to $299,999
- 21$300,000 to $399,999
- 38$400,000 to $499,999
- 68$500,000 to $749,999
- 24$750,000 to $999,999
- 29$1,000,000 or more

Distribution of rent paid by renters
![Distribution of rent paid by renters]()
- 2$500 to $599
- 1$700 to $799
- 22$900 to $999
- 16$1,000 to $1,249
- 5$1,250 to $1,499
- 5$1,500 to $1,999
- 4$2,000 or more

Median rent in 2022:
| Lincoln Park: | $1,256 |
| Clermont: | $1,557 |
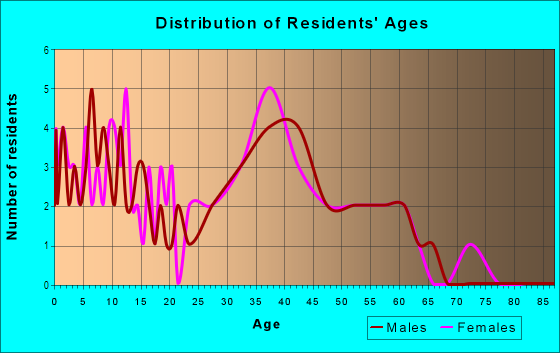
| Males: | 444 |
| Females: | 442 |
Males:
| This neighborhood: | 46.3 years |
| Whole city: | 41.2 years |
| This neighborhood: | 52.8 years |
| Whole city: | 42.4 years |
Average household size:
| Lincoln Park: | 3.5 people |
| Clermont: | 2.7 people |
Percentage of family households:
| Lincoln Park: | 65.8% |
| Clermont: | 41.9% |
| Here: | 65.6% |
| Clermont: | 55.9% |
Percentage of married-couple families with children (among all households):
| Lincoln Park: | 32.7% |
| Clermont: | 28.9% |
Percentage of single-mother households (among all households):
| Lincoln Park: | 0.5% |
| Clermont: | 6.1% |
Percentage of never married males 15 years old and over:
Percentage of never married females 15 years old and over:
| Lincoln Park: | 18.9% |
| Clermont: | 13.8% |
Percentage of never married females 15 years old and over:
| Lincoln Park: | 13.9% |
| city: | 15.3% |
Percentage of people that speak English not well or not at all:
| Lincoln Park: | 0.0% |
| Clermont: | 2.1% |
Percentage of people born in this state:
Percentage of people born in another U.S. state:
Percentage of native residents but born outside the U.S.:
Percentage of foreign born residents:
| Here: | 44.7% |
| Clermont: | 30.8% |
Percentage of people born in another U.S. state:
| Lincoln Park: | 42.7% |
| Clermont: | 47.3% |
Percentage of native residents but born outside the U.S.:
| Here: | 2.7% |
| city: | 4.1% |
Percentage of foreign born residents:
| Here: | 9.9% |
| Clermont: | 17.8% |
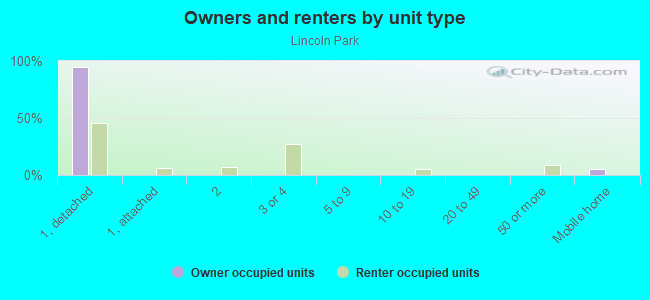
Owner-occupied
Renter-occupied

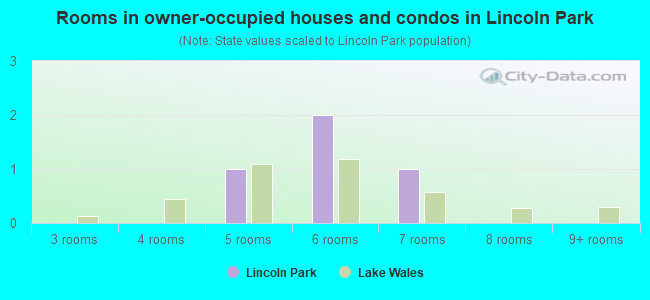
- Rooms in owner-occupied houses and condos in Lincoln Park
- 01 room
- 02 rooms
- 53 rooms
- 84 rooms
- 285 rooms
- 366 rooms
- 557 rooms
- 178 rooms
- 829+ rooms
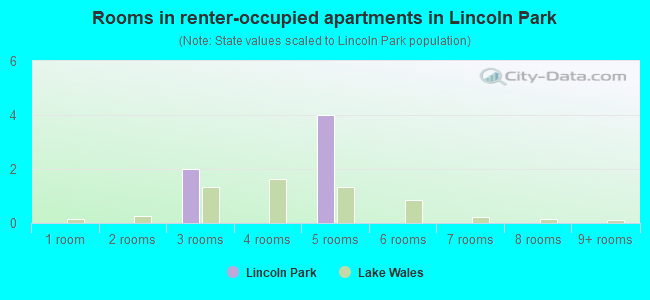
- Rooms in renter-occupied apartments in Lincoln Park
- 01 room
- 32 rooms
- 03 rooms
- 34 rooms
- 55 rooms
- 416 rooms
- 47 rooms
- 78 rooms
- 19+ rooms
Owner-occupied
Renter-occupied
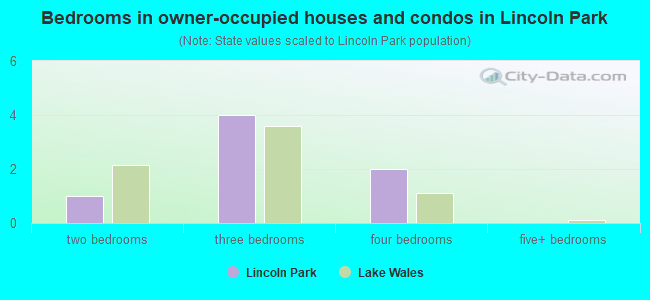
- Bedrooms in owner-occupied houses and condos in Lincoln Park
- 0no bedroom
- 21 bedroom
- 112 bedrooms
- 953 bedrooms
- 1084 bedrooms
- 165+ bedrooms
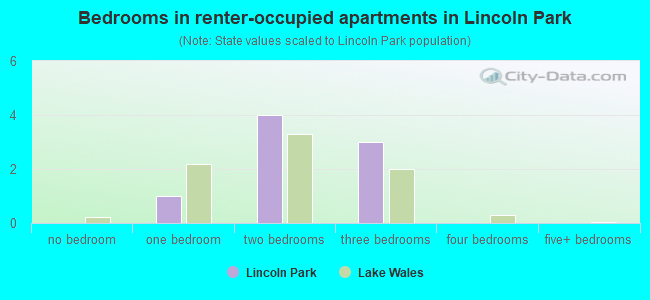
- Bedrooms in renter-occupied apartments in Lincoln Park
- 0no bedroom
- 31 bedroom
- 52 bedrooms
- 513 bedrooms
- 54 bedrooms
- 05+ bedrooms
Average number of cars or other vehicles available in houses/condos:
Average number of cars or other vehicles available in apartments:
| This neighborhood: | 2.7 |
| Clermont: | 1.9 |
Average number of cars or other vehicles available in apartments:
| Here: | 1.7 |
| city: | 1.5 |
Percentage of units with a mortgage:
| Lincoln Park: | 65.0% |
| Clermont: | 61.4% |
Housing prices:
- Average estimated value of detached houses in 2022 (74.6% of all units):
Lincoln Park: $696,629 Florida: $500,941
- Average estimated value of mobile home in 2022 (20.4% of all units):
Lincoln Park: $123,031 Florida: $113,202
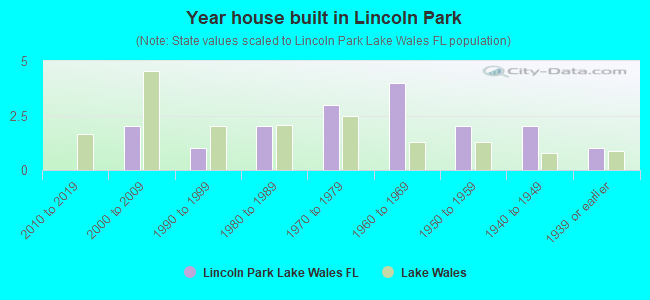
- Year house built in Lincoln Park
- 42020 or later
- 242010 to 2019
- 882000 to 2009
- 951990 to 1999
- 741980 to 1989
- 221970 to 1979
- 51960 to 1969
- 21950 to 1959
- 01940 to 1949
- 51939 or earlier
City-data.com crime index for city in 2020 (higher means more crime):
| City: | 137.7 |
| U.S. average: | 219.5 |
Travel time to work (commute)
![Travel time to work (commute)]()
- 7Less than 5 minutes
- 85 to 9 minutes
- 4610 to 14 minutes
- 1515 to 19 minutes
- 2320 to 24 minutes
- 1025 to 29 minutes
- 2130 to 34 minutes
- 2135 to 39 minutes
- 1940 to 44 minutes
- 6345 to 59 minutes
- 2060 to 89 minutes
- 190 or more minutes

Means of transportation to work
![Means of transportation to work]()
- 69.7%302Drove a car alone
- 2.8%12Carpooled
- 0.5%2Bus
- 2.5%11Walked
- 1.4%6Other means
- 22.6%98Worked at home

Time leaving home to go to work
![Time leaving home to go to work]()
- 3012:00 a.m. to 4:59 a.m.
- 65:00 a.m. to 5:29 a.m.
- 105:30 a.m. to 5:59 a.m.
- 66:00 a.m. to 6:29 a.m.
- 126:30 a.m. to 6:59 a.m.
- 267:00 a.m. to 7:29 a.m.
- 327:30 a.m. to 7:59 a.m.
- 358:00 a.m. to 8:29 a.m.
- 108:30 a.m. to 8:59 a.m.
- 169:00 a.m. to 9:59 a.m.
- 1410:00 a.m. to 10:59 a.m.
- 2112:00 p.m. to 3:59 p.m.
- 84:00 p.m. to 11:59 p.m.

Occupations of males:
- Percentage of males in management occupations (except farmers):
Here: 10.5% city: 13.6%
- Percentage of males in business and financial operations occupations:
Here: 8.8% city: 3.7%
- Percentage of males in computer and mathematical occupations:
Here: 3.0% city: 3.1%
- Percentage of males in architecture and engineering occupations:
Here: 3.9% city: 2.1%
- Percentage of males in community and social services occupations:
Here: 1.3% city: 1.7%
- Percentage of males in education, training, and library occupations:
Here: 2.1% city: 3.2%
- Percentage of males in arts, design, entertainment, sports, and media occupations:
Here: 3.4% city: 4.3%
- Percentage of males in healthcare practitioners and technical occupations:
Here: 4.1% city: 7.6%
- Percentage of males in service occupations:
Here: 20.5% city: 10.4%
- Percentage of males in sales and office occupations:
Here: 14.2% city: 22.0%
- Percentage of males in construction, extraction, and maintenance occupations:
Here: 11.1% city: 8.6%
- Percentage of males in production occupations:
Here: 6.4% city: 1.6%
- Percentage of males in transportation occupations:
Here: 7.8% city: 9.5%
Occupations of females:
- Percentage of females in management occupations (except farmers):
Here: 7.3% city: 11.6%
- Percentage of females in business and financial operations occupations:
Here: 6.0% city: 5.6%
- Percentage of females in computer and mathematical occupations:
Here: 1.7% city: 1.7%
- Percentage of females in community and social services occupations:
Here: 1.2% city: 1.1%
- Percentage of females in legal occupations:
Here: 1.9% city: 0.3%
- Percentage of females in education, training, and library occupations:
Here: 6.1% city: 10.8%
- Percentage of females in arts, design, entertainment, sports, and media occupations:
Here: 14.3% city: 3.0%
- Percentage of females in healthcare practitioners and technical occupations:
Here: 6.1% city: 14.1%
- Percentage of females in service occupations:
Here: 17.0% city: 17.7%
- Percentage of females in sales and office occupations:
Here: 33.8% city: 26.0%
- Percentage of females in construction, extraction, and maintenance occupations:
Here: 1.5% city: 0.0%
- Percentage of females in production occupations:
Here: 1.9% city: 0.7%
- Percentage of females in material moving occupations:
Here: 1.3% city: 4.1%
Percentage of people 16-64 in Armed Forces:
| Lincoln Park: | 0.5% |
| Clermont: | 0.0% |
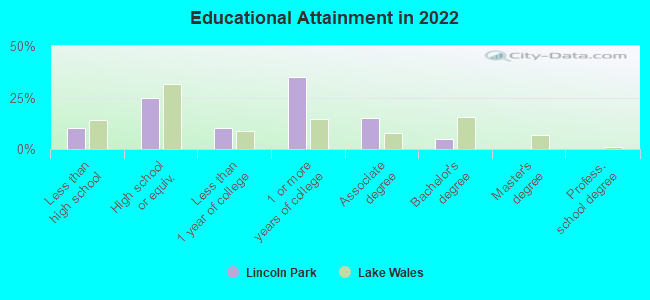
Education in this neighborhood (subdivision or community):
- Percentage of people 3 years and older in K-12 schools:
Lincoln Park: 16.0% Clermont: 18.4%
- Percentage of people 3 years and older in undergraduate colleges:
Lincoln Park: 13.0% Clermont: 3.7%
- Percentage of people 3 years and older in grad. or professional schools:
Lincoln Park: 0.3% Clermont: 1.8%
- Percentage of students K-12 enrolled in private schools:
Lincoln Park: 19.9% Clermont: 10.3%
Percentage of population below poverty level:
| Lincoln Park: | 6.7% |
| Clermont: | 6.6% |
Median year owner moved in (as recorded in 2022):
Median year renter moved in (as recorded in 2022):
| Lincoln Park: | 2397 |
| Clermont: | 2012 |
Median year renter moved in (as recorded in 2022):
| Lincoln Park: | 2404 |
| Clermont: | 2019 |
Percentage of married-couple families with both working:
| Lincoln Park: | 67.4% |
| Clermont: | 70.7% |
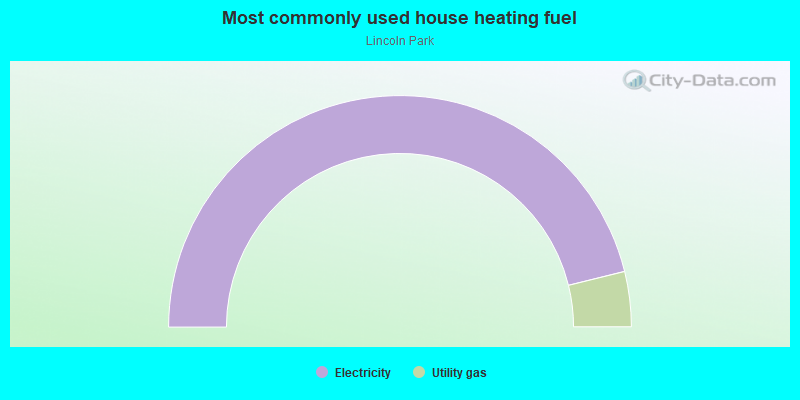
- 79.1%Electricity
- 5.5%Wood
- 5.0%No fuel used
- 4.5%Utility gas
- 2.8%Bottled, tank, or LP gas
- 1.8%Coal or coke
- 1.3%Solar energy
Highways in this neighborhood:
State Hwy 50
Length: 1.78 miles
Direction: E-W
Direction: E-W
Roads and streets:
Hartle Rd
Length: 0.78 miles
Direction: N-S
Address range: 13194 to 13693
Direction: N-S
Address range: 13194 to 13693
Myers Ct
Length: 0.58 miles
Directions: E-W, SW-NE
Address range: 16300 to 16499
Directions: E-W, SW-NE
Address range: 16300 to 16499
Castlehill Rd
Length: 0.29 miles
Directions: E-W, N-S, SE-NW
Address range: 16300 to 16799
Directions: E-W, N-S, SE-NW
Address range: 16300 to 16799
Granville Ave
Length: 0.24 miles
Direction: N-S
Address range: 13400 to 13779
Direction: N-S
Address range: 13400 to 13779
Co Rd 455
Length: 0.09 miles
Directions: N-S, SW-NE
Directions: N-S, SW-NE
Tiny Morse Blvd
Length: 0.01 miles
Direction: N-S
Direction: N-S