La Mesa Linda neighborhood in Yuma, Arizona (AZ), 85364 detailed profile
Settings
X

Business Search - 14 Million verified businesses
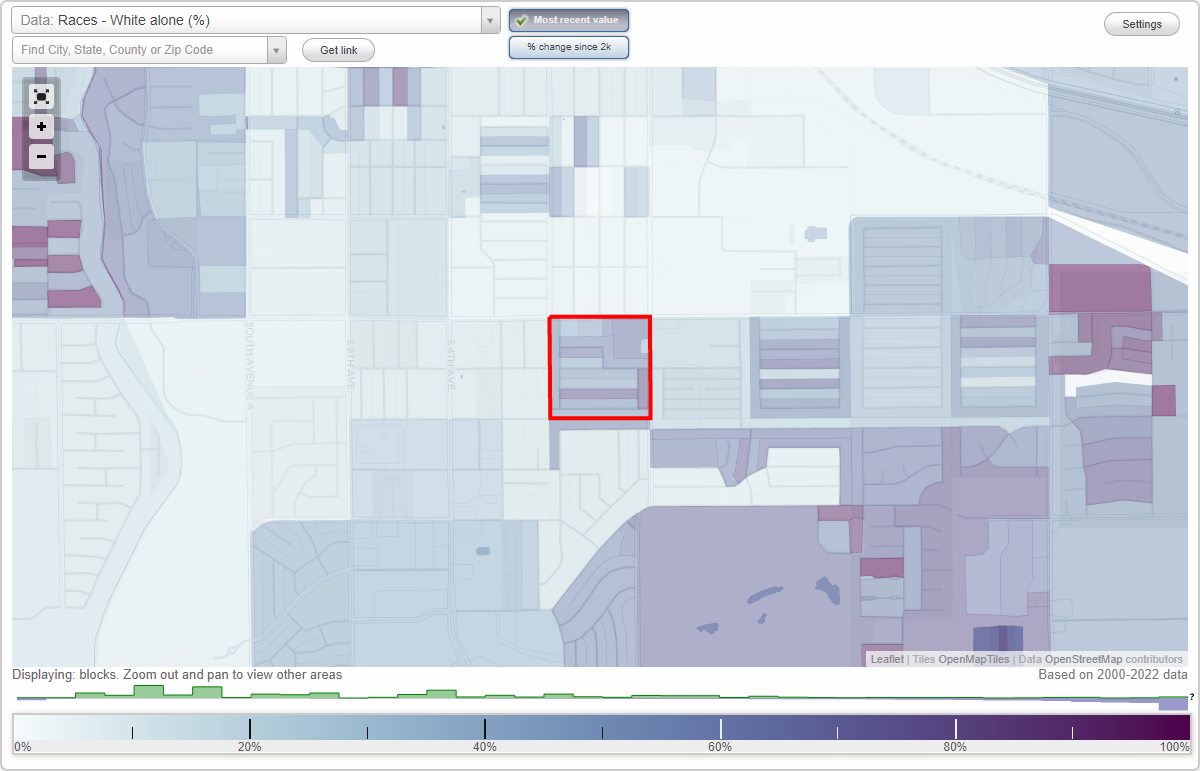
Area: 0.063 square miles
Population: 728
Population density:
| La Mesa Linda: | 11,474 people per square mile |
| Yuma: | 924 people per square mile |

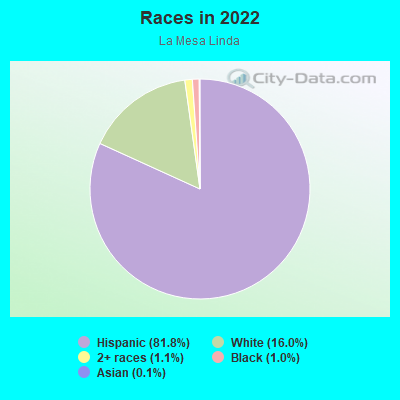
- 59581.8%Hispanic or Latino
- 11616.0%White
- 81.1%Two or more races
- 71.0%Black
- 10.1%Asian
Median household income in 2022:
| La Mesa Linda: | $39,094 |
| Yuma: | $58,043 |
Distribution of median household income
![Distribution of median household income]()
- 12Less than $10,000
- 14$10,000 to $19,999
- 19$20,000 to $29,999
- 79$30,000 to $39,999
- 15$40,000 to $49,999
- 23$50,000 to $59,999
- 52$60,000 to $74,999
- 38$75,000 to $99,999
- 6$100,000 to $124,999
- 27$125,000 to $149,999
- 5$150,000 to $199,999
- 4$200,000 or more

Distribution of owner-occupied house/condo value
![Distribution of owner-occupied house/condo value]()
- 6Less than $50,000
- 4$50,000 to $99,999
- 36$100,000 to $149,999
- 40$150,000 to $199,999
- 21$200,000 to $249,999
- 14$250,000 to $299,999
- 3$300,000 to $399,999
- 1$750,000 to $999,999
- 1$1,000,000 or more

Distribution of rent paid by renters
![Distribution of rent paid by renters]()
- 1Less than $100
- 3$100 to $199
- 8$200 to $299
- 9$300 to $399
- 2$400 to $499
- 15$500 to $599
- 56$600 to $699
- 64$700 to $799
- 13$800 to $899
- 12$900 to $999
- 7$1,000 to $1,249
- 2$1,500 to $1,999

Median rent in 2022:
| La Mesa Linda: | $716 |
| Yuma: | $799 |
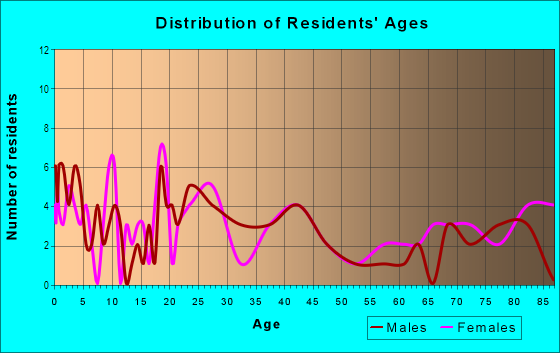
| Males: | 384 |
| Females: | 343 |
Males:
| This neighborhood: | 27.7 years |
| Whole city: | 30.9 years |
| This neighborhood: | 33.8 years |
| Whole city: | 34.5 years |
Average household size:
| La Mesa Linda: | 2.6 people |
| Yuma: | 2.5 people |
Percentage of family households:
| La Mesa Linda: | 71.1% |
| Yuma: | 50.2% |
| Here: | 40.9% |
| Yuma: | 48.2% |
Percentage of married-couple families with children (among all households):
| La Mesa Linda: | 21.7% |
| Yuma: | 27.1% |
Percentage of single-mother households (among all households):
| La Mesa Linda: | 6.7% |
| Yuma: | 9.1% |
Percentage of never married males 15 years old and over:
Percentage of never married females 15 years old and over:
| La Mesa Linda: | 6.4% |
| Yuma: | 17.2% |
Percentage of never married females 15 years old and over:
| La Mesa Linda: | 26.9% |
| city: | 14.0% |
Percentage of people that speak English not well or not at all:
| La Mesa Linda: | 3.4% |
| Yuma: | 8.1% |
Percentage of people born in this state:
Percentage of people born in another U.S. state:
Percentage of native residents but born outside the U.S.:
Percentage of foreign born residents:
| Here: | 50.3% |
| Yuma: | 41.5% |
Percentage of people born in another U.S. state:
| La Mesa Linda: | 26.0% |
| Yuma: | 36.5% |
Percentage of native residents but born outside the U.S.:
| Here: | 0.3% |
| city: | 2.6% |
Percentage of foreign born residents:
| Here: | 23.4% |
| Yuma: | 19.4% |
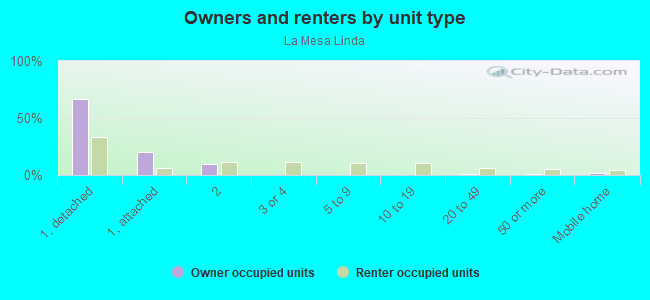
Owner-occupied
Renter-occupied

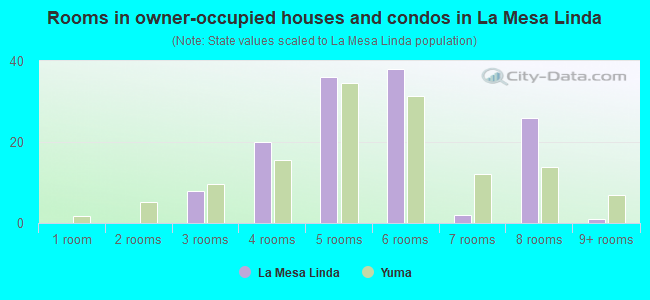
- Rooms in owner-occupied houses and condos in La Mesa Linda
- 01 room
- 02 rooms
- 83 rooms
- 204 rooms
- 365 rooms
- 386 rooms
- 27 rooms
- 268 rooms
- 19+ rooms
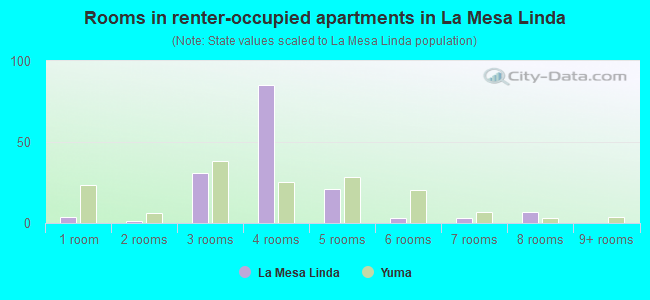
- Rooms in renter-occupied apartments in La Mesa Linda
- 41 room
- 12 rooms
- 313 rooms
- 854 rooms
- 215 rooms
- 36 rooms
- 37 rooms
- 78 rooms
- 09+ rooms
Owner-occupied
Renter-occupied
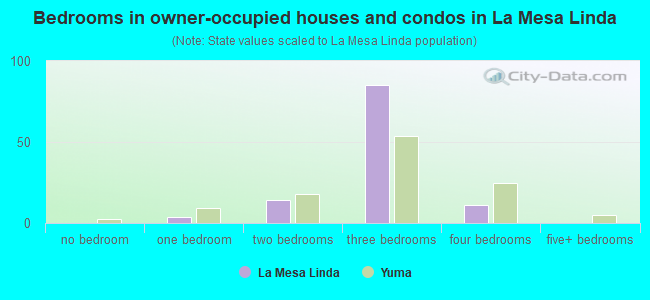
- Bedrooms in owner-occupied houses and condos in La Mesa Linda
- 0no bedroom
- 41 bedroom
- 142 bedrooms
- 853 bedrooms
- 114 bedrooms
- 05+ bedrooms
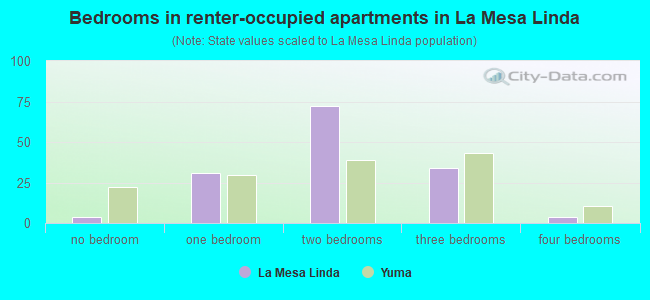
- Bedrooms in renter-occupied apartments in La Mesa Linda
- 4no bedroom
- 311 bedroom
- 722 bedrooms
- 343 bedrooms
- 44 bedrooms
- 05+ bedrooms
Average number of cars or other vehicles available in houses/condos:
Average number of cars or other vehicles available in apartments:
| This neighborhood: | 1.7 |
| Yuma: | 2.1 |
Average number of cars or other vehicles available in apartments:
| Here: | 1.9 |
| city: | 1.3 |
Percentage of units with a mortgage:
| La Mesa Linda: | 74.0% |
| Yuma: | 59.1% |
Average estimated value of detached houses in 2022 (63.3% of all units):
| La Mesa Linda: | $167,786 |
| Yuma: | $212,447 |
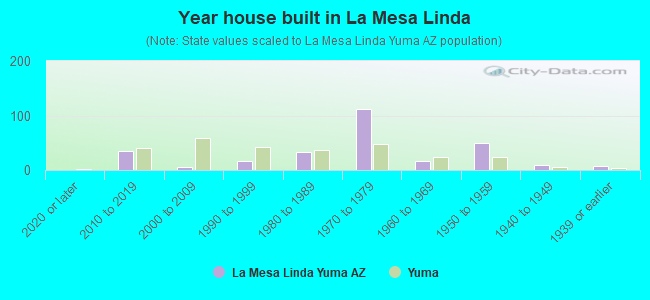
- Year house built in La Mesa Linda
- 02020 or later
- 352010 to 2019
- 62000 to 2009
- 171990 to 1999
- 331980 to 1989
- 1121970 to 1979
- 161960 to 1969
- 501950 to 1959
- 101940 to 1949
- 81939 or earlier
City-data.com crime index for city in 2020 (higher means more crime):
| City: | 243.7 |
| U.S. average: | 219.5 |
Travel time to work (commute)
![Travel time to work (commute)]()
- 8Less than 5 minutes
- 465 to 9 minutes
- 3210 to 14 minutes
- 4815 to 19 minutes
- 2920 to 24 minutes
- 2025 to 29 minutes
- 230 to 34 minutes
- 1345 to 59 minutes
- 660 to 89 minutes

Means of transportation to work
![Means of transportation to work]()
- 65.9%170Drove a car alone
- 32.6%84Carpooled
- 3.9%10Motorcycle
- 0.8%2Worked at home

Time leaving home to go to work
![Time leaving home to go to work]()
- 712:00 a.m. to 4:59 a.m.
- 425:00 a.m. to 5:29 a.m.
- 105:30 a.m. to 5:59 a.m.
- 36:00 a.m. to 6:29 a.m.
- 276:30 a.m. to 6:59 a.m.
- 127:00 a.m. to 7:29 a.m.
- 127:30 a.m. to 7:59 a.m.
- 208:00 a.m. to 8:29 a.m.
- 78:30 a.m. to 8:59 a.m.
- 29:00 a.m. to 9:59 a.m.
- 610:00 a.m. to 10:59 a.m.
- 2512:00 p.m. to 3:59 p.m.
- 194:00 p.m. to 11:59 p.m.

Occupations of males:
- Percentage of males in management occupations (except farmers):
Here: 5.9% city: 7.9%
- Percentage of males in business and financial operations occupations:
Here: 9.0% city: 2.8%
- Percentage of males in service occupations:
Here: 21.5% city: 18.5%
- Percentage of males in sales and office occupations:
Here: 28.5% city: 16.9%
- Percentage of males in farming, fishing, and forestry occupations:
Here: 7.2% city: 3.8%
- Percentage of males in construction, extraction, and maintenance occupations:
Here: 13.9% city: 6.9%
- Percentage of males in production occupations:
Here: 15.5% city: 5.7%
- Percentage of males in material moving occupations:
Here: 1.9% city: 7.3%
Occupations of females:
- Percentage of females in management occupations (except farmers):
Here: 38.2% city: 8.0%
- Percentage of females in arts, design, entertainment, sports, and media occupations:
Here: 1.3% city: 1.8%
- Percentage of females in service occupations:
Here: 48.9% city: 24.0%
- Percentage of females in sales and office occupations:
Here: 5.5% city: 32.5%
- Percentage of females in material moving occupations:
Here: 5.9% city: 2.2%
Percentage of people 16-64 in Armed Forces:
| La Mesa Linda: | 3.2% |
| Yuma: | 7.0% |
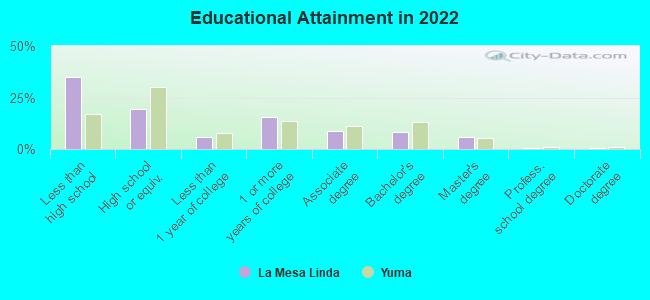
Education in this neighborhood (subdivision or community):
- Percentage of people 3 years and older in K-12 schools:
La Mesa Linda: 25.8% Yuma: 18.6%
- Percentage of people 3 years and older in undergraduate colleges:
La Mesa Linda: 5.0% Yuma: 4.4%
- Percentage of people 3 years and older in grad. or professional schools:
La Mesa Linda: 2.5% Yuma: 0.6%
- Percentage of students K-12 enrolled in private schools:
La Mesa Linda: 14.5% Yuma: 14.7%
Percentage of population below poverty level:
| La Mesa Linda: | 19.5% |
| Yuma: | 9.8% |
Median year owner moved in (as recorded in 2022):
Median year renter moved in (as recorded in 2022):
| La Mesa Linda: | 2000 |
| Yuma: | 2015 |
Median year renter moved in (as recorded in 2022):
| La Mesa Linda: | 2018 |
| Yuma: | 2021 |
Percentage of married-couple families with both working:
| La Mesa Linda: | 59.0% |
| Yuma: | 58.7% |
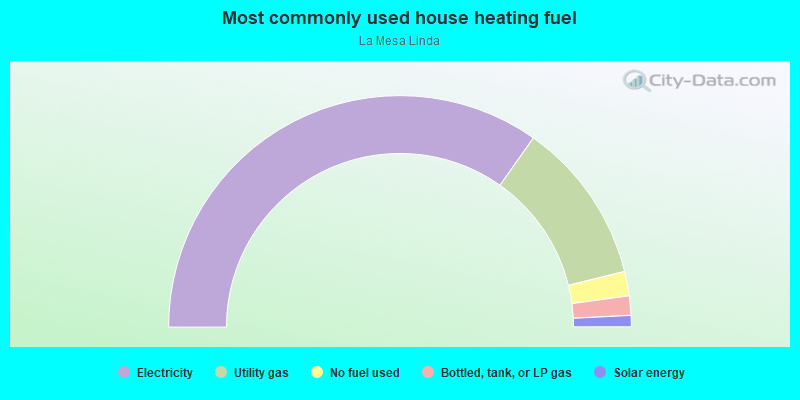
- 69.5%Electricity
- 22.7%Utility gas
- 3.4%No fuel used
- 2.7%Bottled, tank, or LP gas
- 1.6%Solar energy
Roads and streets:
E 26th St
Length: 0.27 miles
Direction: E-W
Address range: 100 to 299
Direction: E-W
Address range: 100 to 299
E 25th St
Length: 0.27 miles
Direction: E-W
Address range: 100 to 299
Direction: E-W
Address range: 100 to 299
E 24th St
Length: 0.27 miles
Direction: E-W
Address range: 109 to 499
Direction: E-W
Address range: 109 to 499
E 25th Pl
Length: 0.23 miles
Direction: E-W
Address range: 100 to 299
Direction: E-W
Address range: 100 to 299
S Arizona Ave
Length: 0.23 miles
Direction: N-S
Address range: 2500 to 2599
Direction: N-S
Address range: 2500 to 2599
S Madison Ave
Length: 0.23 miles
Direction: N-S
Address range: 2400 to 2599
Direction: N-S
Address range: 2400 to 2599
E 24th Pl
Length: 0.12 miles
Direction: E-W
Address range: 100 to 299
Direction: E-W
Address range: 100 to 299
S Walnut Ave
Length: 0.10 miles
Direction: N-S
Address range: 2500 to 2599
Direction: N-S
Address range: 2500 to 2599
S Maple Ave
Length: 0.05 miles
Directions: E-W, N-S, SE-NW
Address range: 2400 to 2499
Directions: E-W, N-S, SE-NW
Address range: 2400 to 2499