Italian Market neighborhood in Philadelphia, Pennsylvania (PA), 19147 detailed profile
Settings
X


Business Search - 14 Million verified businesses
Area: 0.097 square miles
Population: 4,871
Population density:
| Italian Market: | 50,195 people per square mile |
| Philadelphia: | 11,602 people per square mile |

- 3,17060.0%White
- 92817.6%Asian
- 4358.2%Hispanic or Latino
- 4007.6%Black
- 3025.7%Two or more races
- 521.0%Some other race

Distribution of median household income
![Distribution of median household income]()
- 64Less than $10,000
- 380$10,000 to $19,999
- 305$20,000 to $29,999
- 345$30,000 to $39,999
- 240$40,000 to $49,999
- 110$50,000 to $59,999
- 119$60,000 to $74,999
- 327$75,000 to $99,999
- 184$100,000 to $124,999
- 262$125,000 to $149,999
- 196$150,000 to $199,999
- 513$200,000 or more

Distribution of owner-occupied house/condo value
![Distribution of owner-occupied house/condo value]()
- 87Less than $50,000
- 7$50,000 to $99,999
- 32$100,000 to $149,999
- 70$150,000 to $199,999
- 89$200,000 to $249,999
- 118$250,000 to $299,999
- 210$300,000 to $399,999
- 179$400,000 to $499,999
- 544$500,000 to $749,999
- 212$750,000 to $999,999
- 178$1,000,000 or more

Distribution of rent paid by renters
![Distribution of rent paid by renters]()
- 159$200 to $299
- 53$300 to $399
- 11$400 to $499
- 53$500 to $599
- 184$700 to $799
- 256$800 to $899
- 139$900 to $999
- 184$1,000 to $1,249
- 229$1,250 to $1,499
- 304$1,500 to $1,999
- 712$2,000 or more

Median rent in 2022:
| Italian Market: | $1,576 |
| Philadelphia: | $1,073 |
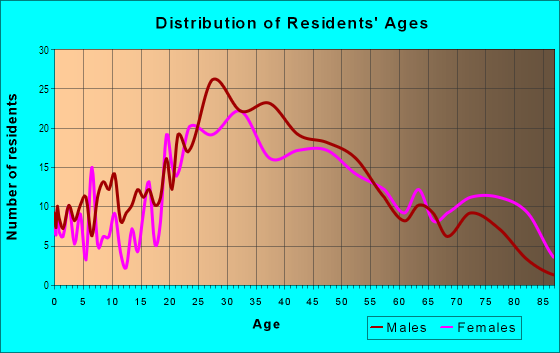
| Males: | 2,511 |
| Females: | 2,360 |
Males:
| This neighborhood: | 34.1 years |
| Whole city: | 34.1 years |
| This neighborhood: | 39.7 years |
| Whole city: | 36.3 years |
Average household size:
| Italian Market: | 2.0 people |
| Philadelphia: | 2.2 people |
Percentage of family households:
| Italian Market: | 29.5% |
| Philadelphia: | 36.5% |
| Here: | 32.2% |
| Philadelphia: | 28.0% |
Percentage of married-couple families with children (among all households):
| Italian Market: | 43.2% |
| Philadelphia: | 23.5% |
Percentage of single-mother households (among all households):
| Italian Market: | 7.2% |
| Philadelphia: | 17.6% |
Percentage of never married males 15 years old and over:
Percentage of never married females 15 years old and over:
| Italian Market: | 20.8% |
| Philadelphia: | 23.9% |
Percentage of never married females 15 years old and over:
| Italian Market: | 23.1% |
| city: | 26.0% |
Percentage of people that speak English not well or not at all:
| Italian Market: | 3.1% |
| Philadelphia: | 7.0% |
Percentage of people born in this state:
Percentage of people born in another U.S. state:
Percentage of native residents but born outside the U.S.:
Percentage of foreign born residents:
| Here: | 48.1% |
| Philadelphia: | 61.6% |
Percentage of people born in another U.S. state:
| Italian Market: | 38.6% |
| Philadelphia: | 18.9% |
Percentage of native residents but born outside the U.S.:
| Here: | 1.2% |
| city: | 3.7% |
Percentage of foreign born residents:
| Here: | 12.2% |
| Philadelphia: | 15.7% |

Owner-occupied
Renter-occupied


- Rooms in owner-occupied houses and condos in Italian Market
- 1241 room
- 722 rooms
- 903 rooms
- 1554 rooms
- 2255 rooms
- 3576 rooms
- 3587 rooms
- 1558 rooms
- 1279+ rooms

- Rooms in renter-occupied apartments in Italian Market
- 1081 room
- 1462 rooms
- 3653 rooms
- 2044 rooms
- 2045 rooms
- 1056 rooms
- 2257 rooms
- 1138 rooms
- 869+ rooms
Owner-occupied
Renter-occupied

- Bedrooms in owner-occupied houses and condos in Italian Market
- 124no bedroom
- 1131 bedroom
- 2162 bedrooms
- 4513 bedrooms
- 4234 bedrooms
- 975+ bedrooms

- Bedrooms in renter-occupied apartments in Italian Market
- 137no bedroom
- 4781 bedroom
- 3162 bedrooms
- 1423 bedrooms
- 2244 bedrooms
- 885+ bedrooms
Average number of cars or other vehicles available in houses/condos:
Average number of cars or other vehicles available in apartments:
| This neighborhood: | 1.1 |
| Philadelphia: | 1.3 |
Average number of cars or other vehicles available in apartments:
| Here: | 0.8 |
| city: | 0.8 |
Percentage of units with a mortgage:
| Italian Market: | 62.9% |
| Philadelphia: | 58.9% |
Housing prices:
- Average estimated value of townhouses or other attached units in 2022 (56.3% of all units):
This neighborhood: $683,266 city: $243,508
- Average estimated '22 value of housing units in 5-or-more-unit structures (16.8% of all units):
Italian Market: $395,809 Philadelphia: $434,542

- Year house built in Italian Market
- 682020 or later
- 4142010 to 2019
- 1922000 to 2009
- 691990 to 1999
- 671980 to 1989
- 761970 to 1979
- 1211960 to 1969
- 2491950 to 1959
- 1431940 to 1949
- 1,6301939 or earlier

City-data.com crime index for city in 2020 (higher means more crime):
| City: | 169.8 |
| U.S. average: | 219.5 |
Travel time to work (commute)
![Travel time to work (commute)]()
- 49Less than 5 minutes
- 1095 to 9 minutes
- 16710 to 14 minutes
- 28315 to 19 minutes
- 37020 to 24 minutes
- 12325 to 29 minutes
- 37830 to 34 minutes
- 7635 to 39 minutes
- 8740 to 44 minutes
- 13345 to 59 minutes
- 17860 to 89 minutes
- 5290 or more minutes

Means of transportation to work
![Means of transportation to work]()
- 29.1%792Drove a car alone
- 5.3%144Carpooled
- 8.7%237Bus
- 9.1%247Subway or elevated rail
- 6.8%185Long-distance train or commuter rail
- 1.8%48Light rail, streetcar or trolley
- 5.6%152Taxi
- 7.8%212Motorcycle
- 8.8%241Bicycle
- 17.1%465Walked
- 2.2%59Other means
- 28.5%776Worked at home

Time leaving home to go to work
![Time leaving home to go to work]()
- 3512:00 a.m. to 4:59 a.m.
- 495:00 a.m. to 5:29 a.m.
- 415:30 a.m. to 5:59 a.m.
- 496:00 a.m. to 6:29 a.m.
- 756:30 a.m. to 6:59 a.m.
- 2697:00 a.m. to 7:29 a.m.
- 2597:30 a.m. to 7:59 a.m.
- 3848:00 a.m. to 8:29 a.m.
- 2518:30 a.m. to 8:59 a.m.
- 2479:00 a.m. to 9:59 a.m.
- 16410:00 a.m. to 10:59 a.m.
- 3911:00 a.m. to 11:59 a.m.
- 7512:00 p.m. to 3:59 p.m.
- 404:00 p.m. to 11:59 p.m.

Occupations of males:
- Percentage of males in management occupations (except farmers):
Here: 16.0% city: 9.1%
- Percentage of males in business and financial operations occupations:
Here: 6.7% city: 6.0%
- Percentage of males in computer and mathematical occupations:
Here: 11.2% city: 4.6%
- Percentage of males in life, physical, and social science occupations:
Here: 2.8% city: 1.7%
- Percentage of males in community and social services occupations:
Here: 2.4% city: 1.9%
- Percentage of males in legal occupations:
Here: 3.8% city: 1.8%
- Percentage of males in education, training, and library occupations:
Here: 7.9% city: 4.0%
- Percentage of males in arts, design, entertainment, sports, and media occupations:
Here: 4.5% city: 2.5%
- Percentage of males in healthcare practitioners and technical occupations:
Here: 3.0% city: 4.3%
- Percentage of males in service occupations:
Here: 7.8% city: 19.3%
- Percentage of males in sales and office occupations:
Here: 16.5% city: 14.1%
- Percentage of males in production occupations:
Here: 7.0% city: 5.0%
- Percentage of males in transportation occupations:
Here: 1.2% city: 6.9%
- Percentage of males in material moving occupations:
Here: 3.5% city: 6.2%
Occupations of females:
- Percentage of females in management occupations (except farmers):
Here: 12.2% city: 9.1%
- Percentage of females in business and financial operations occupations:
Here: 4.0% city: 6.6%
- Percentage of females in computer and mathematical occupations:
Here: 3.9% city: 1.7%
- Percentage of females in life, physical, and social science occupations:
Here: 6.8% city: 1.6%
- Percentage of females in community and social services occupations:
Here: 4.3% city: 3.6%
- Percentage of females in legal occupations:
Here: 3.1% city: 1.9%
- Percentage of females in education, training, and library occupations:
Here: 11.3% city: 8.5%
- Percentage of females in arts, design, entertainment, sports, and media occupations:
Here: 3.2% city: 2.4%
- Percentage of females in healthcare practitioners and technical occupations:
Here: 16.8% city: 10.3%
- Percentage of females in service occupations:
Here: 13.1% city: 24.4%
- Percentage of females in sales and office occupations:
Here: 18.0% city: 23.4%
- Percentage of females in construction, extraction, and maintenance occupations:
Here: 1.1% city: 0.4%
- Percentage of females in production occupations:
Here: 2.0% city: 2.4%
Education in this neighborhood (subdivision or community):
- Percentage of people 3 years and older in K-12 schools:
Italian Market: 25.6% Philadelphia: 15.6%
- Percentage of people 3 years and older in undergraduate colleges:
Italian Market: 7.3% Philadelphia: 6.0%
- Percentage of people 3 years and older in grad. or professional schools:
Italian Market: 3.5% Philadelphia: 2.8%
- Percentage of students K-12 enrolled in private schools:
Italian Market: 41.0% Philadelphia: 25.0%
Percentage of population below poverty level:
| Italian Market: | 10.5% |
| Philadelphia: | 21.7% |
Median year owner moved in (as recorded in 2022):
Median year renter moved in (as recorded in 2022):
| Italian Market: | 2010 |
| Philadelphia: | 2007 |
Median year renter moved in (as recorded in 2022):
| Italian Market: | 2017 |
| Philadelphia: | 2019 |
Percentage of married-couple families with both working:
| Italian Market: | 87.7% |
| Philadelphia: | 71.4% |

- 60.4%Utility gas
- 27.9%Electricity
- 3.0%Fuel oil, kerosene, etc.
- 2.8%Other fuel
- 2.5%Bottled, tank, or LP gas
- 1.7%Solar energy
- 1.7%No fuel used
Roads and streets:
S 9th St
Length: 0.51 miles
Direction: N-S
Address range: 900 to 1399
Direction: N-S
Address range: 900 to 1399
S 10th St
Length: 0.49 miles
Direction: N-S
Address range: 900 to 1401
Direction: N-S
Address range: 900 to 1401
E Passyunk Ave
Length: 0.35 miles
Direction: SW-NE
Address range: 1116 to 1410
Direction: SW-NE
Address range: 1116 to 1410
S 8th St
Length: 0.28 miles
Direction: N-S
Address range: 801 to 1199
Direction: N-S
Address range: 801 to 1199
Federal St
Length: 0.22 miles
Direction: E-W
Address range: 800 to 999
Direction: E-W
Address range: 800 to 999
Ellsworth St
Length: 0.22 miles
Direction: E-W
Address range: 800 to 999
Direction: E-W
Address range: 800 to 999
Christian St
Length: 0.22 miles
Direction: E-W
Address range: 800 to 999
Direction: E-W
Address range: 800 to 999
Washington Ave
Length: 0.22 miles
Direction: E-W
Address range: 800 to 999
Direction: E-W
Address range: 800 to 999
Carpenter St
Length: 0.22 miles
Direction: E-W
Address range: 800 to 999
Direction: E-W
Address range: 800 to 999
League St
Length: 0.22 miles
Direction: E-W
Address range: 800 to 999
Direction: E-W
Address range: 800 to 999
Wharton St
Length: 0.22 miles
Direction: E-W
Address range: 800 to 999
Direction: E-W
Address range: 800 to 999
Montrose St
Length: 0.22 miles
Direction: E-W
Address range: 800 to 999
Direction: E-W
Address range: 800 to 999
Kimball St
Length: 0.22 miles
Direction: E-W
Address range: 800 to 999
Direction: E-W
Address range: 800 to 999
Reed St
Length: 0.19 miles
Direction: E-W
Address range: 808 to 999
Direction: E-W
Address range: 808 to 999
S Darien St
Length: 0.18 miles
Directions: N-S, SW-NE
Address range: 900 to 1199
Directions: N-S, SW-NE
Address range: 900 to 1199
Hall St
Length: 0.11 miles
Direction: E-W
Address range: 900 to 999
Direction: E-W
Address range: 900 to 999
Annin St
Length: 0.11 miles
Direction: E-W
Address range: 900 to 999
Direction: E-W
Address range: 900 to 999
Sears St
Length: 0.11 miles
Direction: E-W
Address range: 800 to 899
Direction: E-W
Address range: 800 to 899
Earp St
Length: 0.11 miles
Direction: E-W
Address range: 800 to 899
Direction: E-W
Address range: 800 to 899
Latona St
Length: 0.09 miles
Direction: E-W
Address range: 800 to 899
Direction: E-W
Address range: 800 to 899
S Percy St
Length: 0.09 miles
Directions: E-W, N-S, SW-NE
Address range: 1300 to 1399
Directions: E-W, N-S, SW-NE
Address range: 1300 to 1399
Ernest St
Length: 0.08 miles
Direction: E-W
Address range: 900 to 999
Direction: E-W
Address range: 900 to 999
S Delhi St
Length: 0.07 miles
Directions: E-W, N-S
Address range: 900 to 1199
Directions: E-W, N-S
Address range: 900 to 1199
Alter St
Length: 0.07 miles
Direction: E-W
Address range: 800 to 899
Direction: E-W
Address range: 800 to 899
Salter St
Length: 0.03 miles
Direction: E-W
Address range: 900 to 999
Direction: E-W
Address range: 900 to 999
S Mildred St
Length: 0.02 miles
Direction: N-S
Address range: 1200 to 1299
Direction: N-S
Address range: 1200 to 1299