Indian Spring Village neighborhood in Silver Spring, Maryland (MD), 20901, 20903 detailed profile
Settings
X


Business Search - 14 Million verified businesses
Area: 0.291 square miles
Population: 1,837
Population density:
| Indian Spring Village: | 6,303 people per square mile |
| Silver Spring: | 7,993 people per square mile |

- 1,09859.5%White
- 42423.0%Hispanic or Latino
- 1488.0%Asian
- 844.6%Black
- 764.1%Two or more races
- 160.9%Some other race

Distribution of median household income
![Distribution of median household income]()
- 6Less than $10,000
- 29$10,000 to $19,999
- 47$20,000 to $29,999
- 18$30,000 to $39,999
- 36$40,000 to $49,999
- 15$50,000 to $59,999
- 30$60,000 to $74,999
- 48$75,000 to $99,999
- 27$100,000 to $124,999
- 63$125,000 to $149,999
- 105$150,000 to $199,999
- 296$200,000 or more

Distribution of owner-occupied house/condo value
![Distribution of owner-occupied house/condo value]()
- 47Less than $50,000
- 26$50,000 to $99,999
- 11$100,000 to $149,999
- 15$150,000 to $199,999
- 29$200,000 to $249,999
- 3$250,000 to $299,999
- 22$300,000 to $399,999
- 37$400,000 to $499,999
- 391$500,000 to $749,999
- 42$750,000 to $999,999
- 51$1,000,000 or more

Distribution of rent paid by renters
![Distribution of rent paid by renters]()
- 7$200 to $299
- 24$300 to $399
- 28$500 to $599
- 12$700 to $799
- 33$800 to $899
- 45$900 to $999
- 20$1,000 to $1,249
- 84$1,250 to $1,499
- 67$1,500 to $1,999
- 40$2,000 or more

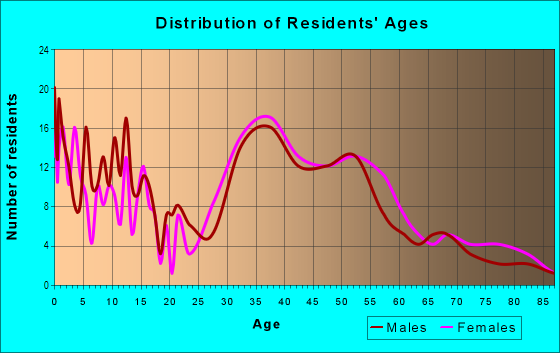
| Males: | 807 |
| Females: | 1,030 |
Males:
| This neighborhood: | 37.9 years |
| Whole city: | 36.7 years |
| This neighborhood: | 37.9 years |
| Whole city: | 36.5 years |
Average household size:
| Indian Spring Village: | 3.3 people |
| Silver Spring: | 2.2 people |
Percentage of family households:
| Indian Spring Village: | 67.7% |
| Silver Spring: | 38.8% |
| Here: | 78.7% |
| Silver Spring: | 32.5% |
Percentage of married-couple families with children (among all households):
| Indian Spring Village: | 29.0% |
| Silver Spring: | 34.5% |
Percentage of single-mother households (among all households):
| Indian Spring Village: | 1.5% |
| Silver Spring: | 6.6% |
Percentage of never married males 15 years old and over:
Percentage of never married females 15 years old and over:
| Indian Spring Village: | 7.9% |
| Silver Spring: | 22.2% |
Percentage of never married females 15 years old and over:
| Indian Spring Village: | 13.0% |
| place: | 24.3% |
Percentage of people that speak English not well or not at all:
| Indian Spring Village: | 3.2% |
| Silver Spring: | 9.9% |
Percentage of people born in this state:
Percentage of people born in another U.S. state:
Percentage of native residents but born outside the U.S.:
Percentage of foreign born residents:
| Here: | 33.4% |
| Silver Spring: | 19.7% |
Percentage of people born in another U.S. state:
| Indian Spring Village: | 47.6% |
| Silver Spring: | 45.9% |
Percentage of native residents but born outside the U.S.:
| Here: | 2.3% |
| place: | 2.4% |
Percentage of foreign born residents:
| Here: | 16.8% |
| Silver Spring: | 32.0% |
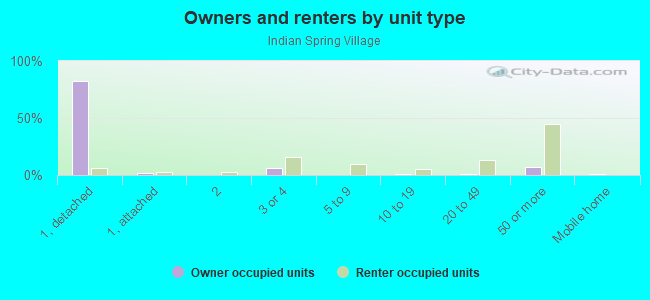
Owner-occupied
Renter-occupied

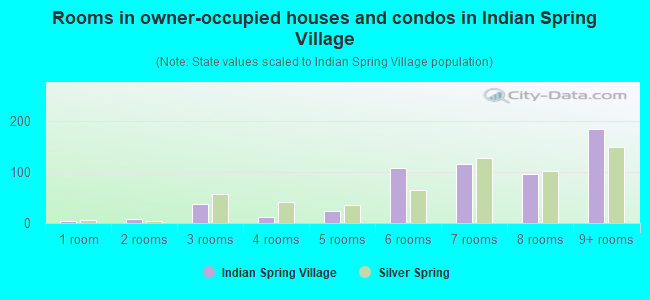
- Rooms in owner-occupied houses and condos in Indian Spring Village
- 31 room
- 72 rooms
- 373 rooms
- 114 rooms
- 235 rooms
- 1096 rooms
- 1177 rooms
- 978 rooms
- 1859+ rooms
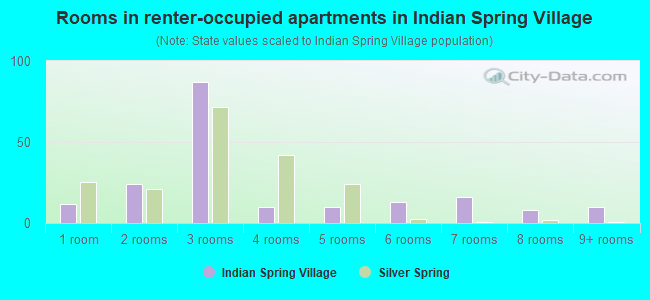
- Rooms in renter-occupied apartments in Indian Spring Village
- 121 room
- 242 rooms
- 873 rooms
- 104 rooms
- 105 rooms
- 136 rooms
- 167 rooms
- 88 rooms
- 109+ rooms
Owner-occupied
Renter-occupied
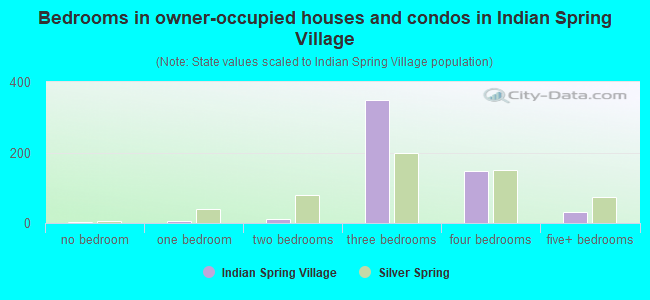
- Bedrooms in owner-occupied houses and condos in Indian Spring Village
- 3no bedroom
- 71 bedroom
- 112 bedrooms
- 3493 bedrooms
- 1474 bedrooms
- 305+ bedrooms
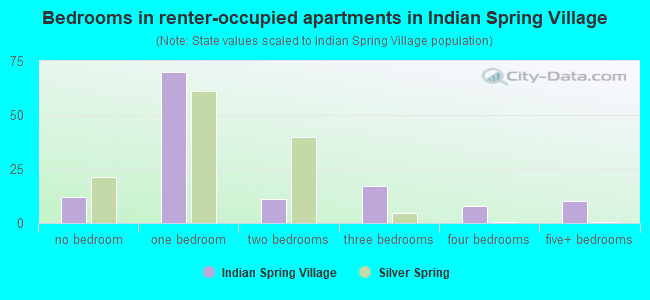
- Bedrooms in renter-occupied apartments in Indian Spring Village
- 12no bedroom
- 701 bedroom
- 112 bedrooms
- 173 bedrooms
- 84 bedrooms
- 105+ bedrooms
Average number of cars or other vehicles available in houses/condos:
Average number of cars or other vehicles available in apartments:
| This neighborhood: | 1.4 |
| Silver Spring: | 1.7 |
Average number of cars or other vehicles available in apartments:
| Here: | 2.0 |
| place: | 0.9 |
Percentage of units with a mortgage:
| Indian Spring Village: | 75.5% |
| Silver Spring: | 76.3% |
Average estimated value of detached houses in 2022 (100.4% of all units):
| Indian Spring Village: | $821,917 |
| Maryland: | $526,819 |
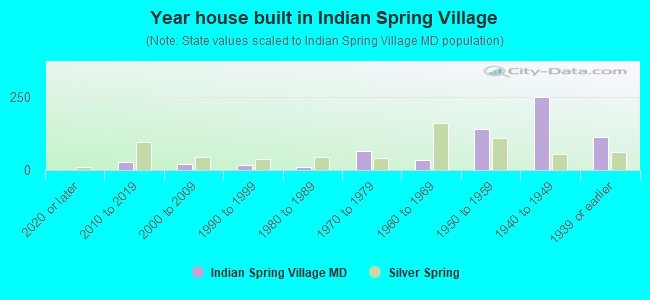
- Year house built in Indian Spring Village
- 02020 or later
- 262010 to 2019
- 192000 to 2009
- 161990 to 1999
- 91980 to 1989
- 641970 to 1979
- 331960 to 1969
- 1391950 to 1959
- 2491940 to 1949
- 1141939 or earlier
Travel time to work (commute)
![Travel time to work (commute)]()
- 6Less than 5 minutes
- 315 to 9 minutes
- 2810 to 14 minutes
- 3115 to 19 minutes
- 6620 to 24 minutes
- 3225 to 29 minutes
- 19430 to 34 minutes
- 4735 to 39 minutes
- 2040 to 44 minutes
- 8845 to 59 minutes
- 7260 to 89 minutes
- 1490 or more minutes

Means of transportation to work
![Means of transportation to work]()
- 41.9%412Drove a car alone
- 6.1%60Carpooled
- 1.8%18Bus
- 14.3%141Subway or elevated rail
- 1.1%11Long-distance train or commuter rail
- 1.3%13Taxi
- 0.8%8Bicycle
- 0.5%5Walked
- 9.8%96Other means
- 26.8%264Worked at home

Time leaving home to go to work
![Time leaving home to go to work]()
- 5112:00 a.m. to 4:59 a.m.
- 225:00 a.m. to 5:29 a.m.
- 285:30 a.m. to 5:59 a.m.
- 836:00 a.m. to 6:29 a.m.
- 96:30 a.m. to 6:59 a.m.
- 687:00 a.m. to 7:29 a.m.
- 877:30 a.m. to 7:59 a.m.
- 1368:00 a.m. to 8:29 a.m.
- 488:30 a.m. to 8:59 a.m.
- 669:00 a.m. to 9:59 a.m.
- 710:00 a.m. to 10:59 a.m.
- 1511:00 a.m. to 11:59 a.m.
- 2112:00 p.m. to 3:59 p.m.
- 134:00 p.m. to 11:59 p.m.

Occupations of males:
- Percentage of males in management occupations (except farmers):
Here: 21.1% place: 11.4%
- Percentage of males in business and financial operations occupations:
Here: 9.9% place: 6.8%
- Percentage of males in computer and mathematical occupations:
Here: 6.7% place: 9.4%
- Percentage of males in architecture and engineering occupations:
Here: 11.1% place: 4.5%
- Percentage of males in community and social services occupations:
Here: 2.6% place: 1.2%
- Percentage of males in legal occupations:
Here: 2.6% place: 3.6%
- Percentage of males in education, training, and library occupations:
Here: 4.1% place: 6.2%
- Percentage of males in arts, design, entertainment, sports, and media occupations:
Here: 3.1% place: 3.9%
- Percentage of males in healthcare practitioners and technical occupations:
Here: 3.0% place: 2.5%
- Percentage of males in service occupations:
Here: 8.2% place: 10.9%
- Percentage of males in sales and office occupations:
Here: 7.9% place: 9.6%
- Percentage of males in construction, extraction, and maintenance occupations:
Here: 13.6% place: 11.6%
- Percentage of males in transportation occupations:
Here: 4.2% place: 6.4%
Occupations of females:
- Percentage of females in management occupations (except farmers):
Here: 18.5% place: 13.0%
- Percentage of females in business and financial operations occupations:
Here: 5.3% place: 8.9%
- Percentage of females in architecture and engineering occupations:
Here: 6.7% place: 1.3%
- Percentage of females in life, physical, and social science occupations:
Here: 4.2% place: 3.4%
- Percentage of females in legal occupations:
Here: 2.5% place: 4.2%
- Percentage of females in education, training, and library occupations:
Here: 11.4% place: 11.2%
- Percentage of females in arts, design, entertainment, sports, and media occupations:
Here: 9.5% place: 4.5%
- Percentage of females in healthcare practitioners and technical occupations:
Here: 5.0% place: 5.3%
- Percentage of females in service occupations:
Here: 11.2% place: 20.4%
- Percentage of females in sales and office occupations:
Here: 15.7% place: 16.7%
- Percentage of females in construction, extraction, and maintenance occupations:
Here: 4.2% place: 0.4%
- Percentage of females in production occupations:
Here: 4.8% place: 0.9%
Percentage of people 16-64 in Armed Forces:
| Indian Spring Village: | 0.3% |
| Silver Spring: | 0.4% |
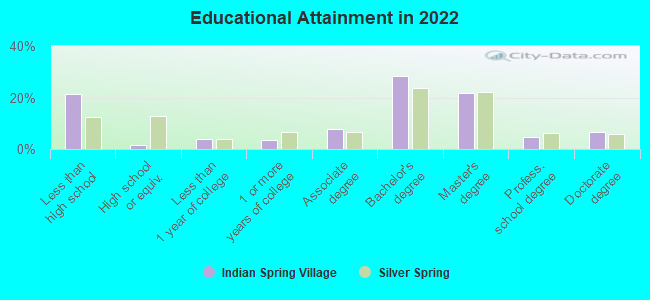
Education in this neighborhood (subdivision or community):
- Percentage of people 3 years and older in K-12 schools:
Indian Spring Village: 23.8% Silver Spring: 14.1%
- Percentage of people 3 years and older in undergraduate colleges:
Indian Spring Village: 5.4% Silver Spring: 3.4%
- Percentage of people 3 years and older in grad. or professional schools:
Indian Spring Village: 4.9% Silver Spring: 2.0%
- Percentage of students K-12 enrolled in private schools:
Indian Spring Village: 38.2% Silver Spring: 12.6%
Percentage of population below poverty level:
| Indian Spring Village: | 2.1% |
| Silver Spring: | 11.0% |
Percentage of married-couple families with both working:
| Indian Spring Village: | 88.2% |
| Silver Spring: | 80.2% |

- 64.4%Utility gas
- 19.1%Bottled, tank, or LP gas
- 11.9%Electricity
- 1.9%Other fuel
- 1.7%Fuel oil, kerosene, etc.
- 1.0%No fuel used
Limited-access highways (interstate or state) in this neighborhood:
Capital Beltway (I- 495)
Length: 0.71 miles
Direction: E-W
Direction: E-W
Highways in this neighborhood:
University Blvd E (State Hwy 193)
Length: 0.19 miles
Direction: SE-NW
Address range: 101 to 132
Direction: SE-NW
Address range: 101 to 132
Roads and streets:
St Lawrence Dr
Length: 0.71 miles
Directions: E-W, SW-NE
Address range: 100 to 499
Directions: E-W, SW-NE
Address range: 100 to 499
Williamsburg Dr
Length: 0.63 miles
Directions: E-W, SW-NE
Address range: 100 to 499
Directions: E-W, SW-NE
Address range: 100 to 499
Cherry Tree Ln
Length: 0.52 miles
Directions: E-W, N-S, SE-NW, SW-NE
Address range: 9800 to 9999
Directions: E-W, N-S, SE-NW, SW-NE
Address range: 9800 to 9999
Waterford Rd
Length: 0.51 miles
Direction: E-W
Address range: 300 to 599
Direction: E-W
Address range: 300 to 599
Whitestone Rd
Length: 0.44 miles
Direction: E-W
Address range: 200 to 499
Direction: E-W
Address range: 200 to 499
Penwood Rd
Length: 0.39 miles
Directions: E-W, N-S, SW-NE
Address range: 300 to 499
Directions: E-W, N-S, SW-NE
Address range: 300 to 499
Big Rock Rd
Length: 0.35 miles
Directions: E-W, N-S, SE-NW, SW-NE
Address range: 500 to 10299
Directions: E-W, N-S, SE-NW, SW-NE
Address range: 500 to 10299
Brookmoor Dr
Length: 0.34 miles
Directions: E-W, N-S, SE-NW
Address range: 10000 to 10199
Directions: E-W, N-S, SE-NW
Address range: 10000 to 10199
Woodburn Rd
Length: 0.29 miles
Directions: E-W, SE-NW
Address range: 9900 to 9999
Directions: E-W, SE-NW
Address range: 9900 to 9999
Merwood Ln
Length: 0.17 miles
Direction: SE-NW
Address range: 9800 to 9999
Direction: SE-NW
Address range: 9800 to 9999
Indian Ln
Length: 0.13 miles
Direction: SE-NW
Address range: 9900 to 9999
Direction: SE-NW
Address range: 9900 to 9999
Edgehill Ln
Length: 0.12 miles
Direction: SE-NW
Address range: 9900 to 9999
Direction: SE-NW
Address range: 9900 to 9999
S Williamsburg Dr
Length: 0.11 miles
Direction: E-W
Address range: 400 to 499
Direction: E-W
Address range: 400 to 499
Nassau Ln
Length: 0.08 miles
Direction: SE-NW
Address range: 9700 to 9799
Direction: SE-NW
Address range: 9700 to 9799
S Waterford Rd
Length: 0.05 miles
Directions: E-W, SW-NE
Address range: 300 to 399
Directions: E-W, SW-NE
Address range: 300 to 399
Whitestone Ct
Length: 0.04 miles
Directions: N-S, SE-NW
Address range: 1 to 99
Directions: N-S, SE-NW
Address range: 1 to 99