Indian Queen Estates neighborhood in Fort Washington, Maryland (MD), 20744 detailed profile
Settings
X


Business Search - 14 Million verified businesses
Area: 0.850 square miles
Population: 254
Population density:
| Indian Queen Estates: | 299 people per square mile |
| Fort Washington: | 1,902 people per square mile |

- 18272.2%Black
- 4317.1%White
- 135.2%Asian
- 114.4%Hispanic or Latino
- 31.2%Two or more races

Median household income in 2022:
| Indian Queen Estates: | $135,494 |
| Fort Washington: | $143,623 |
Distribution of median household income
![Distribution of median household income]()
- 2Less than $10,000
- 12$10,000 to $19,999
- 10$20,000 to $29,999
- 17$30,000 to $39,999
- 7$40,000 to $49,999
- 5$50,000 to $59,999
- 10$60,000 to $74,999
- 24$75,000 to $99,999
- 11$100,000 to $124,999
- 31$125,000 to $149,999
- 25$150,000 to $199,999
- 20$200,000 or more

Distribution of owner-occupied house/condo value
![Distribution of owner-occupied house/condo value]()
- 5Less than $50,000
- 21$50,000 to $99,999
- 12$100,000 to $149,999
- 3$200,000 to $249,999
- 7$250,000 to $299,999
- 31$300,000 to $399,999
- 19$400,000 to $499,999
- 27$500,000 to $749,999
- 8$750,000 to $999,999
- 7$1,000,000 or more

Distribution of rent paid by renters
![Distribution of rent paid by renters]()
- 3$200 to $299
- 1$300 to $399
- 2$800 to $899
- 12$900 to $999
- 3$1,000 to $1,249
- 62$1,250 to $1,499
- 13$1,500 to $1,999
- 23$2,000 or more

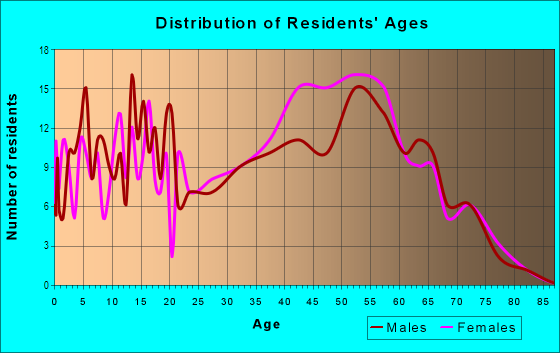
| Males: | 111 |
| Females: | 142 |
Males:
| This neighborhood: | 56.5 years |
| Whole city: | 43.9 years |
| This neighborhood: | 50.6 years |
| Whole city: | 44.5 years |
Average household size:
| Indian Queen Estates: | 2.3 people |
| Fort Washington: | 3.0 people |
Percentage of family households:
| Indian Queen Estates: | 28.3% |
| Fort Washington: | 49.9% |
| Here: | 43.8% |
| Fort Washington: | 56.8% |
Percentage of married-couple families with children (among all households):
| Indian Queen Estates: | 38.7% |
| Fort Washington: | 23.2% |
Percentage of single-mother households (among all households):
| Indian Queen Estates: | 17.4% |
| Fort Washington: | 6.3% |
Percentage of never married males 15 years old and over:
Percentage of never married females 15 years old and over:
| Indian Queen Estates: | 9.8% |
| Fort Washington: | 15.4% |
Percentage of never married females 15 years old and over:
| Indian Queen Estates: | 18.4% |
| place: | 15.2% |
Percentage of people born in this state:
Percentage of people born in another U.S. state:
Percentage of native residents but born outside the U.S.:
Percentage of foreign born residents:
| Here: | 9.9% |
| Fort Washington: | 14.8% |
Percentage of people born in another U.S. state:
| Indian Queen Estates: | 57.4% |
| Fort Washington: | 62.1% |
Percentage of native residents but born outside the U.S.:
| Here: | 3.0% |
| place: | 1.5% |
Percentage of foreign born residents:
| Here: | 29.7% |
| Fort Washington: | 21.7% |

Owner-occupied
Renter-occupied


- Rooms in owner-occupied houses and condos in Indian Queen Estates
- 01 room
- 82 rooms
- 343 rooms
- 64 rooms
- 45 rooms
- 46 rooms
- 127 rooms
- 148 rooms
- 519+ rooms

- Rooms in renter-occupied apartments in Indian Queen Estates
- 281 room
- 02 rooms
- 373 rooms
- 114 rooms
- 55 rooms
- 26 rooms
- 27 rooms
- 38 rooms
- 149+ rooms
Owner-occupied
Renter-occupied

- Bedrooms in owner-occupied houses and condos in Indian Queen Estates
- 0no bedroom
- 291 bedroom
- 62 bedrooms
- 233 bedrooms
- 394 bedrooms
- 245+ bedrooms

- Bedrooms in renter-occupied apartments in Indian Queen Estates
- 28no bedroom
- 461 bedroom
- 382 bedrooms
- 83 bedrooms
- 114 bedrooms
- 85+ bedrooms
Average number of cars or other vehicles available in houses/condos:
Average number of cars or other vehicles available in apartments:
| This neighborhood: | 3.8 |
| Fort Washington: | 2.4 |
Average number of cars or other vehicles available in apartments:
| Here: | 1.4 |
| place: | 2.1 |
Percentage of units with a mortgage:
| Indian Queen Estates: | 72.0% |
| Fort Washington: | 83.5% |
Average estimated value of detached houses in 2022 (100.0% of all units):
| Indian Queen Estates: | $482,264 |
| Maryland: | $526,819 |

- Year house built in Indian Queen Estates
- 02020 or later
- 652010 to 2019
- 222000 to 2009
- 401990 to 1999
- 701980 to 1989
- 101970 to 1979
- 371960 to 1969
- 421950 to 1959
- 21940 to 1949
- 41939 or earlier

Travel time to work (commute)
![Travel time to work (commute)]()
- 10Less than 5 minutes
- 195 to 9 minutes
- 1710 to 14 minutes
- 1715 to 19 minutes
- 3820 to 24 minutes
- 725 to 29 minutes
- 10030 to 34 minutes
- 1335 to 39 minutes
- 940 to 44 minutes
- 4045 to 59 minutes
- 6260 to 89 minutes
- 1390 or more minutes

Means of transportation to work
![Means of transportation to work]()
- 74.9%99Drove a car alone
- 4.5%6Carpooled
- 6.8%9Subway or elevated rail
- 0.8%1Taxi
- 3.0%4Walked
- 3.0%4Other means
- 9.8%13Worked at home

Time leaving home to go to work
![Time leaving home to go to work]()
- 1712:00 a.m. to 4:59 a.m.
- 325:00 a.m. to 5:29 a.m.
- 145:30 a.m. to 5:59 a.m.
- 486:00 a.m. to 6:29 a.m.
- 286:30 a.m. to 6:59 a.m.
- 617:00 a.m. to 7:29 a.m.
- 537:30 a.m. to 7:59 a.m.
- 478:00 a.m. to 8:29 a.m.
- 188:30 a.m. to 8:59 a.m.
- 139:00 a.m. to 9:59 a.m.
- 710:00 a.m. to 10:59 a.m.
- 311:00 a.m. to 11:59 a.m.
- 1512:00 p.m. to 3:59 p.m.
- 54:00 p.m. to 11:59 p.m.

Occupations of males:
- Percentage of males in management occupations (except farmers):
Here: 24.7% place: 10.7%
- Percentage of males in business and financial operations occupations:
Here: 3.3% place: 7.9%
- Percentage of males in computer and mathematical occupations:
Here: 7.9% place: 10.5%
- Percentage of males in architecture and engineering occupations:
Here: 1.8% place: 3.9%
- Percentage of males in community and social services occupations:
Here: 3.6% place: 1.5%
- Percentage of males in education, training, and library occupations:
Here: 18.9% place: 3.0%
- Percentage of males in arts, design, entertainment, sports, and media occupations:
Here: 1.3% place: 2.1%
- Percentage of males in service occupations:
Here: 11.7% place: 12.9%
- Percentage of males in sales and office occupations:
Here: 10.7% place: 14.8%
- Percentage of males in construction, extraction, and maintenance occupations:
Here: 2.5% place: 12.6%
- Percentage of males in production occupations:
Here: 12.4% place: 1.3%
- Percentage of males in transportation occupations:
Here: 9.9% place: 6.7%
- Percentage of males in material moving occupations:
Here: 8.7% place: 2.7%
Occupations of females:
- Percentage of females in management occupations (except farmers):
Here: 14.4% place: 12.9%
- Percentage of females in business and financial operations occupations:
Here: 8.8% place: 12.1%
- Percentage of females in computer and mathematical occupations:
Here: 12.4% place: 10.6%
- Percentage of females in architecture and engineering occupations:
Here: 2.9% place: 0.0%
- Percentage of females in education, training, and library occupations:
Here: 5.3% place: 8.8%
- Percentage of females in arts, design, entertainment, sports, and media occupations:
Here: 2.9% place: 3.1%
- Percentage of females in healthcare practitioners and technical occupations:
Here: 26.2% place: 5.6%
- Percentage of females in service occupations:
Here: 5.1% place: 13.8%
- Percentage of females in sales and office occupations:
Here: 39.7% place: 22.5%
- Percentage of females in transportation occupations:
Here: 9.4% place: 1.6%
- Percentage of females in material moving occupations:
Here: 1.9% place: 1.3%
Education in this neighborhood (subdivision or community):
- Percentage of people 3 years and older in K-12 schools:
Indian Queen Estates: 16.0% Fort Washington: 15.6%
- Percentage of people 3 years and older in undergraduate colleges:
Indian Queen Estates: 10.4% Fort Washington: 4.1%
- Percentage of people 3 years and older in grad. or professional schools:
Indian Queen Estates: 3.6% Fort Washington: 1.9%
- Percentage of students K-12 enrolled in private schools:
Indian Queen Estates: 60.0% Fort Washington: 25.3%
Percentage of population below poverty level:
| Indian Queen Estates: | 6.8% |
| Fort Washington: | 5.2% |
Median year owner moved in (as recorded in 2022):
| Indian Queen Estates: | 1995 |
| Fort Washington: | 2004 |
Percentage of married-couple families with both working:
| Indian Queen Estates: | 119.7% |
| Fort Washington: | 71.1% |

- 42.0%Utility gas
- 39.8%Electricity
- 8.4%Fuel oil, kerosene, etc.
- 3.4%Solar energy
- 2.5%No fuel used
- 2.4%Bottled, tank, or LP gas
- 1.5%Other fuel
Roads and streets:
Fort Foote Rd
Length: 1.41 miles
Directions: E-W, N-S, SE-NW
Address range: 9404 to 9699
Directions: E-W, N-S, SE-NW
Address range: 9404 to 9699
Traverse Way
Length: 0.68 miles
Directions: E-W, N-S, SE-NW, SW-NE
Address range: 9400 to 10099
Directions: E-W, N-S, SE-NW, SW-NE
Address range: 9400 to 10099
Edgewater Ter
Length: 0.63 miles
Directions: E-W, N-S, SE-NW, SW-NE
Address range: 9900 to 10099
Directions: E-W, N-S, SE-NW, SW-NE
Address range: 9900 to 10099
Eagle Head Dr
Length: 0.57 miles
Directions: E-W, N-S, SE-NW, SW-NE
Address range: 100 to 299
Directions: E-W, N-S, SE-NW, SW-NE
Address range: 100 to 299
Indian Queen Point Rd
Length: 0.55 miles
Directions: E-W, N-S, SE-NW, SW-NE
Address range: 9800 to 10099
Directions: E-W, N-S, SE-NW, SW-NE
Address range: 9800 to 10099
Kisconko Turn
Length: 0.52 miles
Directions: E-W, N-S, SE-NW, SW-NE
Address range: 400 to 599
Directions: E-W, N-S, SE-NW, SW-NE
Address range: 400 to 599
Wenzel Ln
Length: 0.37 miles
Directions: N-S, SE-NW, SW-NE
Address range: 9700 to 9921
Directions: N-S, SE-NW, SW-NE
Address range: 9700 to 9921
Kisconko Rd
Length: 0.36 miles
Direction: N-S
Address range: 9500 to 9999
Direction: N-S
Address range: 9500 to 9999
Pocahontas Dr
Length: 0.28 miles
Direction: E-W
Address range: 800 to 999
Direction: E-W
Address range: 800 to 999
Sandy Bar Dr
Length: 0.27 miles
Directions: E-W, N-S, SE-NW
Address range: 1100 to 1299
Directions: E-W, N-S, SE-NW
Address range: 1100 to 1299
Windermere Turn
Length: 0.26 miles
Directions: E-W, N-S, SE-NW, SW-NE
Address range: 9600 to 9699
Directions: E-W, N-S, SE-NW, SW-NE
Address range: 9600 to 9699
Montezuma Dr
Length: 0.24 miles
Directions: E-W, SW-NE
Address range: 1000 to 1199
Directions: E-W, SW-NE
Address range: 1000 to 1199
Wedgewood Dr
Length: 0.24 miles
Directions: N-S, SE-NW
Address range: 9600 to 9799
Directions: N-S, SE-NW
Address range: 9600 to 9799
Potomac Dr
Length: 0.22 miles
Directions: N-S, SE-NW
Address range: 9500 to 9799
Directions: N-S, SE-NW
Address range: 9500 to 9799
Indian Princess Dr
Length: 0.19 miles
Directions: N-S, SE-NW
Address range: 9700 to 9799
Directions: N-S, SE-NW
Address range: 9700 to 9799
Rooster Ln
Length: 0.18 miles
Directions: N-S, SW-NE
Address range: 9600 to 9799
Directions: N-S, SW-NE
Address range: 9600 to 9799
Pelican Garth Rd
Length: 0.18 miles
Direction: E-W
Address range: 100 to 214
Direction: E-W
Address range: 100 to 214
Stony Hill Ct
Length: 0.17 miles
Directions: E-W, SE-NW
Address range: 200 to 399
Directions: E-W, SE-NW
Address range: 200 to 399
Wedgewood Pl
Length: 0.16 miles
Directions: E-W, N-S, SE-NW, SW-NE
Address range: 9600 to 9699
Directions: E-W, N-S, SE-NW, SW-NE
Address range: 9600 to 9699
Stony Hill Dr
Length: 0.12 miles
Directions: N-S, SW-NE
Address range: 9600 to 9615
Directions: N-S, SW-NE
Address range: 9600 to 9615
Highland Vw
Length: 0.12 miles
Directions: E-W, N-S, SE-NW, SW-NE
Address range: 10000 to 10020
Directions: E-W, N-S, SE-NW, SW-NE
Address range: 10000 to 10020
Manteo Ct
Length: 0.10 miles
Direction: N-S
Address range: 9700 to 9799
Direction: N-S
Address range: 9700 to 9799
Ponca Pl
Length: 0.09 miles
Directions: N-S, SE-NW
Address range: 9600 to 9699
Directions: N-S, SE-NW
Address range: 9600 to 9699
S Parrot Dr
Length: 0.08 miles
Direction: E-W
Direction: E-W
Binyon Ct
Length: 0.08 miles
Direction: N-S
Address range: 9800 to 9899
Direction: N-S
Address range: 9800 to 9899
Tribonian Dr
Length: 0.07 miles
Direction: SE-NW
Address range: 9800 to 9899
Direction: SE-NW
Address range: 9800 to 9899
Marina Ct
Length: 0.06 miles
Direction: N-S
Address range: 9900 to 9999
Direction: N-S
Address range: 9900 to 9999
Mandale Ct
Length: 0.05 miles
Directions: N-S, SW-NE
Address range: 400 to 499
Directions: N-S, SW-NE
Address range: 400 to 499
Kisconko Ct
Length: 0.05 miles
Direction: E-W
Address range: 800 to 899
Direction: E-W
Address range: 800 to 899
Pamir Ct
Length: 0.04 miles
Directions: N-S, SE-NW
Address range: 9800 to 9899
Directions: N-S, SE-NW
Address range: 9800 to 9899