Highlandtown neighborhood in Baltimore, Maryland (MD), 21224 detailed profile
Settings
X


Business Search - 14 Million verified businesses
Area: 0.139 square miles
Population: 2,610
Population density:
| Highlandtown: | 18,780 people per square mile |
| Baltimore: | 7,053 people per square mile |

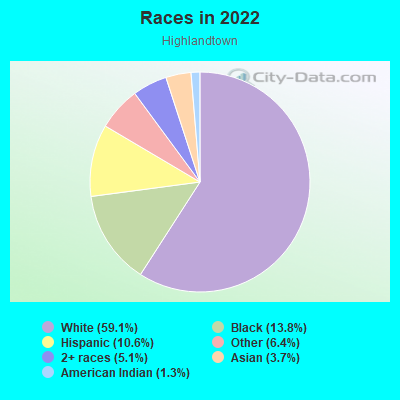
- 1,66659.1%White
- 38813.8%Black
- 30010.6%Hispanic or Latino
- 1816.4%Some other race
- 1455.1%Two or more races
- 1033.7%Asian
- 371.3%American Indian
Median household income in 2022:
| Highlandtown: | $90,529 |
| Baltimore: | $55,198 |
Distribution of median household income
![Distribution of median household income]()
- 78Less than $10,000
- 64$10,000 to $19,999
- 129$20,000 to $29,999
- 151$30,000 to $39,999
- 262$40,000 to $49,999
- 38$50,000 to $59,999
- 120$60,000 to $74,999
- 148$75,000 to $99,999
- 126$100,000 to $124,999
- 145$125,000 to $149,999
- 119$150,000 to $199,999
- 274$200,000 or more

Distribution of owner-occupied house/condo value
![Distribution of owner-occupied house/condo value]()
- 57Less than $50,000
- 49$50,000 to $99,999
- 148$100,000 to $149,999
- 102$150,000 to $199,999
- 153$200,000 to $249,999
- 150$250,000 to $299,999
- 208$300,000 to $399,999
- 135$400,000 to $499,999
- 48$500,000 to $749,999
- 14$750,000 to $999,999

Distribution of rent paid by renters
![Distribution of rent paid by renters]()
- 16Less than $100
- 84$100 to $199
- 45$500 to $599
- 173$600 to $699
- 59$700 to $799
- 202$800 to $899
- 18$900 to $999
- 139$1,000 to $1,249
- 53$1,250 to $1,499
- 143$1,500 to $1,999
- 214$2,000 or more

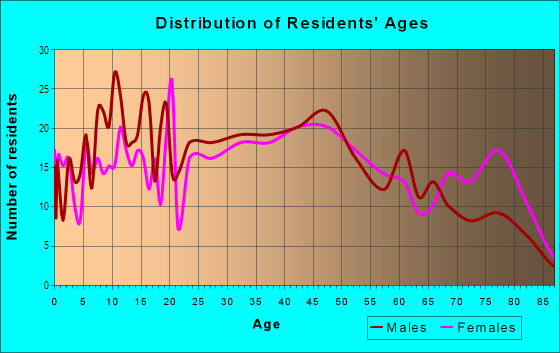
| Males: | 1,192 |
| Females: | 1,418 |
Males:
| This neighborhood: | 34.8 years |
| Whole city: | 35.0 years |
| This neighborhood: | 36.6 years |
| Whole city: | 38.2 years |
Average household size:
| Highlandtown: | 2.2 people |
| Baltimore: | 2.2 people |
Percentage of family households:
| Highlandtown: | 35.1% |
| Baltimore: | 34.2% |
| Here: | 26.0% |
| Baltimore: | 23.3% |
Percentage of married-couple families with children (among all households):
| Highlandtown: | 26.5% |
| Baltimore: | 22.4% |
Percentage of single-mother households (among all households):
| Highlandtown: | 23.0% |
| Baltimore: | 18.7% |
Percentage of never married males 15 years old and over:
Percentage of never married females 15 years old and over:
| Highlandtown: | 24.4% |
| Baltimore: | 25.1% |
Percentage of never married females 15 years old and over:
| Highlandtown: | 28.0% |
| city: | 27.5% |
Percentage of people that speak English not well or not at all:
| Highlandtown: | 4.4% |
| Baltimore: | 2.3% |
Percentage of people born in this state:
Percentage of people born in another U.S. state:
Percentage of native residents but born outside the U.S.:
Percentage of foreign born residents:
| Here: | 48.1% |
| Baltimore: | 64.4% |
Percentage of people born in another U.S. state:
| Highlandtown: | 39.5% |
| Baltimore: | 25.0% |
Percentage of native residents but born outside the U.S.:
| Here: | 2.0% |
| city: | 0.9% |
Percentage of foreign born residents:
| Here: | 11.3% |
| Baltimore: | 9.7% |
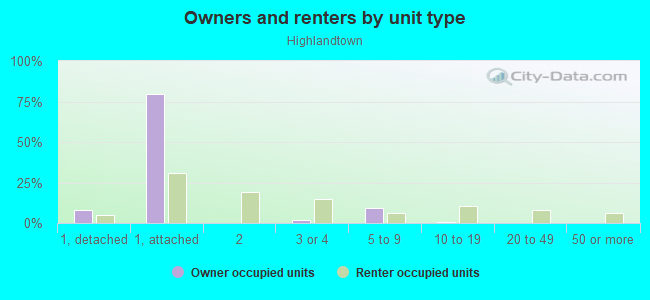
Owner-occupied
Renter-occupied

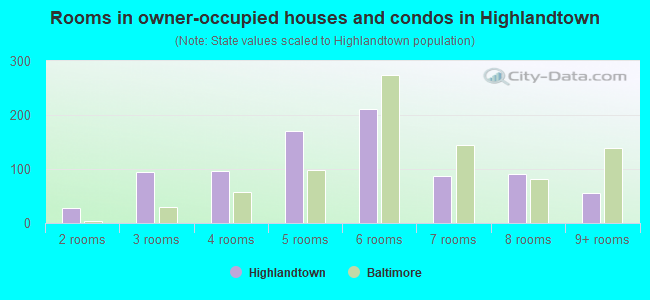
- Rooms in owner-occupied houses and condos in Highlandtown
- 01 room
- 282 rooms
- 943 rooms
- 964 rooms
- 1715 rooms
- 2116 rooms
- 877 rooms
- 908 rooms
- 559+ rooms
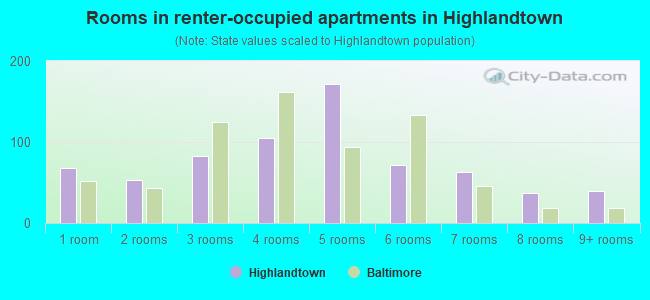
- Rooms in renter-occupied apartments in Highlandtown
- 681 room
- 532 rooms
- 833 rooms
- 1054 rooms
- 1725 rooms
- 716 rooms
- 637 rooms
- 378 rooms
- 409+ rooms
Owner-occupied
Renter-occupied
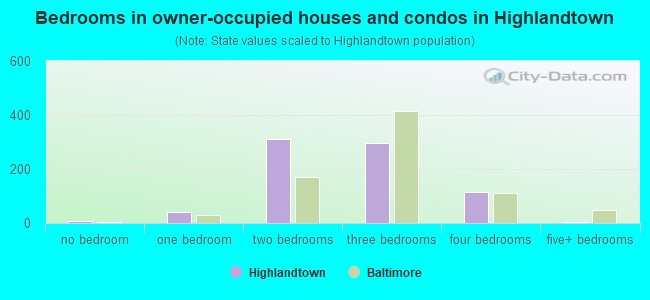
- Bedrooms in owner-occupied houses and condos in Highlandtown
- 6no bedroom
- 391 bedroom
- 3122 bedrooms
- 2983 bedrooms
- 1164 bedrooms
- 35+ bedrooms
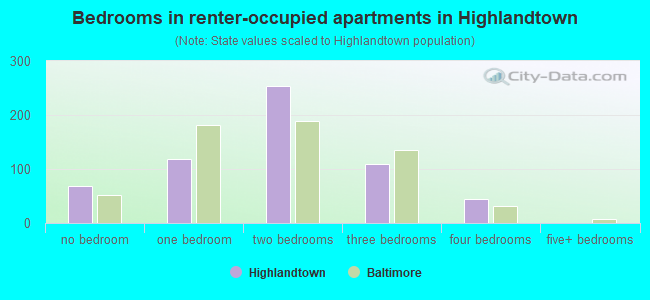
- Bedrooms in renter-occupied apartments in Highlandtown
- 69no bedroom
- 1191 bedroom
- 2532 bedrooms
- 1103 bedrooms
- 444 bedrooms
- 05+ bedrooms
Average number of cars or other vehicles available in houses/condos:
Average number of cars or other vehicles available in apartments:
| This neighborhood: | 1.5 |
| Baltimore: | 1.5 |
Average number of cars or other vehicles available in apartments:
| Here: | 1.0 |
| city: | 0.8 |
Percentage of units with a mortgage:
| Highlandtown: | 78.1% |
| Baltimore: | 64.3% |
Average estimated value of townhouses or other attached units in 2022 (79.0% of all units):
| This neighborhood: | $285,170 |
| city: | $206,258 |
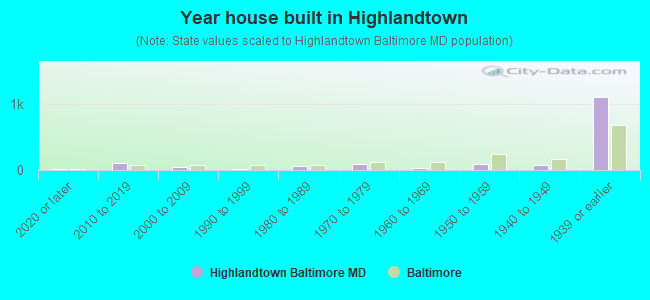
- Year house built in Highlandtown
- 162020 or later
- 1002010 to 2019
- 442000 to 2009
- 151990 to 1999
- 591980 to 1989
- 891970 to 1979
- 341960 to 1969
- 921950 to 1959
- 761940 to 1949
- 1,0951939 or earlier
Travel time to work (commute)
![Travel time to work (commute)]()
- 31Less than 5 minutes
- 775 to 9 minutes
- 12310 to 14 minutes
- 16415 to 19 minutes
- 15820 to 24 minutes
- 8325 to 29 minutes
- 25530 to 34 minutes
- 5235 to 39 minutes
- 7040 to 44 minutes
- 14045 to 59 minutes
- 14660 to 89 minutes
- 8990 or more minutes

Means of transportation to work
![Means of transportation to work]()
- 59.1%990Drove a car alone
- 5.8%97Carpooled
- 7.7%129Bus
- 2.0%33Subway or elevated rail
- 7.8%131Long-distance train or commuter rail
- 1.6%26Ferryboat
- 1.2%20Taxi
- 2.7%45Motorcycle
- 3.6%60Bicycle
- 9.3%155Walked
- 1.0%17Other means
- 16.4%274Worked at home

Time leaving home to go to work
![Time leaving home to go to work]()
- 7612:00 a.m. to 4:59 a.m.
- 415:00 a.m. to 5:29 a.m.
- 445:30 a.m. to 5:59 a.m.
- 986:00 a.m. to 6:29 a.m.
- 1106:30 a.m. to 6:59 a.m.
- 2177:00 a.m. to 7:29 a.m.
- 1507:30 a.m. to 7:59 a.m.
- 1848:00 a.m. to 8:29 a.m.
- 1358:30 a.m. to 8:59 a.m.
- 849:00 a.m. to 9:59 a.m.
- 2210:00 a.m. to 10:59 a.m.
- 911:00 a.m. to 11:59 a.m.
- 2512:00 p.m. to 3:59 p.m.
- 1184:00 p.m. to 11:59 p.m.

Occupations of males:
- Percentage of males in management occupations (except farmers):
Here: 10.2% city: 10.7%
- Percentage of males in business and financial operations occupations:
Here: 9.6% city: 5.9%
- Percentage of males in computer and mathematical occupations:
Here: 5.5% city: 6.1%
- Percentage of males in architecture and engineering occupations:
Here: 8.1% city: 2.9%
- Percentage of males in life, physical, and social science occupations:
Here: 3.0% city: 2.3%
- Percentage of males in community and social services occupations:
Here: 1.7% city: 1.6%
- Percentage of males in education, training, and library occupations:
Here: 4.7% city: 5.4%
- Percentage of males in arts, design, entertainment, sports, and media occupations:
Here: 5.6% city: 2.8%
- Percentage of males in healthcare practitioners and technical occupations:
Here: 8.9% city: 4.0%
- Percentage of males in service occupations:
Here: 4.4% city: 14.7%
- Percentage of males in sales and office occupations:
Here: 14.8% city: 14.2%
- Percentage of males in construction, extraction, and maintenance occupations:
Here: 8.0% city: 5.6%
- Percentage of males in production occupations:
Here: 6.1% city: 4.2%
- Percentage of males in transportation occupations:
Here: 2.4% city: 6.8%
- Percentage of males in material moving occupations:
Here: 4.9% city: 7.0%
Occupations of females:
- Percentage of females in management occupations (except farmers):
Here: 11.6% city: 10.1%
- Percentage of females in business and financial operations occupations:
Here: 12.3% city: 6.6%
- Percentage of females in computer and mathematical occupations:
Here: 5.8% city: 2.4%
- Percentage of females in architecture and engineering occupations:
Here: 2.2% city: 0.9%
- Percentage of females in life, physical, and social science occupations:
Here: 4.5% city: 2.5%
- Percentage of females in community and social services occupations:
Here: 5.5% city: 3.6%
- Percentage of females in legal occupations:
Here: 1.0% city: 1.8%
- Percentage of females in education, training, and library occupations:
Here: 13.1% city: 10.7%
- Percentage of females in arts, design, entertainment, sports, and media occupations:
Here: 2.8% city: 2.4%
- Percentage of females in healthcare practitioners and technical occupations:
Here: 11.9% city: 9.8%
- Percentage of females in service occupations:
Here: 15.0% city: 20.4%
- Percentage of females in sales and office occupations:
Here: 11.3% city: 22.3%
- Percentage of females in production occupations:
Here: 1.7% city: 2.3%
- Percentage of females in material moving occupations:
Here: 1.3% city: 1.9%
Percentage of people 16-64 in Armed Forces:
| Highlandtown: | 0.1% |
| Baltimore: | 0.4% |
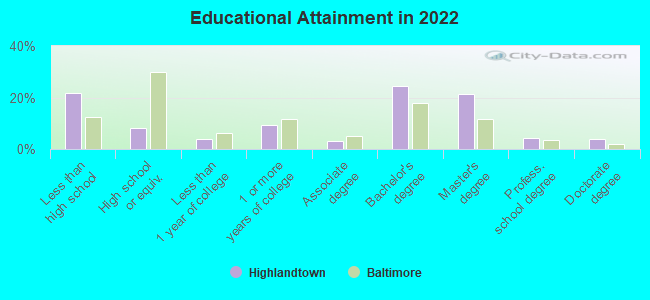
Education in this neighborhood (subdivision or community):
- Percentage of people 3 years and older in K-12 schools:
Highlandtown: 29.5% Baltimore: 14.7%
- Percentage of people 3 years and older in undergraduate colleges:
Highlandtown: 4.9% Baltimore: 6.0%
- Percentage of people 3 years and older in grad. or professional schools:
Highlandtown: 5.0% Baltimore: 2.8%
- Percentage of students K-12 enrolled in private schools:
Highlandtown: 40.9% Baltimore: 12.7%
Percentage of population below poverty level:
| Highlandtown: | 11.3% |
| Baltimore: | 18.5% |
Median year owner moved in (as recorded in 2022):
| Highlandtown: | 2014 |
| Baltimore: | 2009 |
Percentage of married-couple families with both working:
| Highlandtown: | 116.1% |
| Baltimore: | 79.2% |
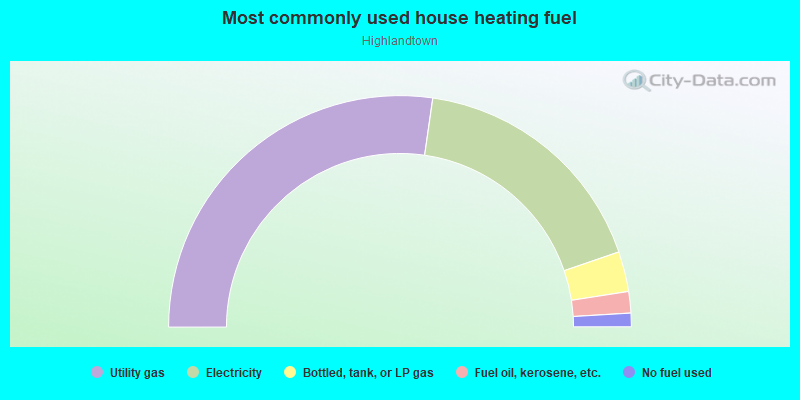
- 54.5%Utility gas
- 34.9%Electricity
- 5.6%Bottled, tank, or LP gas
- 3.0%Fuel oil, kerosene, etc.
- 1.9%No fuel used
Roads and streets:
Bank St
Length: 0.68 miles
Direction: E-W
Address range: 3116 to 4099
Direction: E-W
Address range: 3116 to 4099
Gough St
Length: 0.68 miles
Direction: E-W
Address range: 3100 to 4099
Direction: E-W
Address range: 3100 to 4099
Claremont Ave
Length: 0.39 miles
Direction: E-W
Address range: 3400 to 3999
Direction: E-W
Address range: 3400 to 3999
S Robinson St
Length: 0.18 miles
Direction: N-S
Address range: 200 to 399
Direction: N-S
Address range: 200 to 399
S Clinton St
Length: 0.18 miles
Direction: N-S
Address range: 200 to 399
Direction: N-S
Address range: 200 to 399
S Conkling St
Length: 0.16 miles
Direction: N-S
Address range: 233 to 419
Direction: N-S
Address range: 233 to 419
S Dean St
Length: 0.16 miles
Directions: N-S, SE-NW
Address range: 229 to 419
Directions: N-S, SE-NW
Address range: 229 to 419
Eaton St
Length: 0.16 miles
Direction: N-S
Address range: 229 to 422
Direction: N-S
Address range: 229 to 422
S Grundy St
Length: 0.16 miles
Direction: N-S
Address range: 213 to 443
Direction: N-S
Address range: 213 to 443
Benefit St
Length: 0.15 miles
Direction: E-W
Address range: 3700 to 3899
Direction: E-W
Address range: 3700 to 3899
E Pratt St
Length: 0.14 miles
Direction: E-W
Address range: 3300 to 3499
Direction: E-W
Address range: 3300 to 3499
S Haven St
Length: 0.13 miles
Direction: N-S
Address range: 300 to 499
Direction: N-S
Address range: 300 to 499
S Baylis St
Length: 0.12 miles
Direction: N-S
Address range: 300 to 707
Direction: N-S
Address range: 300 to 707
Chestle Pl
Length: 0.08 miles
Direction: E-W
Address range: 3700 to 3999
Direction: E-W
Address range: 3700 to 3999
S Bouldin St
Length: 0.07 miles
Direction: N-S
Address range: 300 to 399
Direction: N-S
Address range: 300 to 399
S East Ave
Length: 0.07 miles
Direction: N-S
Address range: 300 to 399
Direction: N-S
Address range: 300 to 399
S Fagley St
Length: 0.03 miles
Direction: N-S
Address range: 300 to 399
Direction: N-S
Address range: 300 to 399