Herron Morton neighborhood in Indianapolis, Indiana (IN), 46202 detailed profile
Settings
X


Business Search - 14 Million verified businesses
Area: 0.213 square miles
Population: 1,138
Population density:
| Herron Morton: | 5,344 people per square mile |
| Indianapolis: | 2,425 people per square mile |

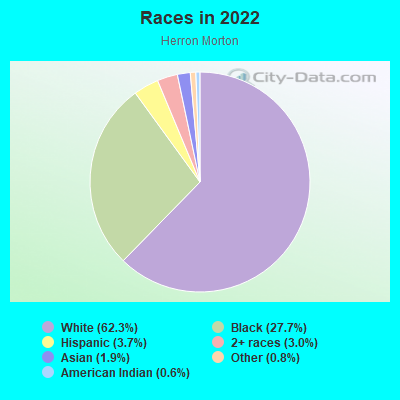
- 71762.3%White
- 31927.7%Black
- 433.7%Hispanic or Latino
- 343.0%Two or more races
- 221.9%Asian
- 90.8%Some other race
- 70.6%American Indian
Median household income in 2022:
| Herron Morton: | $91,369 |
| Indianapolis: | $61,501 |
Distribution of median household income
![Distribution of median household income]()
- 83Less than $10,000
- 108$10,000 to $19,999
- 91$20,000 to $29,999
- 89$30,000 to $39,999
- 69$40,000 to $49,999
- 132$50,000 to $59,999
- 64$60,000 to $74,999
- 53$75,000 to $99,999
- 34$100,000 to $124,999
- 28$125,000 to $149,999
- 81$150,000 to $199,999
- 150$200,000 or more

Distribution of owner-occupied house/condo value
![Distribution of owner-occupied house/condo value]()
- 10Less than $50,000
- 17$50,000 to $99,999
- 29$100,000 to $149,999
- 149$150,000 to $199,999
- 20$200,000 to $249,999
- 51$250,000 to $299,999
- 81$300,000 to $399,999
- 133$400,000 to $499,999
- 63$500,000 to $749,999
- 150$750,000 to $999,999

Distribution of rent paid by renters
![Distribution of rent paid by renters]()
- 36$100 to $199
- 15$200 to $299
- 124$300 to $399
- 22$400 to $499
- 13$500 to $599
- 161$600 to $699
- 119$700 to $799
- 246$800 to $899
- 62$900 to $999
- 106$1,000 to $1,249
- 32$1,250 to $1,499
- 23$1,500 to $1,999
- 44$2,000 or more

Median rent in 2022:
| Herron Morton: | $968 |
| Indianapolis: | $846 |
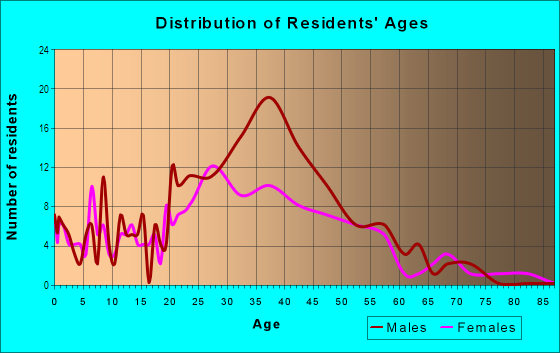
| Males: | 634 |
| Females: | 504 |
Males:
| This neighborhood: | 33.4 years |
| Whole city: | 32.9 years |
| This neighborhood: | 33.5 years |
| Whole city: | 35.4 years |
Average household size:
| Herron Morton: | 2.0 people |
| Indianapolis: | 2.3 people |
Percentage of family households:
| Herron Morton: | 16.8% |
| Indianapolis: | 42.9% |
| Here: | 33.1% |
| Indianapolis: | 37.4% |
Percentage of married-couple families with children (among all households):
| Herron Morton: | 131.3% |
| Indianapolis: | 26.5% |
Percentage of single-mother households (among all households):
| Herron Morton: | 30.6% |
| Indianapolis: | 12.9% |
Percentage of never married males 15 years old and over:
Percentage of never married females 15 years old and over:
| Herron Morton: | 45.0% |
| Indianapolis: | 19.9% |
Percentage of never married females 15 years old and over:
| Herron Morton: | 29.0% |
| city: | 19.2% |
Percentage of people that speak English not well or not at all:
| Herron Morton: | 0.0% |
| Indianapolis: | 4.2% |
Percentage of people born in this state:
Percentage of people born in another U.S. state:
Percentage of native residents but born outside the U.S.:
Percentage of foreign born residents:
| Here: | 61.1% |
| Indianapolis: | 63.1% |
Percentage of people born in another U.S. state:
| Herron Morton: | 33.5% |
| Indianapolis: | 23.6% |
Percentage of native residents but born outside the U.S.:
| Here: | 0.7% |
| city: | 1.1% |
Percentage of foreign born residents:
| Here: | 4.6% |
| Indianapolis: | 12.2% |
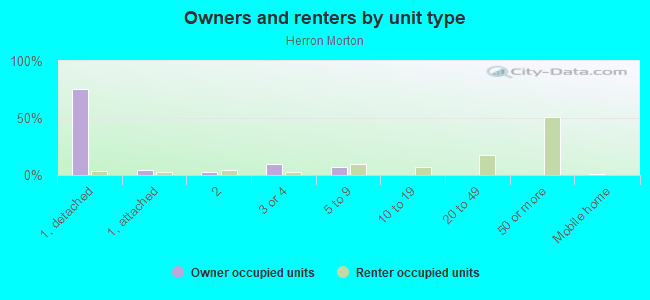
Owner-occupied
Renter-occupied

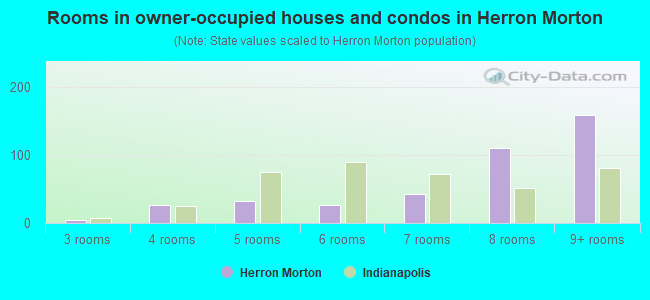
- Rooms in owner-occupied houses and condos in Herron Morton
- 01 room
- 02 rooms
- 53 rooms
- 274 rooms
- 335 rooms
- 266 rooms
- 427 rooms
- 1118 rooms
- 1599+ rooms
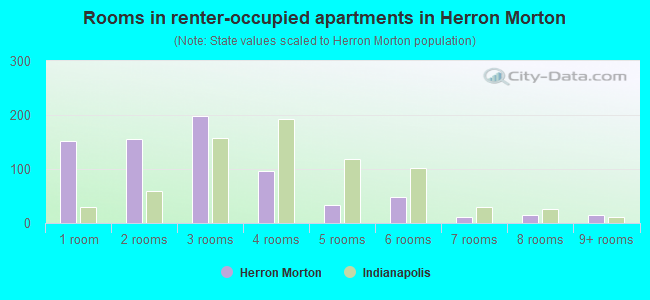
- Rooms in renter-occupied apartments in Herron Morton
- 1521 room
- 1562 rooms
- 1993 rooms
- 974 rooms
- 345 rooms
- 486 rooms
- 127 rooms
- 158 rooms
- 159+ rooms
Owner-occupied
Renter-occupied
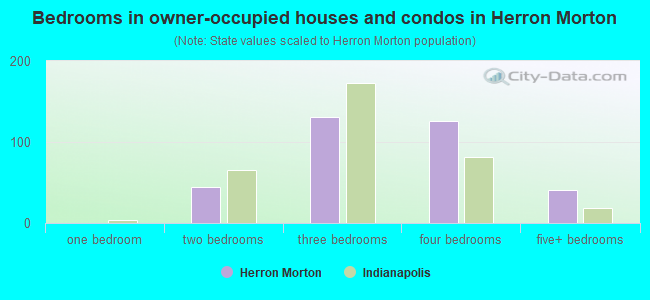
- Bedrooms in owner-occupied houses and condos in Herron Morton
- 0no bedroom
- 01 bedroom
- 442 bedrooms
- 1313 bedrooms
- 1264 bedrooms
- 415+ bedrooms
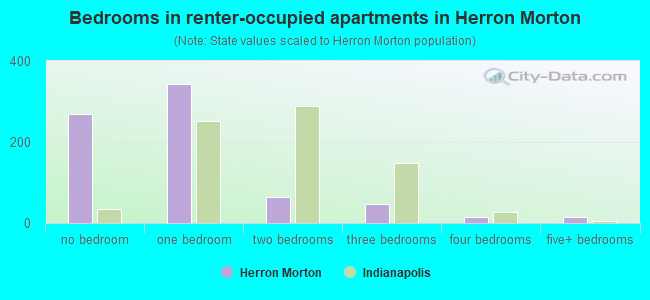
- Bedrooms in renter-occupied apartments in Herron Morton
- 270no bedroom
- 3441 bedroom
- 642 bedrooms
- 473 bedrooms
- 154 bedrooms
- 155+ bedrooms
Average number of cars or other vehicles available in houses/condos:
Average number of cars or other vehicles available in apartments:
| This neighborhood: | 6.5 |
| Indianapolis: | 2.0 |
Average number of cars or other vehicles available in apartments:
| Here: | 0.5 |
| city: | 1.2 |
Percentage of units with a mortgage:
| Herron Morton: | 82.4% |
| Indianapolis: | 68.8% |
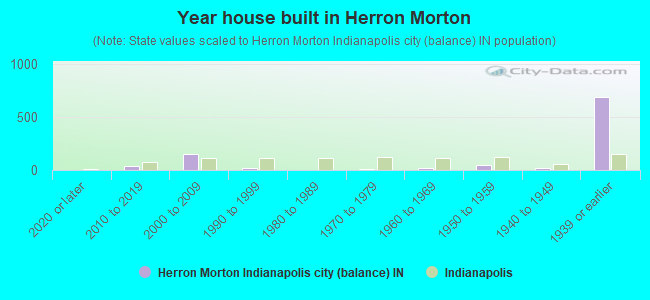
- Year house built in Herron Morton
- 02020 or later
- 372010 to 2019
- 1502000 to 2009
- 161990 to 1999
- 21980 to 1989
- 101970 to 1979
- 191960 to 1969
- 481950 to 1959
- 191940 to 1949
- 6861939 or earlier
City-data.com crime index for city in 2020 (higher means more crime):
| City: | 465.4 |
| U.S. average: | 219.5 |
Travel time to work (commute)
![Travel time to work (commute)]()
- 13Less than 5 minutes
- 805 to 9 minutes
- 13510 to 14 minutes
- 8215 to 19 minutes
- 6720 to 24 minutes
- 5625 to 29 minutes
- 4230 to 34 minutes
- 1435 to 39 minutes
- 1940 to 44 minutes
- 2045 to 59 minutes
- 2160 to 89 minutes
- 2090 or more minutes

Means of transportation to work
![Means of transportation to work]()
- 62.6%529Drove a car alone
- 2.5%21Carpooled
- 14.7%124Bus
- 2.1%18Bicycle
- 12.2%103Walked
- 3.3%28Other means
- 22.1%187Worked at home

Time leaving home to go to work
![Time leaving home to go to work]()
- 2012:00 a.m. to 4:59 a.m.
- 85:00 a.m. to 5:29 a.m.
- 155:30 a.m. to 5:59 a.m.
- 326:00 a.m. to 6:29 a.m.
- 256:30 a.m. to 6:59 a.m.
- 1067:00 a.m. to 7:29 a.m.
- 687:30 a.m. to 7:59 a.m.
- 748:00 a.m. to 8:29 a.m.
- 488:30 a.m. to 8:59 a.m.
- 439:00 a.m. to 9:59 a.m.
- 3310:00 a.m. to 10:59 a.m.
- 811:00 a.m. to 11:59 a.m.
- 2212:00 p.m. to 3:59 p.m.
- 424:00 p.m. to 11:59 p.m.

Occupations of males:
- Percentage of males in management occupations (except farmers):
Here: 9.2% city: 10.3%
- Percentage of males in business and financial operations occupations:
Here: 17.2% city: 5.4%
- Percentage of males in computer and mathematical occupations:
Here: 2.6% city: 4.6%
- Percentage of males in legal occupations:
Here: 1.5% city: 1.4%
- Percentage of males in education, training, and library occupations:
Here: 9.1% city: 2.8%
- Percentage of males in arts, design, entertainment, sports, and media occupations:
Here: 4.9% city: 1.9%
- Percentage of males in service occupations:
Here: 19.6% city: 12.5%
- Percentage of males in sales and office occupations:
Here: 19.0% city: 15.6%
- Percentage of males in production occupations:
Here: 2.7% city: 9.0%
- Percentage of males in transportation occupations:
Here: 12.1% city: 6.4%
Occupations of females:
- Percentage of females in management occupations (except farmers):
Here: 17.9% city: 8.6%
- Percentage of females in business and financial operations occupations:
Here: 5.2% city: 6.9%
- Percentage of females in life, physical, and social science occupations:
Here: 5.8% city: 1.2%
- Percentage of females in community and social services occupations:
Here: 1.1% city: 2.8%
- Percentage of females in legal occupations:
Here: 7.1% city: 1.3%
- Percentage of females in education, training, and library occupations:
Here: 14.4% city: 7.5%
- Percentage of females in arts, design, entertainment, sports, and media occupations:
Here: 2.6% city: 2.1%
- Percentage of females in healthcare practitioners and technical occupations:
Here: 2.3% city: 10.8%
- Percentage of females in service occupations:
Here: 10.8% city: 18.5%
- Percentage of females in sales and office occupations:
Here: 18.7% city: 26.4%
- Percentage of females in transportation occupations:
Here: 11.6% city: 1.2%
Percentage of people 16-64 in Armed Forces:
| Herron Morton: | 0.8% |
| Indianapolis: | 0.1% |
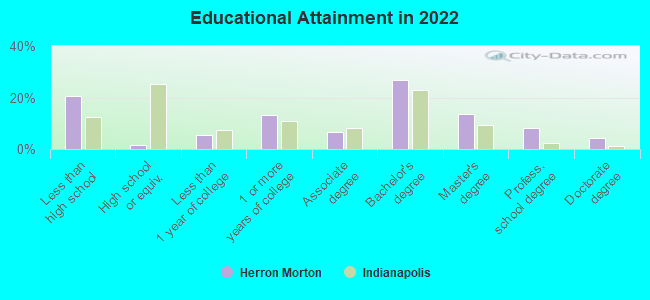
Education in this neighborhood (subdivision or community):
- Percentage of people 3 years and older in K-12 schools:
Herron Morton: 27.0% Indianapolis: 17.3%
- Percentage of people 3 years and older in undergraduate colleges:
Herron Morton: 8.8% Indianapolis: 4.5%
- Percentage of people 3 years and older in grad. or professional schools:
Herron Morton: 6.5% Indianapolis: 1.9%
- Percentage of students K-12 enrolled in private schools:
Herron Morton: 23.4% Indianapolis: 14.8%
Percentage of population below poverty level:
| Herron Morton: | 14.5% |
| Indianapolis: | 15.9% |
Median year renter moved in (as recorded in 2022):
| Herron Morton: | 2019 |
| Indianapolis: | 2020 |
Percentage of married-couple families with both working:
| Herron Morton: | 104.8% |
| Indianapolis: | 72.1% |
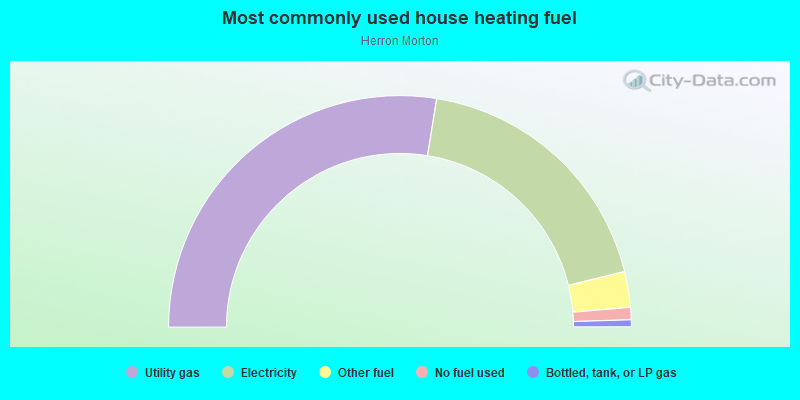
- 55.1%Utility gas
- 37.2%Electricity
- 5.0%Other fuel
- 1.7%No fuel used
- 1.0%Bottled, tank, or LP gas
Roads and streets:
N Delaware St
Length: 0.51 miles
Directions: N-S, SW-NE
Address range: 1600 to 2099
Directions: N-S, SW-NE
Address range: 1600 to 2099
N New Jersey St
Length: 0.51 miles
Directions: N-S, SE-NW
Address range: 1600 to 2099
Directions: N-S, SE-NW
Address range: 1600 to 2099
N Alabama St
Length: 0.51 miles
Directions: N-S, SE-NW
Address range: 1600 to 2099
Directions: N-S, SE-NW
Address range: 1600 to 2099
N Talbott St
Length: 0.51 miles
Direction: N-S
Address range: 1600 to 2099
Direction: N-S
Address range: 1600 to 2099
E 21st St
Length: 0.38 miles
Direction: E-W
Address range: 140 to 549
Direction: E-W
Address range: 140 to 549
E 20th St
Length: 0.38 miles
Direction: E-W
Address range: 125 to 499
Direction: E-W
Address range: 125 to 499
E 16th St
Length: 0.35 miles
Direction: E-W
Address range: 100 to 399
Direction: E-W
Address range: 100 to 399
E 17th St
Length: 0.28 miles
Directions: E-W, SW-NE
Address range: 100 to 399
Directions: E-W, SW-NE
Address range: 100 to 399
E 19th St
Length: 0.27 miles
Direction: E-W
Address range: 122 to 399
Direction: E-W
Address range: 122 to 399