Harvest Creek neighborhood in Riverview, Florida (FL), 33619, 33569 detailed profile
Settings
X


Business Search - 14 Million verified businesses
Area: 0.954 square miles
Population: 2,500
Population density:
| Harvest Creek: | 2,620 people per square mile |
| Riverview: | 12,516 people per square mile |

- 88935.6%Black
- 84333.8%White
- 61024.4%Hispanic or Latino
- 773.1%Asian
- 481.9%Two or more races
- 301.2%Some other race

Median household income in 2022:
| Harvest Creek: | $80,383 |
| Riverview: | $98,470 |
Distribution of median household income
![Distribution of median household income]()
- 77Less than $10,000
- 23$10,000 to $19,999
- 65$20,000 to $29,999
- 86$30,000 to $39,999
- 52$40,000 to $49,999
- 83$50,000 to $59,999
- 106$60,000 to $74,999
- 156$75,000 to $99,999
- 152$100,000 to $124,999
- 81$125,000 to $149,999
- 60$150,000 to $199,999
- 110$200,000 or more

Distribution of owner-occupied house/condo value
![Distribution of owner-occupied house/condo value]()
- 16Less than $50,000
- 8$50,000 to $99,999
- 77$100,000 to $149,999
- 134$150,000 to $199,999
- 149$200,000 to $249,999
- 126$250,000 to $299,999
- 175$300,000 to $399,999
- 15$400,000 to $499,999
- 29$500,000 to $749,999
- 4$750,000 to $999,999
- 15$1,000,000 or more

Distribution of rent paid by renters
![Distribution of rent paid by renters]()
- 22$400 to $499
- 12$900 to $999
- 23$1,000 to $1,249
- 103$1,250 to $1,499
- 116$1,500 to $1,999
- 28$2,000 or more

Median rent in 2022:
| Harvest Creek: | $1,483 |
| Riverview: | $1,657 |
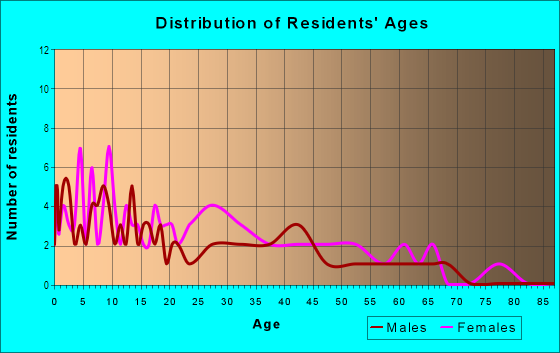
| Males: | 1,058 |
| Females: | 1,442 |
Males:
| This neighborhood: | 35.0 years |
| Whole city: | 32.4 years |
| This neighborhood: | 34.5 years |
| Whole city: | 35.6 years |
Average household size:
| Harvest Creek: | 2.4 people |
| Riverview: | 3.0 people |
Percentage of family households:
| Harvest Creek: | 50.8% |
| Riverview: | 55.0% |
| Here: | 36.8% |
| Riverview: | 51.9% |
Percentage of married-couple families with children (among all households):
| Harvest Creek: | 30.1% |
| Riverview: | 22.7% |
Percentage of single-mother households (among all households):
| Harvest Creek: | 9.6% |
| Riverview: | 10.2% |
Percentage of never married males 15 years old and over:
Percentage of never married females 15 years old and over:
| Harvest Creek: | 14.4% |
| Riverview: | 13.6% |
Percentage of never married females 15 years old and over:
| Harvest Creek: | 24.8% |
| place: | 18.6% |
Percentage of people that speak English not well or not at all:
| Harvest Creek: | 1.2% |
| Riverview: | 3.0% |
Percentage of people born in this state:
Percentage of people born in another U.S. state:
Percentage of native residents but born outside the U.S.:
Percentage of foreign born residents:
| Here: | 41.8% |
| Riverview: | 41.3% |
Percentage of people born in another U.S. state:
| Harvest Creek: | 36.0% |
| Riverview: | 40.5% |
Percentage of native residents but born outside the U.S.:
| Here: | 4.9% |
| place: | 3.6% |
Percentage of foreign born residents:
| Here: | 17.3% |
| Riverview: | 14.6% |

Owner-occupied
Renter-occupied


- Rooms in owner-occupied houses and condos in Harvest Creek
- 51 room
- 02 rooms
- 263 rooms
- 1384 rooms
- 1135 rooms
- 2226 rooms
- 737 rooms
- 1178 rooms
- 429+ rooms

- Rooms in renter-occupied apartments in Harvest Creek
- 01 room
- 92 rooms
- 373 rooms
- 104 rooms
- 1395 rooms
- 356 rooms
- 457 rooms
- 08 rooms
- 259+ rooms
Owner-occupied
Renter-occupied

- Bedrooms in owner-occupied houses and condos in Harvest Creek
- 5no bedroom
- 31 bedroom
- 782 bedrooms
- 4703 bedrooms
- 1684 bedrooms
- 125+ bedrooms

- Bedrooms in renter-occupied apartments in Harvest Creek
- 0no bedroom
- 321 bedroom
- 352 bedrooms
- 1823 bedrooms
- 404 bedrooms
- 145+ bedrooms
Average number of cars or other vehicles available in houses/condos:
Average number of cars or other vehicles available in apartments:
| This neighborhood: | 1.7 |
| Riverview: | 2.0 |
Average number of cars or other vehicles available in apartments:
| Here: | 1.4 |
| place: | 1.4 |
Percentage of units with a mortgage:
| Harvest Creek: | 77.8% |
| Riverview: | 75.7% |

- Year house built in Harvest Creek
- 152020 or later
- 4592010 to 2019
- 3562000 to 2009
- 491990 to 1999
- 181980 to 1989
- 221970 to 1979
- 1271960 to 1969
- 401950 to 1959
- 01940 to 1949
- 131939 or earlier

Travel time to work (commute)
![Travel time to work (commute)]()
- 25Less than 5 minutes
- 1025 to 9 minutes
- 8910 to 14 minutes
- 5415 to 19 minutes
- 15920 to 24 minutes
- 6425 to 29 minutes
- 24230 to 34 minutes
- 8935 to 39 minutes
- 9440 to 44 minutes
- 21245 to 59 minutes
- 9860 to 89 minutes
- 1690 or more minutes

Means of transportation to work
![Means of transportation to work]()
- 74.4%1,118Drove a car alone
- 6.3%94Carpooled
- 1.8%27Bus
- 0.3%5Taxi
- 0.2%3Motorcycle
- 0.2%3Other means
- 16.7%251Worked at home

Time leaving home to go to work
![Time leaving home to go to work]()
- 2112:00 a.m. to 4:59 a.m.
- 885:00 a.m. to 5:29 a.m.
- 405:30 a.m. to 5:59 a.m.
- 1596:00 a.m. to 6:29 a.m.
- 1516:30 a.m. to 6:59 a.m.
- 2487:00 a.m. to 7:29 a.m.
- 747:30 a.m. to 7:59 a.m.
- 2118:00 a.m. to 8:29 a.m.
- 238:30 a.m. to 8:59 a.m.
- 779:00 a.m. to 9:59 a.m.
- 1011:00 a.m. to 11:59 a.m.
- 5812:00 p.m. to 3:59 p.m.
- 874:00 p.m. to 11:59 p.m.

Occupations of males:
- Percentage of males in management occupations (except farmers):
Here: 15.8% place: 13.9%
- Percentage of males in business and financial operations occupations:
Here: 8.0% place: 6.2%
- Percentage of males in computer and mathematical occupations:
Here: 6.1% place: 6.0%
- Percentage of males in architecture and engineering occupations:
Here: 5.2% place: 2.9%
- Percentage of males in community and social services occupations:
Here: 1.2% place: 0.6%
- Percentage of males in education, training, and library occupations:
Here: 2.7% place: 2.8%
- Percentage of males in healthcare practitioners and technical occupations:
Here: 5.3% place: 3.8%
- Percentage of males in service occupations:
Here: 6.3% place: 13.3%
- Percentage of males in sales and office occupations:
Here: 15.4% place: 18.7%
- Percentage of males in construction, extraction, and maintenance occupations:
Here: 5.9% place: 7.8%
- Percentage of males in production occupations:
Here: 3.6% place: 3.5%
- Percentage of males in transportation occupations:
Here: 9.5% place: 5.6%
- Percentage of males in material moving occupations:
Here: 7.7% place: 7.3%
Occupations of females:
- Percentage of females in management occupations (except farmers):
Here: 9.4% place: 9.5%
- Percentage of females in business and financial operations occupations:
Here: 7.6% place: 10.1%
- Percentage of females in computer and mathematical occupations:
Here: 8.4% place: 3.1%
- Percentage of females in architecture and engineering occupations:
Here: 1.3% place: 0.8%
- Percentage of females in community and social services occupations:
Here: 5.1% place: 2.2%
- Percentage of females in legal occupations:
Here: 3.7% place: 1.8%
- Percentage of females in education, training, and library occupations:
Here: 5.9% place: 10.0%
- Percentage of females in healthcare practitioners and technical occupations:
Here: 8.8% place: 8.7%
- Percentage of females in service occupations:
Here: 18.5% place: 15.8%
- Percentage of females in sales and office occupations:
Here: 26.7% place: 31.6%
- Percentage of females in material moving occupations:
Here: 3.8% place: 2.4%
Percentage of people 16-64 in Armed Forces:
| Harvest Creek: | 1.6% |
| Riverview: | 1.1% |
Education in this neighborhood (subdivision or community):
- Percentage of people 3 years and older in K-12 schools:
Harvest Creek: 16.7% Riverview: 18.6%
- Percentage of people 3 years and older in undergraduate colleges:
Harvest Creek: 4.5% Riverview: 4.1%
- Percentage of people 3 years and older in grad. or professional schools:
Harvest Creek: 2.9% Riverview: 1.3%
- Percentage of students K-12 enrolled in private schools:
Harvest Creek: 25.2% Riverview: 8.1%
Percentage of population below poverty level:
| Harvest Creek: | 12.9% |
| Riverview: | 10.0% |
Median year owner moved in (as recorded in 2022):
Median year renter moved in (as recorded in 2022):
| Harvest Creek: | 2014 |
| Riverview: | 2016 |
Median year renter moved in (as recorded in 2022):
| Harvest Creek: | 2019 |
| Riverview: | 2021 |
Percentage of married-couple families with both working:
| Harvest Creek: | 66.7% |
| Riverview: | 71.8% |

- 98.5%Electricity
- 0.7%Solar energy