Harmon Gardens neighborhood in Las Vegas, Nevada (NV), 89119 detailed profile
Settings
X


Business Search - 14 Million verified businesses
Area: 0.007 square miles
Population: 73
Population density:
| Harmon Gardens: | 10,758 people per square mile |
| Las Vegas: | 5,792 people per square mile |

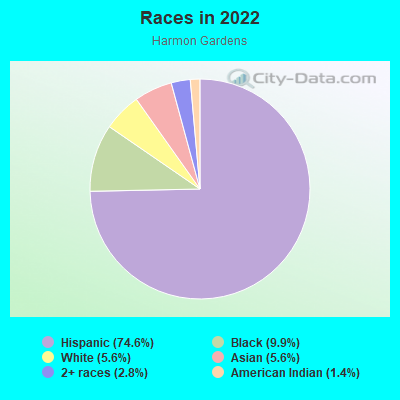
- 5374.6%Hispanic or Latino
- 79.9%Black
- 45.6%White
- 45.6%Asian
- 22.8%Two or more races
- 11.4%American Indian
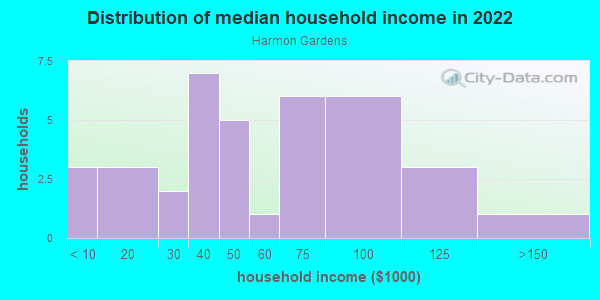
Median household income in 2022:
| Harmon Gardens: | $47,067 |
| Las Vegas: | $68,905 |
Distribution of median household income
![Distribution of median household income]()
- 3Less than $10,000
- 3$10,000 to $19,999
- 2$20,000 to $29,999
- 7$30,000 to $39,999
- 5$40,000 to $49,999
- 1$50,000 to $59,999
- 6$60,000 to $74,999
- 6$75,000 to $99,999
- 3$100,000 to $124,999
- 1$125,000 to $149,999
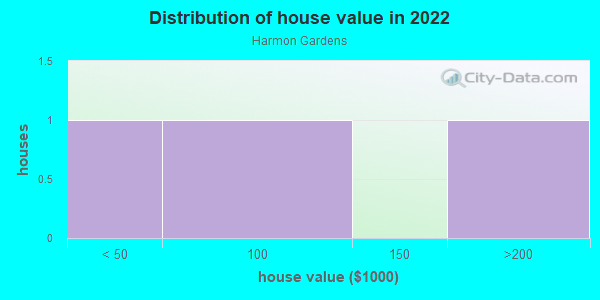
Distribution of owner-occupied house/condo value
![Distribution of owner-occupied house/condo value]()
- 1Less than $50,000
- 1$50,000 to $99,999
- 1$150,000 to $199,999
Distribution of rent paid by renters
![Distribution of rent paid by renters]()
- 1$400 to $499
- 1$500 to $599
- 1$600 to $699
- 10$700 to $799
- 9$800 to $899
- 7$900 to $999
- 4$1,000 to $1,249
- 1$1,250 to $1,499
- 1$2,000 or more

Median rent in 2022:
| Harmon Gardens: | $863 |
| Las Vegas: | $1,277 |
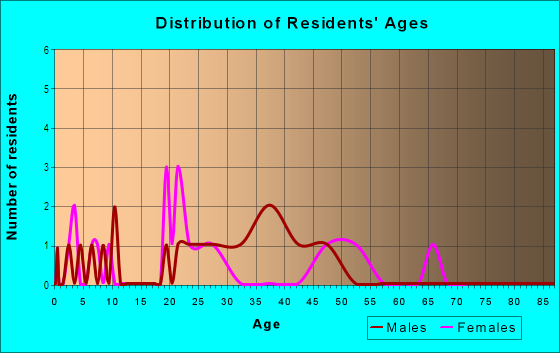
| Males: | 44 |
| Females: | 29 |
Males:
| This neighborhood: | 31.4 years |
| Whole city: | 38.4 years |
| This neighborhood: | 35.4 years |
| Whole city: | 38.9 years |
Average household size:
| Harmon Gardens: | 2.5 people |
| Las Vegas: | 2.7 people |
Percentage of family households:
| Harmon Gardens: | 36.3% |
| Las Vegas: | 45.8% |
| Here: | 37.9% |
| Las Vegas: | 40.9% |
Percentage of married-couple families with children (among all households):
| Harmon Gardens: | 40.1% |
| Las Vegas: | 23.4% |
Percentage of single-mother households (among all households):
| Harmon Gardens: | 7.0% |
| Las Vegas: | 10.1% |
Percentage of never married males 15 years old and over:
Percentage of never married females 15 years old and over:
| Harmon Gardens: | 36.3% |
| Las Vegas: | 19.7% |
Percentage of never married females 15 years old and over:
| Harmon Gardens: | 16.1% |
| city: | 17.0% |
Percentage of people that speak English not well or not at all:
| Harmon Gardens: | 20.0% |
| Las Vegas: | 7.0% |
Percentage of people born in this state:
Percentage of people born in another U.S. state:
Percentage of native residents but born outside the U.S.:
Percentage of foreign born residents:
| Here: | 25.7% |
| Las Vegas: | 27.3% |
Percentage of people born in another U.S. state:
| Harmon Gardens: | 40.9% |
| Las Vegas: | 49.8% |
Percentage of native residents but born outside the U.S.:
| Here: | 2.7% |
| city: | 1.9% |
Percentage of foreign born residents:
| Here: | 30.7% |
| Las Vegas: | 21.0% |
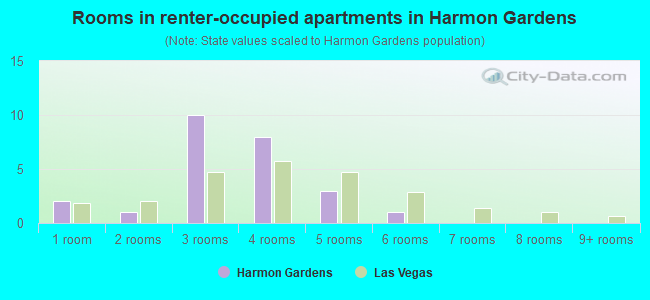
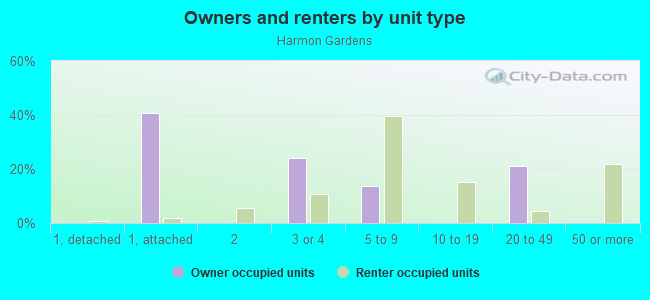
- Rooms in renter-occupied apartments in Harmon Gardens
- 21 room
- 12 rooms
- 103 rooms
- 84 rooms
- 35 rooms
- 16 rooms
- 07 rooms
- 08 rooms
- 09+ rooms
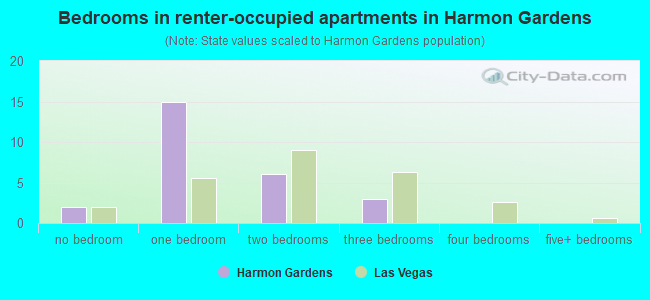
- Bedrooms in renter-occupied apartments in Harmon Gardens
- 2no bedroom
- 151 bedroom
- 62 bedrooms
- 33 bedrooms
- 04 bedrooms
- 05+ bedrooms
Average number of cars or other vehicles available in houses/condos:
Average number of cars or other vehicles available in apartments:
| This neighborhood: | |
| Las Vegas: |
Average number of cars or other vehicles available in apartments:
| Here: | 1.2 |
| city: | 1.3 |
Percentage of units with a mortgage:
| Harmon Gardens: | 13.6% |
| Las Vegas: | 69.3% |
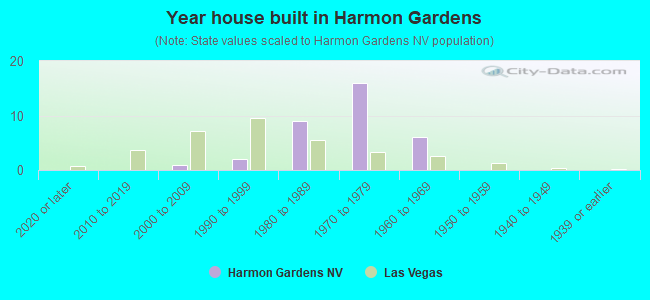
- Year house built in Harmon Gardens
- 02020 or later
- 02010 to 2019
- 12000 to 2009
- 21990 to 1999
- 91980 to 1989
- 161970 to 1979
- 61960 to 1969
- 01950 to 1959
- 01940 to 1949
- 01939 or earlier
City-data.com crime index for city in 2020 (higher means more crime):
| City: | 280.7 |
| U.S. average: | 219.5 |
Travel time to work (commute)
![Travel time to work (commute)]()
- 210 to 14 minutes
- 315 to 19 minutes
- 320 to 24 minutes
- 330 to 34 minutes
- 160 to 89 minutes

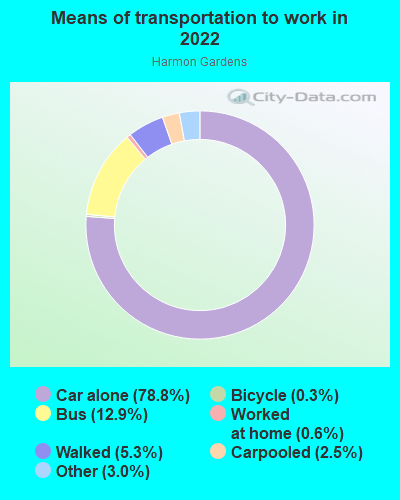
Means of transportation to work
![Means of transportation to work]()
- 76.6%27Drove a car alone
- 11.3%4Bus
- 2.8%1Walked
- 2.8%1Other means
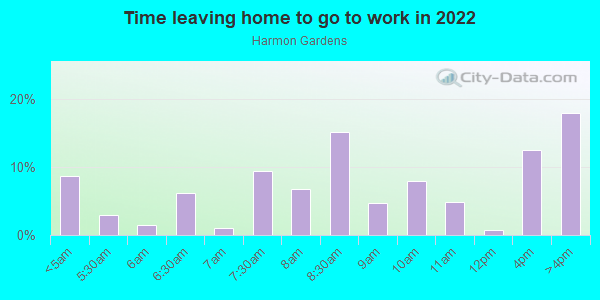
Time leaving home to go to work
![Time leaving home to go to work]()
- 112:00 a.m. to 4:59 a.m.
- 16:00 a.m. to 6:29 a.m.
- 17:00 a.m. to 7:29 a.m.
- 17:30 a.m. to 7:59 a.m.
- 28:00 a.m. to 8:29 a.m.
- 19:00 a.m. to 9:59 a.m.
- 212:00 p.m. to 3:59 p.m.
- 24:00 p.m. to 11:59 p.m.
Occupations of males:
- Percentage of males in computer and mathematical occupations:
Here: 1.3% city: 3.4%
- Percentage of males in architecture and engineering occupations:
Here: 1.3% city: 1.8%
- Percentage of males in education, training, and library occupations:
Here: 6.9% city: 2.5%
- Percentage of males in arts, design, entertainment, sports, and media occupations:
Here: 4.5% city: 2.5%
- Percentage of males in service occupations:
Here: 64.9% city: 23.3%
- Percentage of males in sales and office occupations:
Here: 4.1% city: 16.6%
- Percentage of males in construction, extraction, and maintenance occupations:
Here: 8.2% city: 10.6%
- Percentage of males in production occupations:
Here: 5.4% city: 3.3%
- Percentage of males in transportation occupations:
Here: 10.1% city: 6.6%
- Percentage of males in material moving occupations:
Here: 2.8% city: 5.4%
Occupations of females:
- Percentage of females in management occupations (except farmers):
Here: 1.4% city: 8.5%
- Percentage of females in business and financial operations occupations:
Here: 17.8% city: 5.7%
- Percentage of females in life, physical, and social science occupations:
Here: 1.0% city: 0.4%
- Percentage of females in community and social services occupations:
Here: 2.3% city: 1.9%
- Percentage of females in legal occupations:
Here: 11.7% city: 1.5%
- Percentage of females in education, training, and library occupations:
Here: 16.6% city: 8.0%
- Percentage of females in healthcare practitioners and technical occupations:
Here: 14.1% city: 7.4%
- Percentage of females in service occupations:
Here: 16.0% city: 26.5%
- Percentage of females in sales and office occupations:
Here: 16.0% city: 30.5%
- Percentage of females in production occupations:
Here: 12.9% city: 1.8%
- Percentage of females in transportation occupations:
Here: 3.7% city: 1.6%
- Percentage of females in material moving occupations:
Here: 11.0% city: 2.2%
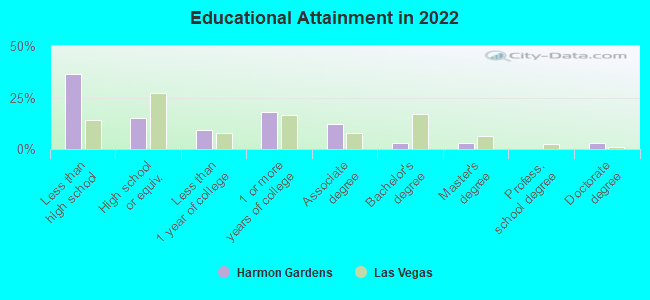
Education in this neighborhood (subdivision or community):
- Percentage of people 3 years and older in K-12 schools:
Harmon Gardens: 26.0% Las Vegas: 17.4%
- Percentage of people 3 years and older in undergraduate colleges:
Harmon Gardens: 4.1% Las Vegas: 4.2%
- Percentage of people 3 years and older in grad. or professional schools:
Harmon Gardens: 0.0% Las Vegas: 1.0%
- Percentage of students K-12 enrolled in private schools:
Harmon Gardens: 0.0% Las Vegas: 12.9%
Percentage of population below poverty level:
| Harmon Gardens: | 19.8% |
| Las Vegas: | 14.1% |
Median year renter moved in (as recorded in 2022):
| Harmon Gardens: | 2017 |
| Las Vegas: | 2020 |
Percentage of married-couple families with both working:
| Harmon Gardens: | 100.0% |
| Las Vegas: | 62.0% |
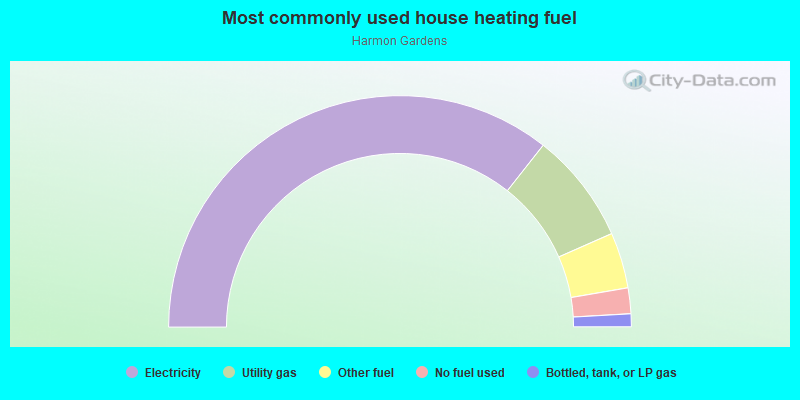
- 71.2%Electricity
- 15.5%Utility gas
- 7.8%Other fuel
- 3.6%No fuel used
- 1.8%Bottled, tank, or LP gas
Roads and streets:
Jupiter Ct
Length: 0.12 miles
Direction: E-W
Address range: 1600 to 1799
Direction: E-W
Address range: 1600 to 1799