Hampton Park neighborhood in Orlando, Florida (FL), 32803 detailed profile
Settings
X


Business Search - 14 Million verified businesses
Area: 0.031 square miles
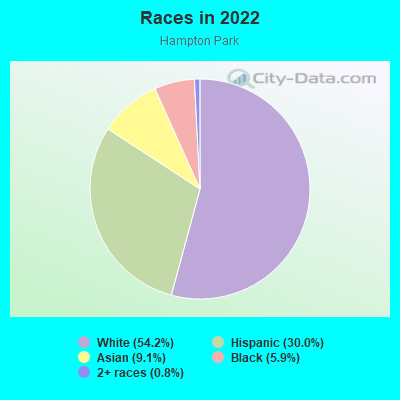
Population: 150
Population density:
| Hampton Park: | 4,771 people per square mile |
| Orlando: | 3,381 people per square mile |

- 11373.4%White
- 2616.9%Hispanic or Latino
- 63.9%Black
- 42.6%Asian
- 42.6%Some other race
- 10.6%Two or more races
Median household income in 2022:
| Hampton Park: | $84,861 |
| Orlando: | $65,354 |
Distribution of median household income
![Distribution of median household income]()
- 5Less than $10,000
- 6$10,000 to $19,999
- 10$20,000 to $29,999
- 8$30,000 to $39,999
- 6$40,000 to $49,999
- 2$50,000 to $59,999
- 13$60,000 to $74,999
- 5$75,000 to $99,999
- 13$100,000 to $124,999
- 3$125,000 to $149,999
- 11$150,000 to $199,999
- 11$200,000 or more

Distribution of owner-occupied house/condo value
![Distribution of owner-occupied house/condo value]()
- 1$50,000 to $99,999
- 3$100,000 to $149,999
- 2$200,000 to $249,999
- 5$250,000 to $299,999
- 6$300,000 to $399,999
- 8$400,000 to $499,999
- 10$500,000 to $749,999
- 6$750,000 to $999,999
- 2$1,000,000 or more

Distribution of rent paid by renters
![Distribution of rent paid by renters]()
- 2$100 to $199
- 1$200 to $299
- 1$300 to $399
- 1$400 to $499
- 4$500 to $599
- 6$700 to $799
- 2$800 to $899
- 6$900 to $999
- 13$1,000 to $1,249
- 6$1,250 to $1,499
- 7$1,500 to $1,999
- 9$2,000 or more

Median rent in 2022:
| Hampton Park: | $1,238 |
| Orlando: | $1,425 |
| Males: | 62 |
| Females: | 87 |
Males:
| This neighborhood: | 39.3 years |
| Whole city: | 34.1 years |
| This neighborhood: | 37.2 years |
| Whole city: | 37.3 years |
Average household size:
| Hampton Park: | 1.9 people |
| Orlando: | 2.3 people |
Percentage of family households:
| Hampton Park: | 38.3% |
| Orlando: | 43.6% |
| Here: | 28.1% |
| Orlando: | 35.3% |
Percentage of married-couple families with children (among all households):
| Hampton Park: | 24.9% |
| Orlando: | 25.1% |
Percentage of single-mother households (among all households):
| Hampton Park: | 22.9% |
| Orlando: | 15.2% |
Percentage of never married males 15 years old and over:
Percentage of never married females 15 years old and over:
| Hampton Park: | 22.7% |
| Orlando: | 21.6% |
Percentage of never married females 15 years old and over:
| Hampton Park: | 26.7% |
| city: | 19.5% |
Percentage of people that speak English not well or not at all:
| Hampton Park: | 0.0% |
| Orlando: | 8.8% |
Percentage of people born in this state:
Percentage of people born in another U.S. state:
Percentage of native residents but born outside the U.S.:
Percentage of foreign born residents:
| Here: | 37.8% |
| Orlando: | 34.9% |
Percentage of people born in another U.S. state:
| Hampton Park: | 47.1% |
| Orlando: | 33.1% |
Percentage of native residents but born outside the U.S.:
| Here: | 7.8% |
| city: | 8.5% |
Percentage of foreign born residents:
| Here: | 7.4% |
| Orlando: | 23.6% |
Owner-occupied
Renter-occupied

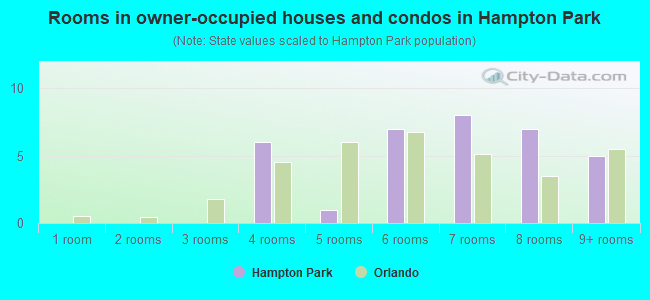
- Rooms in owner-occupied houses and condos in Hampton Park
- 01 room
- 02 rooms
- 03 rooms
- 64 rooms
- 15 rooms
- 76 rooms
- 87 rooms
- 78 rooms
- 59+ rooms
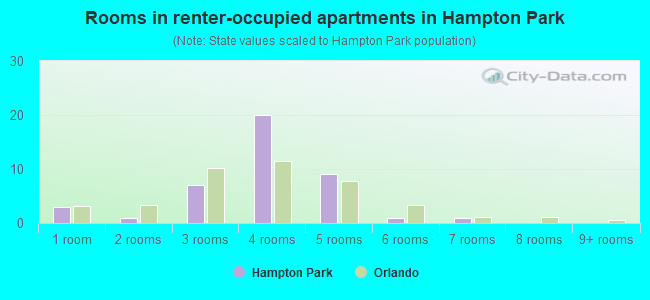
- Rooms in renter-occupied apartments in Hampton Park
- 31 room
- 12 rooms
- 73 rooms
- 204 rooms
- 95 rooms
- 16 rooms
- 17 rooms
- 08 rooms
- 09+ rooms
Owner-occupied
Renter-occupied
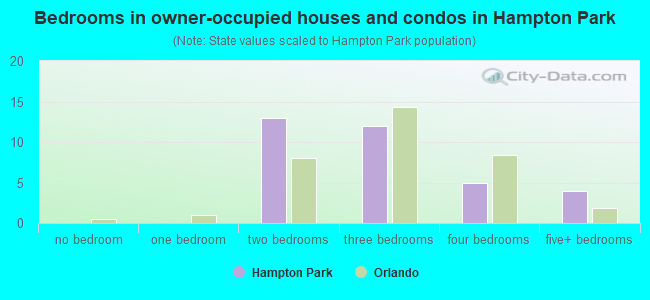
- Bedrooms in owner-occupied houses and condos in Hampton Park
- 0no bedroom
- 01 bedroom
- 132 bedrooms
- 123 bedrooms
- 54 bedrooms
- 45+ bedrooms
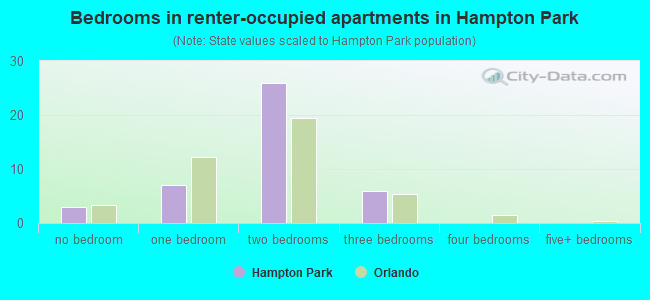
- Bedrooms in renter-occupied apartments in Hampton Park
- 3no bedroom
- 71 bedroom
- 262 bedrooms
- 63 bedrooms
- 04 bedrooms
- 05+ bedrooms
Average number of cars or other vehicles available in houses/condos:
Average number of cars or other vehicles available in apartments:
| This neighborhood: | 1.9 |
| Orlando: | 1.9 |
Average number of cars or other vehicles available in apartments:
| Here: | 1.4 |
| city: | 1.3 |
Percentage of units with a mortgage:
| Hampton Park: | 81.0% |
| Orlando: | 71.0% |
Housing prices:
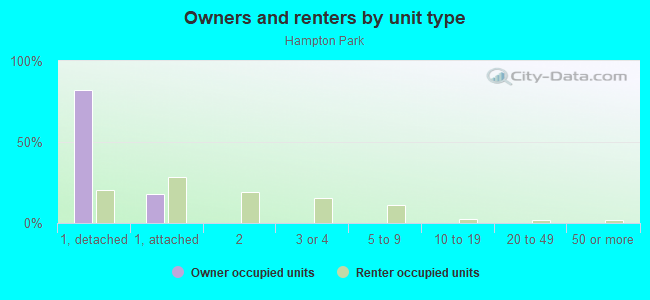
- Average estimated value of detached houses in 2022 (60.6% of all units):
Hampton Park: $413,504 Orlando: $408,856
- Average estimated value of townhouses or other attached units in 2022 (21.3% of all units):
This neighborhood: $339,000 city: $256,791
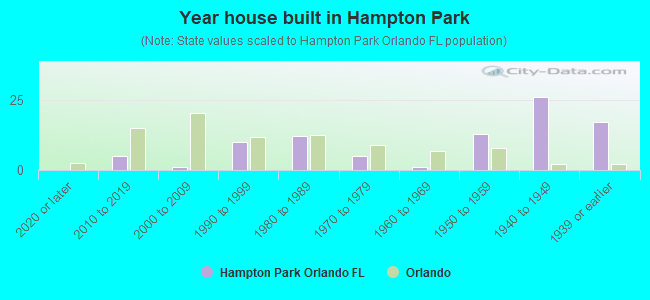
- Year house built in Hampton Park
- 02020 or later
- 52010 to 2019
- 12000 to 2009
- 101990 to 1999
- 121980 to 1989
- 51970 to 1979
- 11960 to 1969
- 131950 to 1959
- 261940 to 1949
- 171939 or earlier
City-data.com crime index for city in 2020 (higher means more crime):
| City: | 423.0 |
| U.S. average: | 219.5 |
Travel time to work (commute)
![Travel time to work (commute)]()
- 2Less than 5 minutes
- 85 to 9 minutes
- 1210 to 14 minutes
- 815 to 19 minutes
- 1820 to 24 minutes
- 625 to 29 minutes
- 1230 to 34 minutes
- 335 to 39 minutes
- 340 to 44 minutes
- 1045 to 59 minutes
- 160 to 89 minutes
- 190 or more minutes

Means of transportation to work
![Means of transportation to work]()
- 85.9%81Drove a car alone
- 1.1%1Carpooled
- 1.1%1Bus
- 2.1%2Light rail, streetcar or trolley
- 1.1%1Bicycle
- 3.2%3Walked
- 2.1%2Other means
- 6.4%6Worked at home

Time leaving home to go to work
![Time leaving home to go to work]()
- 35:00 a.m. to 5:29 a.m.
- 15:30 a.m. to 5:59 a.m.
- 46:00 a.m. to 6:29 a.m.
- 56:30 a.m. to 6:59 a.m.
- 137:00 a.m. to 7:29 a.m.
- 127:30 a.m. to 7:59 a.m.
- 128:00 a.m. to 8:29 a.m.
- 88:30 a.m. to 8:59 a.m.
- 99:00 a.m. to 9:59 a.m.
- 310:00 a.m. to 10:59 a.m.
- 612:00 p.m. to 3:59 p.m.
- 24:00 p.m. to 11:59 p.m.

Occupations of males:
- Percentage of males in management occupations (except farmers):
Here: 11.8% city: 13.1%
- Percentage of males in business and financial operations occupations:
Here: 11.0% city: 6.3%
- Percentage of males in computer and mathematical occupations:
Here: 4.2% city: 4.7%
- Percentage of males in architecture and engineering occupations:
Here: 10.3% city: 3.3%
- Percentage of males in life, physical, and social science occupations:
Here: 3.8% city: 0.6%
- Percentage of males in legal occupations:
Here: 5.3% city: 1.5%
- Percentage of males in education, training, and library occupations:
Here: 3.3% city: 2.4%
- Percentage of males in arts, design, entertainment, sports, and media occupations:
Here: 1.4% city: 3.3%
- Percentage of males in healthcare practitioners and technical occupations:
Here: 11.0% city: 4.4%
- Percentage of males in service occupations:
Here: 11.4% city: 15.4%
- Percentage of males in sales and office occupations:
Here: 27.4% city: 18.7%
- Percentage of males in construction, extraction, and maintenance occupations:
Here: 5.7% city: 7.6%
- Percentage of males in transportation occupations:
Here: 1.9% city: 7.4%
Occupations of females:
- Percentage of females in management occupations (except farmers):
Here: 2.7% city: 10.7%
- Percentage of females in business and financial operations occupations:
Here: 20.4% city: 7.6%
- Percentage of females in architecture and engineering occupations:
Here: 10.4% city: 1.1%
- Percentage of females in life, physical, and social science occupations:
Here: 1.7% city: 0.9%
- Percentage of females in legal occupations:
Here: 4.8% city: 2.0%
- Percentage of females in education, training, and library occupations:
Here: 3.8% city: 6.5%
- Percentage of females in arts, design, entertainment, sports, and media occupations:
Here: 2.7% city: 2.5%
- Percentage of females in healthcare practitioners and technical occupations:
Here: 10.0% city: 8.2%
- Percentage of females in service occupations:
Here: 12.5% city: 20.2%
- Percentage of females in sales and office occupations:
Here: 42.9% city: 28.3%
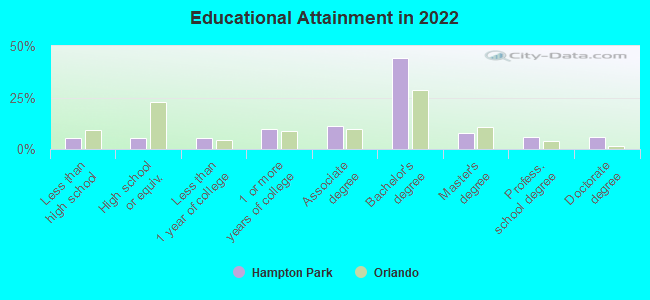
Education in this neighborhood (subdivision or community):
- Percentage of people 3 years and older in K-12 schools:
Hampton Park: 12.5% Orlando: 14.9%
- Percentage of people 3 years and older in undergraduate colleges:
Hampton Park: 0.7% Orlando: 5.5%
- Percentage of people 3 years and older in grad. or professional schools:
Hampton Park: 2.8% Orlando: 1.6%
- Percentage of students K-12 enrolled in private schools:
Hampton Park: 0.0% Orlando: 13.8%
Percentage of population below poverty level:
| Hampton Park: | 19.3% |
| Orlando: | 14.2% |
Median year owner moved in (as recorded in 2022):
Median year renter moved in (as recorded in 2022):
| Hampton Park: | 2011 |
| Orlando: | 2015 |
Median year renter moved in (as recorded in 2022):
| Hampton Park: | 2018 |
| Orlando: | 2020 |
Percentage of married-couple families with both working:
| Hampton Park: | 39.1% |
| Orlando: | 64.1% |
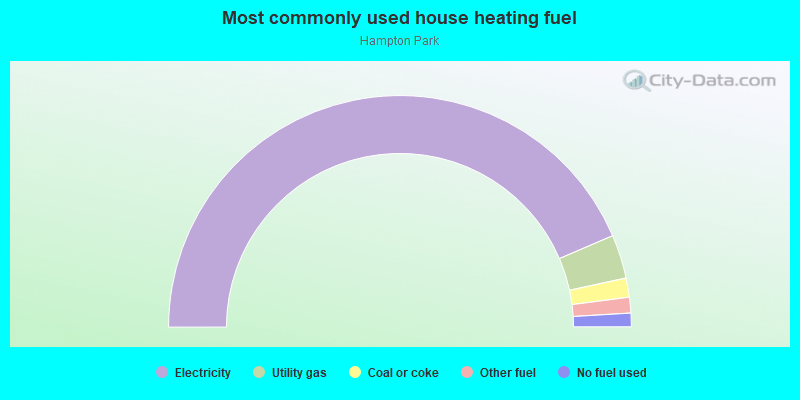
- 87.2%Electricity
- 6.1%Utility gas
- 2.7%Coal or coke
- 2.2%Other fuel
- 1.9%No fuel used
Roads and streets:
E Robinson St
Length: 0.25 miles
Direction: E-W
Address range: 2011 to 2399
Direction: E-W
Address range: 2011 to 2399
Wescott Ln (Malloy St)
Length: 0.25 miles
Directions: E-W, N-S
Address range: 330 to 601
Directions: E-W, N-S
Address range: 330 to 601
N Hillside Ave
Length: 0.11 miles
Directions: E-W, N-S, SE-NW, SW-NE
Address range: 300 to 343
Directions: E-W, N-S, SE-NW, SW-NE
Address range: 300 to 343
High Fenton Ln
Length: 0.10 miles
Directions: E-W, SW-NE
Directions: E-W, SW-NE
N Forest Ave
Length: 0.10 miles
Direction: N-S
Address range: 300 to 337
Direction: N-S
Address range: 300 to 337
N Glenwood Ave
Length: 0.09 miles
Direction: N-S
Address range: 300 to 377
Direction: N-S
Address range: 300 to 377
Ridgewood St
Length: 0.08 miles
Direction: E-W
Address range: 2100 to 2299
Direction: E-W
Address range: 2100 to 2299
Bidwell St
Length: 0.05 miles
Direction: E-W
Direction: E-W
Roswell Ave
Length: 0.05 miles
Direction: N-S
Address range: 300 to 339
Direction: N-S
Address range: 300 to 339
Glenside Ln
Length: 0.03 miles
Direction: E-W
Direction: E-W
Hillside Ave
Length: 0.02 miles
Directions: E-W, N-S, SE-NW, SW-NE
Directions: E-W, N-S, SE-NW, SW-NE