Hamilton Park neighborhood in Jersey City, New Jersey (NJ), 07302, 07310 detailed profile
Settings
X

Business Search - 14 Million verified businesses
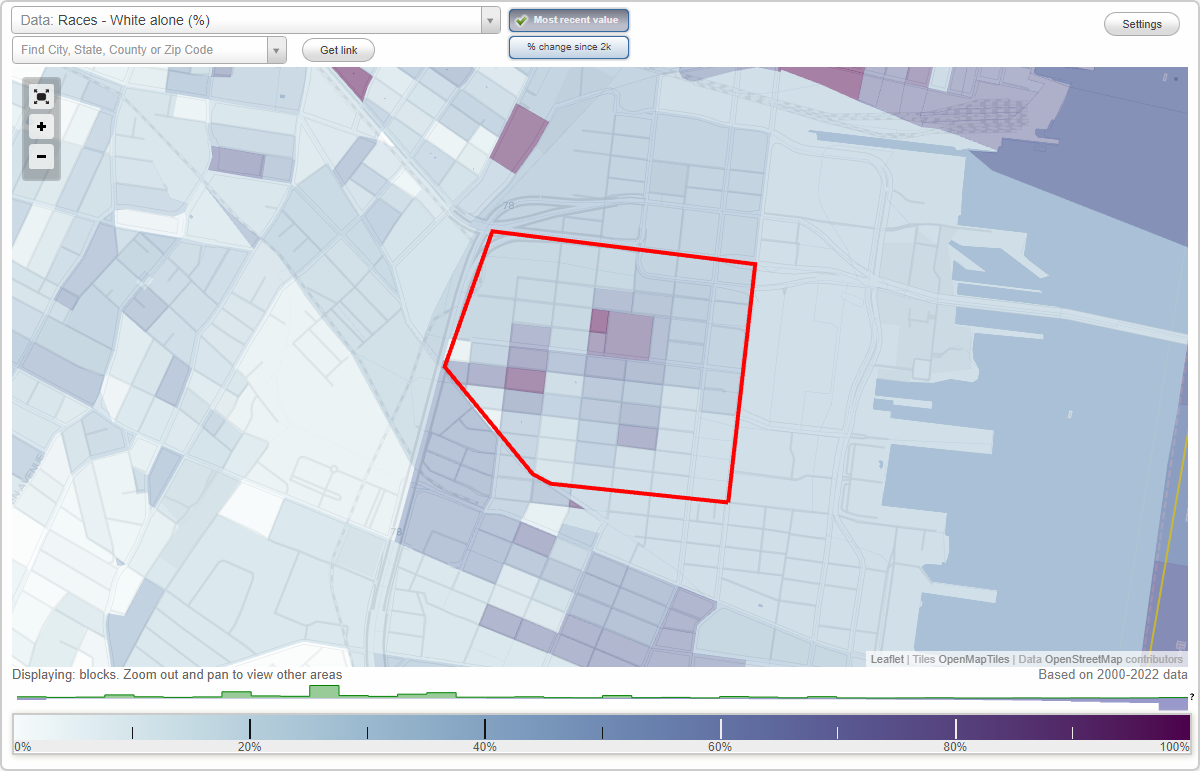
Area: 0.324 square miles
Population: 12,217
Population density:
| Hamilton Park: | 37,728 people per square mile |
| Jersey City: | 19,218 people per square mile |

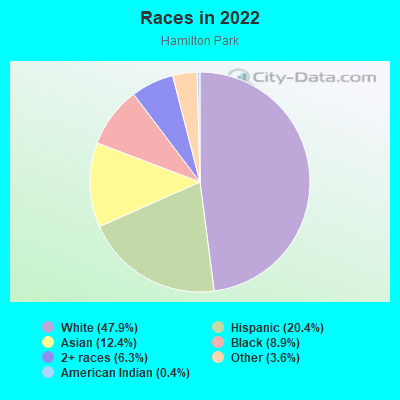
- 5,93147.9%White
- 2,53120.4%Hispanic or Latino
- 1,54112.4%Asian
- 1,1028.9%Black
- 7836.3%Two or more races
- 4513.6%Some other race
- 460.4%American Indian
Median household income in 2022:
| Hamilton Park: | $135,778 |
| Jersey City: | $94,080 |
Distribution of median household income
![Distribution of median household income]()
- 237Less than $10,000
- 207$10,000 to $19,999
- 828$20,000 to $29,999
- 340$30,000 to $39,999
- 593$40,000 to $49,999
- 226$50,000 to $59,999
- 395$60,000 to $74,999
- 514$75,000 to $99,999
- 642$100,000 to $124,999
- 574$125,000 to $149,999
- 620$150,000 to $199,999
- 2,115$200,000 or more

Distribution of owner-occupied house/condo value
![Distribution of owner-occupied house/condo value]()
- 179$200,000 to $249,999
- 45$250,000 to $299,999
- 161$300,000 to $399,999
- 156$400,000 to $499,999
- 574$500,000 to $749,999
- 577$750,000 to $999,999
- 976$1,000,000 or more

Distribution of rent paid by renters
![Distribution of rent paid by renters]()
- 327$600 to $699
- 247$800 to $899
- 220$900 to $999
- 313$1,000 to $1,249
- 990$1,250 to $1,499
- 790$1,500 to $1,999
- 1,950$2,000 or more

Median rent in 2022:
| Hamilton Park: | $2,019 |
| Jersey City: | $1,738 |
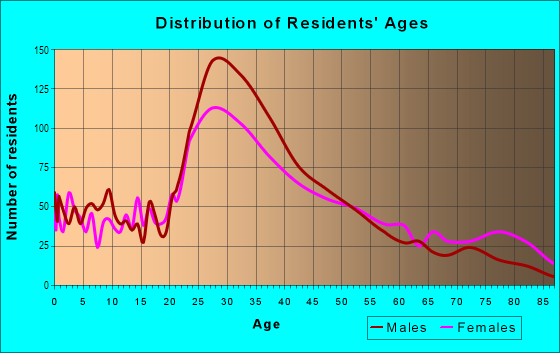
| Males: | 6,727 |
| Females: | 5,489 |
Males:
| This neighborhood: | 33.6 years |
| Whole city: | 34.1 years |
| This neighborhood: | 35.9 years |
| Whole city: | 36.2 years |
Average household size:
| Hamilton Park: | 2.1 people |
| Jersey City: | 2.2 people |
Percentage of family households:
| Hamilton Park: | 43.4% |
| Jersey City: | 39.8% |
| Here: | 38.5% |
| Jersey City: | 34.2% |
Percentage of married-couple families with children (among all households):
| Hamilton Park: | 40.4% |
| Jersey City: | 29.4% |
Percentage of single-mother households (among all households):
| Hamilton Park: | 11.4% |
| Jersey City: | 13.3% |
Percentage of never married males 15 years old and over:
Percentage of never married females 15 years old and over:
| Hamilton Park: | 26.6% |
| Jersey City: | 23.6% |
Percentage of never married females 15 years old and over:
| Hamilton Park: | 18.3% |
| city: | 22.6% |
Percentage of people that speak English not well or not at all:
| Hamilton Park: | 4.4% |
| Jersey City: | 7.2% |
Percentage of people born in this state:
Percentage of people born in another U.S. state:
Percentage of native residents but born outside the U.S.:
Percentage of foreign born residents:
| Here: | 26.6% |
| Jersey City: | 34.5% |
Percentage of people born in another U.S. state:
| Hamilton Park: | 46.7% |
| Jersey City: | 22.1% |
Percentage of native residents but born outside the U.S.:
| Here: | 1.2% |
| city: | 3.8% |
Percentage of foreign born residents:
| Here: | 25.5% |
| Jersey City: | 39.6% |
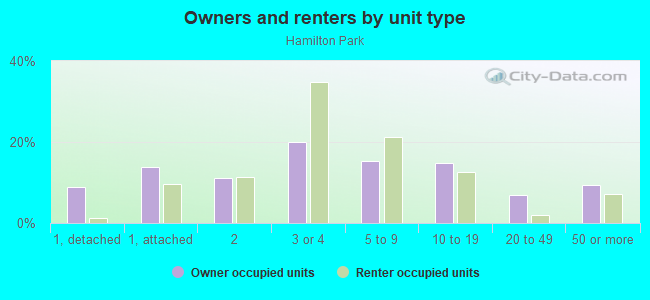
Owner-occupied
Renter-occupied

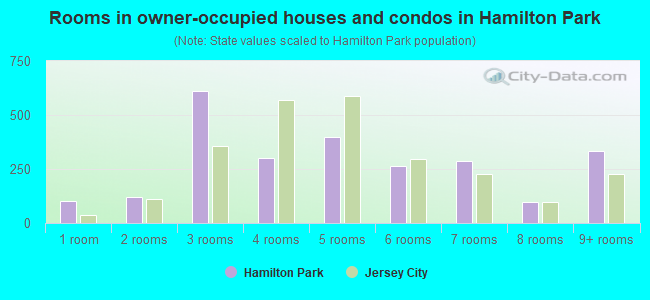
- Rooms in owner-occupied houses and condos in Hamilton Park
- 1001 room
- 1202 rooms
- 6103 rooms
- 3004 rooms
- 3995 rooms
- 2626 rooms
- 2897 rooms
- 998 rooms
- 3349+ rooms
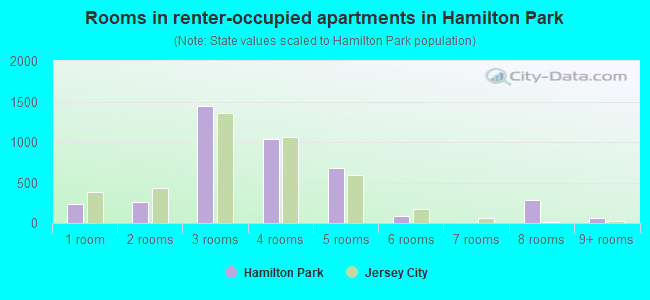
- Rooms in renter-occupied apartments in Hamilton Park
- 2361 room
- 2602 rooms
- 1,4473 rooms
- 1,0414 rooms
- 6795 rooms
- 866 rooms
- 07 rooms
- 2898 rooms
- 629+ rooms
Owner-occupied
Renter-occupied
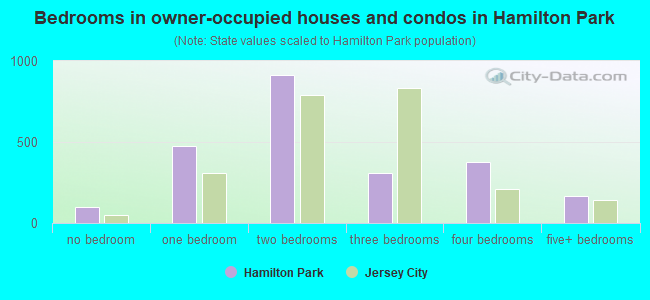
- Bedrooms in owner-occupied houses and condos in Hamilton Park
- 100no bedroom
- 4731 bedroom
- 9162 bedrooms
- 3093 bedrooms
- 3784 bedrooms
- 1655+ bedrooms
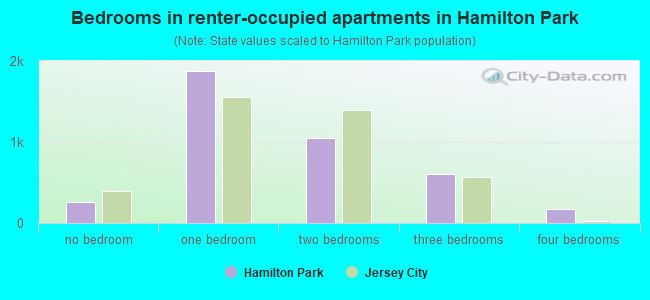
- Bedrooms in renter-occupied apartments in Hamilton Park
- 261no bedroom
- 1,8761 bedroom
- 1,0472 bedrooms
- 6073 bedrooms
- 1674 bedrooms
- 05+ bedrooms
Average number of cars or other vehicles available in houses/condos:
Average number of cars or other vehicles available in apartments:
| This neighborhood: | 0.9 |
| Jersey City: | 1.3 |
Average number of cars or other vehicles available in apartments:
| Here: | 0.8 |
| city: | 0.6 |
Percentage of units with a mortgage:
| Hamilton Park: | 79.8% |
| Jersey City: | 69.4% |
Housing prices:
- Average estimated value of detached houses in 2022 (4.2% of all units):
Hamilton Park: $1,552,802 Jersey City: $732,576
- Average estimated value of townhouses or other attached units in 2022 (11.8% of all units):
This neighborhood: $3,401,686 city: $695,567
- Average estimated value of housing units in 2-unit structures in 2022 (14.2% of all units):
This neighborhood: $3,396,487 Jersey City: $571,976
- Average estimated '22 value of housing units in 3-to-4-unit structures (34.1% of all units):
Hamilton Park: $1,918,299 city: $581,467
- Average estimated '22 value of housing units in 5-or-more-unit structures (6.1% of all units):
Hamilton Park: $935,460 Jersey City: $666,445
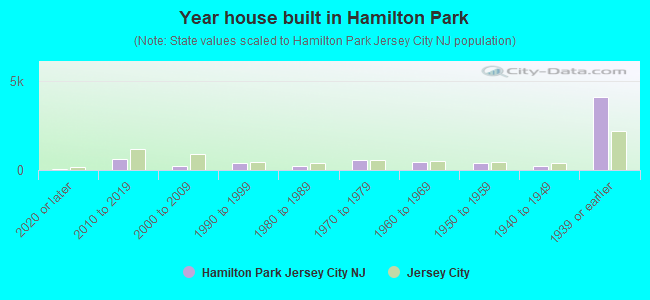
- Year house built in Hamilton Park
- 652020 or later
- 6102010 to 2019
- 2142000 to 2009
- 3791990 to 1999
- 2381980 to 1989
- 5391970 to 1979
- 4431960 to 1969
- 3741950 to 1959
- 2141940 to 1949
- 4,0921939 or earlier
City-data.com crime index for city in 2020 (higher means more crime):
| City: | 198.8 |
| U.S. average: | 219.5 |
Travel time to work (commute)
![Travel time to work (commute)]()
- 50Less than 5 minutes
- 525 to 9 minutes
- 34710 to 14 minutes
- 33615 to 19 minutes
- 89720 to 24 minutes
- 31325 to 29 minutes
- 99230 to 34 minutes
- 53335 to 39 minutes
- 72840 to 44 minutes
- 1,81645 to 59 minutes
- 1,10560 to 89 minutes
- 35990 or more minutes

Means of transportation to work
![Means of transportation to work]()
- 23.0%2,003Drove a car alone
- 5.3%465Carpooled
- 2.3%204Bus
- 34.7%3,023Subway or elevated rail
- 10.5%915Long-distance train or commuter rail
- 3.0%262Light rail, streetcar or trolley
- 0.6%55Ferryboat
- 5.1%447Taxi
- 1.0%90Bicycle
- 8.2%711Walked
- 1.5%127Other means
- 22.3%1,945Worked at home

Time leaving home to go to work
![Time leaving home to go to work]()
- 14012:00 a.m. to 4:59 a.m.
- 1365:30 a.m. to 5:59 a.m.
- 4556:00 a.m. to 6:29 a.m.
- 3416:30 a.m. to 6:59 a.m.
- 9037:00 a.m. to 7:29 a.m.
- 8477:30 a.m. to 7:59 a.m.
- 1,6758:00 a.m. to 8:29 a.m.
- 1,3288:30 a.m. to 8:59 a.m.
- 9989:00 a.m. to 9:59 a.m.
- 13510:00 a.m. to 10:59 a.m.
- 21811:00 a.m. to 11:59 a.m.
- 19412:00 p.m. to 3:59 p.m.
- 1624:00 p.m. to 11:59 p.m.

Occupations of males:
- Percentage of males in management occupations (except farmers):
Here: 20.1% city: 12.9%
- Percentage of males in business and financial operations occupations:
Here: 11.2% city: 9.9%
- Percentage of males in computer and mathematical occupations:
Here: 9.1% city: 13.5%
- Percentage of males in architecture and engineering occupations:
Here: 2.0% city: 3.7%
- Percentage of males in legal occupations:
Here: 2.8% city: 1.8%
- Percentage of males in education, training, and library occupations:
Here: 10.0% city: 3.6%
- Percentage of males in arts, design, entertainment, sports, and media occupations:
Here: 14.4% city: 3.5%
- Percentage of males in healthcare practitioners and technical occupations:
Here: 1.0% city: 2.6%
- Percentage of males in service occupations:
Here: 5.0% city: 10.4%
- Percentage of males in sales and office occupations:
Here: 18.1% city: 13.4%
- Percentage of males in construction, extraction, and maintenance occupations:
Here: 1.5% city: 5.6%
- Percentage of males in transportation occupations:
Here: 2.2% city: 7.2%
- Percentage of males in material moving occupations:
Here: 1.4% city: 4.2%
Occupations of females:
- Percentage of females in management occupations (except farmers):
Here: 16.6% city: 11.5%
- Percentage of females in business and financial operations occupations:
Here: 10.4% city: 11.7%
- Percentage of females in computer and mathematical occupations:
Here: 4.7% city: 5.3%
- Percentage of females in architecture and engineering occupations:
Here: 2.0% city: 1.1%
- Percentage of females in life, physical, and social science occupations:
Here: 2.7% city: 1.1%
- Percentage of females in legal occupations:
Here: 5.2% city: 2.6%
- Percentage of females in education, training, and library occupations:
Here: 12.1% city: 8.3%
- Percentage of females in arts, design, entertainment, sports, and media occupations:
Here: 6.9% city: 4.9%
- Percentage of females in healthcare practitioners and technical occupations:
Here: 10.4% city: 6.5%
- Percentage of females in service occupations:
Here: 7.6% city: 17.9%
- Percentage of females in sales and office occupations:
Here: 19.0% city: 21.2%
- Percentage of females in material moving occupations:
Here: 1.6% city: 1.8%
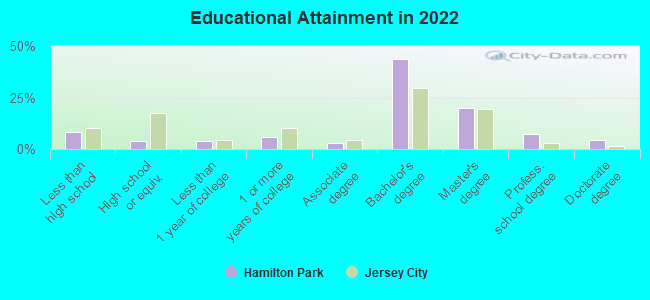
Education in this neighborhood (subdivision or community):
- Percentage of people 3 years and older in K-12 schools:
Hamilton Park: 16.2% Jersey City: 12.9%
- Percentage of people 3 years and older in undergraduate colleges:
Hamilton Park: 5.8% Jersey City: 4.5%
- Percentage of people 3 years and older in grad. or professional schools:
Hamilton Park: 4.0% Jersey City: 2.2%
- Percentage of students K-12 enrolled in private schools:
Hamilton Park: 43.9% Jersey City: 10.8%
Percentage of population below poverty level:
| Hamilton Park: | 4.0% |
| Jersey City: | 12.8% |
Median year owner moved in (as recorded in 2022):
Median year renter moved in (as recorded in 2022):
| Hamilton Park: | 2014 |
| Jersey City: | 2010 |
Median year renter moved in (as recorded in 2022):
| Hamilton Park: | 2017 |
| Jersey City: | 2019 |
Percentage of married-couple families with both working:
| Hamilton Park: | 85.0% |
| Jersey City: | 63.9% |
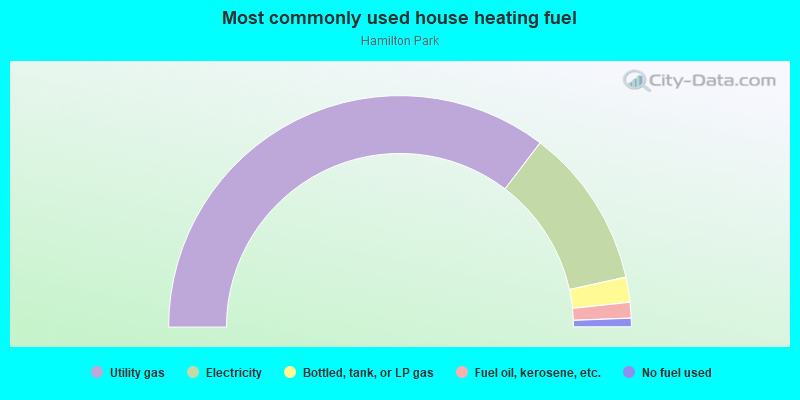
- 70.7%Utility gas
- 22.4%Electricity
- 3.5%Bottled, tank, or LP gas
- 2.2%Fuel oil, kerosene, etc.
- 1.2%No fuel used
Limited-access highways (interstate or state) in this neighborhood:
I- 78
Length: 0.12 miles
Direction: E-W
Direction: E-W
Roads and streets:
9th St
Length: 0.81 miles
Direction: E-W
Address range: 139 to 386
Direction: E-W
Address range: 139 to 386
Co Rd 630 (8th St)
Length: 0.80 miles
Direction: E-W
Address range: 157 to 402
Direction: E-W
Address range: 157 to 402
7th St
Length: 0.80 miles
Direction: E-W
Address range: 143 to 390
Direction: E-W
Address range: 143 to 390
6th St
Length: 0.80 miles
Direction: E-W
Address range: 159 to 384
Direction: E-W
Address range: 159 to 384
5th St
Length: 0.69 miles
Direction: E-W
Address range: 100 to 368
Direction: E-W
Address range: 100 to 368
4th St (Co Rd 628)
Length: 0.69 miles
Direction: E-W
Address range: 101 to 368
Direction: E-W
Address range: 101 to 368
10th St
Length: 0.69 miles
Direction: E-W
Address range: 152 to 357
Direction: E-W
Address range: 152 to 357
3rd St (Co Rd 626)
Length: 0.58 miles
Direction: E-W
Address range: 113 to 325
Direction: E-W
Address range: 113 to 325
Coles St
Length: 0.54 miles
Direction: N-S
Address range: 37 to 199
Direction: N-S
Address range: 37 to 199
Co Rd 633 (Erie St)
Length: 0.49 miles
Direction: N-S
Address range: 39 to 191
Direction: N-S
Address range: 39 to 191
Luis Munoz Marin Blvd (Henderson St)
Length: 0.49 miles
Direction: N-S
Address range: 381 to 538
Direction: N-S
Address range: 381 to 538
2nd St
Length: 0.46 miles
Direction: E-W
Address range: 187 to 322
Direction: E-W
Address range: 187 to 322
Monmouth St
Length: 0.45 miles
Direction: N-S
Address range: 400 to 544
Direction: N-S
Address range: 400 to 544
Co Rd 631 (Jersey Ave)
Length: 0.44 miles
Direction: N-S
Address range: 563 to 742
Direction: N-S
Address range: 563 to 742
Co Rd 635 (Grove St)
Length: 0.43 miles
Direction: N-S
Address range: 501 to 541
Direction: N-S
Address range: 501 to 541
Pavonia Ave
Length: 0.39 miles
Direction: E-W
Address range: 201 to 499
Direction: E-W
Address range: 201 to 499
Co Rd 629 (Brunswick St)
Length: 0.35 miles
Direction: N-S
Address range: 167 to 277
Direction: N-S
Address range: 167 to 277
11th St
Length: 0.23 miles
Direction: E-W
Direction: E-W
12th St
Length: 0.12 miles
Direction: E-W
Address range: 252 to 399
Direction: E-W
Address range: 252 to 399
Greene St
Length: 0.11 miles
Direction: E-W
Direction: E-W
Co Rd 729 (W Hamilton Pl)
Length: 0.10 miles
Direction: N-S
Address range: 1 to 99
Direction: N-S
Address range: 1 to 99
Co Rd 730 (E Hamilton Pl, McWilliams Pl)
Length: 0.10 miles
Direction: N-S
Address range: 1 to 42
Direction: N-S
Address range: 1 to 42
Division St
Length: 0.10 miles
Direction: N-S
Address range: 7 to 99
Direction: N-S
Address range: 7 to 99
Manila Ave (Co Rd 635)
Length: 0.05 miles
Direction: N-S
Address range: 400 to 522
Direction: N-S
Address range: 400 to 522
Railroad features:
Norfolk Southern Rlwy
Length: 0.23 miles
Direction: E-W
Direction: E-W