Grey Gables (Bon Air) neighborhood in Tampa, Florida (FL), 33609 detailed profile
Settings
X


Business Search - 14 Million verified businesses
Area: 0.277 square miles
Population: 2,419
Population density:
| Grey Gables (Bon Air): | 8,723 people per square mile |
| Tampa: | 3,553 people per square mile |

- 1,93675.3%White
- 36814.3%Hispanic or Latino
- 1174.5%Some other race
- 943.7%Asian
- 461.8%Black
- 110.4%Two or more races

Distribution of median household income
![Distribution of median household income]()
- 33Less than $10,000
- 153$10,000 to $19,999
- 124$20,000 to $29,999
- 111$30,000 to $39,999
- 239$40,000 to $49,999
- 95$50,000 to $59,999
- 42$60,000 to $74,999
- 82$75,000 to $99,999
- 80$100,000 to $124,999
- 109$125,000 to $149,999
- 71$150,000 to $199,999
- 444$200,000 or more

Distribution of owner-occupied house/condo value
![Distribution of owner-occupied house/condo value]()
- 3Less than $50,000
- 20$50,000 to $99,999
- 17$100,000 to $149,999
- 35$150,000 to $199,999
- 25$200,000 to $249,999
- 23$250,000 to $299,999
- 193$300,000 to $399,999
- 97$400,000 to $499,999
- 146$500,000 to $749,999
- 72$750,000 to $999,999
- 412$1,000,000 or more

Distribution of rent paid by renters
![Distribution of rent paid by renters]()
- 51$100 to $199
- 156$200 to $299
- 110$300 to $399
- 44$400 to $499
- 90$500 to $599
- 53$700 to $799
- 8$800 to $899
- 180$900 to $999
- 73$1,000 to $1,249
- 148$1,250 to $1,499
- 94$1,500 to $1,999
- 338$2,000 or more

Median rent in 2022:
| Grey Gables (Bon Air): | $2,484 |
| Tampa: | $1,444 |
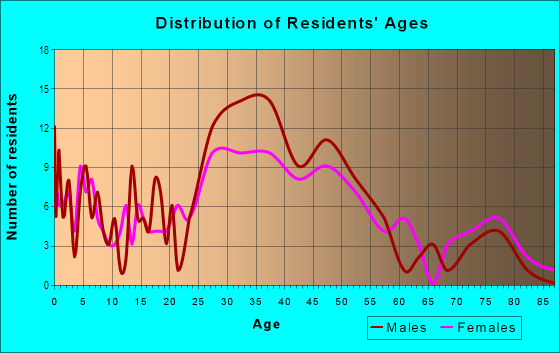
| Males: | 1,445 |
| Females: | 973 |
Males:
| This neighborhood: | 38.1 years |
| Whole city: | 35.5 years |
| This neighborhood: | 38.2 years |
| Whole city: | 35.1 years |
Average household size:
| Grey Gables (Bon Air): | 2.0 people |
| Tampa: | 2.3 people |
Percentage of family households:
| Grey Gables (Bon Air): | 40.7% |
| Tampa: | 39.9% |
| Here: | 41.9% |
| Tampa: | 35.4% |
Percentage of married-couple families with children (among all households):
| Grey Gables (Bon Air): | 35.6% |
| Tampa: | 25.1% |
Percentage of single-mother households (among all households):
| Grey Gables (Bon Air): | 14.8% |
| Tampa: | 12.2% |
Percentage of never married males 15 years old and over:
Percentage of never married females 15 years old and over:
| Grey Gables (Bon Air): | 27.9% |
| Tampa: | 23.6% |
Percentage of never married females 15 years old and over:
| Grey Gables (Bon Air): | 8.6% |
| city: | 20.9% |
Percentage of people that speak English not well or not at all:
| Grey Gables (Bon Air): | 1.5% |
| Tampa: | 6.4% |
Percentage of people born in this state:
Percentage of people born in another U.S. state:
Percentage of native residents but born outside the U.S.:
Percentage of foreign born residents:
| Here: | 36.6% |
| Tampa: | 39.7% |
Percentage of people born in another U.S. state:
| Grey Gables (Bon Air): | 47.8% |
| Tampa: | 35.7% |
Percentage of native residents but born outside the U.S.:
| Here: | 2.8% |
| city: | 4.6% |
Percentage of foreign born residents:
| Here: | 12.8% |
| Tampa: | 20.0% |

Owner-occupied
Renter-occupied


- Rooms in owner-occupied houses and condos in Grey Gables <
> - 41 room
- 02 rooms
- 293 rooms
- 634 rooms
- 1815 rooms
- 276 rooms
- 1577 rooms
- 1188 rooms
- 1839+ rooms

- Rooms in renter-occupied apartments in Grey Gables <
> - 51 room
- 722 rooms
- 1803 rooms
- 1574 rooms
- 675 rooms
- 426 rooms
- 1977 rooms
- 08 rooms
- 49+ rooms
Owner-occupied
Renter-occupied

- Bedrooms in owner-occupied houses and condos in Grey Gables <
> - 28no bedroom
- 131 bedroom
- 1222 bedrooms
- 2283 bedrooms
- 2184 bedrooms
- 965+ bedrooms

- Bedrooms in renter-occupied apartments in Grey Gables <
> - 5no bedroom
- 2931 bedroom
- 1112 bedrooms
- 1473 bedrooms
- 294 bedrooms
- 05+ bedrooms
Average number of cars or other vehicles available in houses/condos:
Average number of cars or other vehicles available in apartments:
| This neighborhood: | 1.8 |
| Tampa: | 1.9 |
Average number of cars or other vehicles available in apartments:
| Here: | 1.4 |
| city: | 1.3 |
Percentage of units with a mortgage:
| Grey Gables (Bon Air): | 75.9% |
| Tampa: | 65.8% |
Average estimated value of detached houses in 2022 (33.2% of all units):
| Grey Gables (Bon Air): | $652,416 |
| Tampa: | $505,567 |

- Year house built in Grey Gables <
> - 852020 or later
- 2032010 to 2019
- 2662000 to 2009
- 2151990 to 1999
- 821980 to 1989
- 1571970 to 1979
- 2021960 to 1969
- 221950 to 1959
- 1021940 to 1949
- 1071939 or earlier

City-data.com crime index for city in 2020 (higher means more crime):
| City: | 212.7 |
| U.S. average: | 219.5 |
Travel time to work (commute)
![Travel time to work (commute)]()
- 33Less than 5 minutes
- 285 to 9 minutes
- 12910 to 14 minutes
- 11615 to 19 minutes
- 6720 to 24 minutes
- 14725 to 29 minutes
- 9630 to 34 minutes
- 1635 to 39 minutes
- 1240 to 44 minutes
- 4445 to 59 minutes
- 1860 to 89 minutes
- 1290 or more minutes

Means of transportation to work
![Means of transportation to work]()
- 68.8%1,047Drove a car alone
- 11.2%170Carpooled
- 5.6%85Bus
- 0.3%4Taxi
- 0.2%3Bicycle
- 4.0%61Walked
- 3.6%55Other means
- 22.7%346Worked at home

Time leaving home to go to work
![Time leaving home to go to work]()
- 2412:00 a.m. to 4:59 a.m.
- 35:30 a.m. to 5:59 a.m.
- 426:00 a.m. to 6:29 a.m.
- 646:30 a.m. to 6:59 a.m.
- 1267:00 a.m. to 7:29 a.m.
- 817:30 a.m. to 7:59 a.m.
- 1768:00 a.m. to 8:29 a.m.
- 618:30 a.m. to 8:59 a.m.
- 499:00 a.m. to 9:59 a.m.
- 1710:00 a.m. to 10:59 a.m.
- 1211:00 a.m. to 11:59 a.m.
- 1012:00 p.m. to 3:59 p.m.
- 164:00 p.m. to 11:59 p.m.

Occupations of males:
- Percentage of males in management occupations (except farmers):
Here: 22.5% city: 14.3%
- Percentage of males in business and financial operations occupations:
Here: 4.4% city: 7.8%
- Percentage of males in computer and mathematical occupations:
Here: 10.0% city: 6.0%
- Percentage of males in architecture and engineering occupations:
Here: 3.0% city: 2.6%
- Percentage of males in life, physical, and social science occupations:
Here: 1.1% city: 0.8%
- Percentage of males in community and social services occupations:
Here: 6.3% city: 0.5%
- Percentage of males in legal occupations:
Here: 10.6% city: 2.8%
- Percentage of males in education, training, and library occupations:
Here: 12.4% city: 2.2%
- Percentage of males in arts, design, entertainment, sports, and media occupations:
Here: 1.1% city: 2.5%
- Percentage of males in service occupations:
Here: 9.1% city: 13.7%
- Percentage of males in sales and office occupations:
Here: 8.6% city: 16.3%
- Percentage of males in farming, fishing, and forestry occupations:
Here: 3.3% city: 0.6%
- Percentage of males in construction, extraction, and maintenance occupations:
Here: 1.9% city: 8.2%
- Percentage of males in production occupations:
Here: 1.8% city: 3.7%
- Percentage of males in transportation occupations:
Here: 2.2% city: 5.8%
Occupations of females:
- Percentage of females in management occupations (except farmers):
Here: 4.4% city: 10.9%
- Percentage of females in business and financial operations occupations:
Here: 7.7% city: 8.5%
- Percentage of females in computer and mathematical occupations:
Here: 5.4% city: 2.4%
- Percentage of females in community and social services occupations:
Here: 2.5% city: 2.1%
- Percentage of females in legal occupations:
Here: 7.5% city: 2.7%
- Percentage of females in education, training, and library occupations:
Here: 3.7% city: 7.2%
- Percentage of females in healthcare practitioners and technical occupations:
Here: 19.1% city: 10.3%
- Percentage of females in service occupations:
Here: 16.2% city: 19.1%
- Percentage of females in sales and office occupations:
Here: 33.1% city: 27.1%
- Percentage of females in material moving occupations:
Here: 2.9% city: 1.4%
Percentage of people 16-64 in Armed Forces:
| Grey Gables (Bon Air): | 4.5% |
| Tampa: | 1.1% |
Education in this neighborhood (subdivision or community):
- Percentage of people 3 years and older in K-12 schools:
Grey Gables (Bon Air): 22.1% Tampa: 14.3%
- Percentage of people 3 years and older in undergraduate colleges:
Grey Gables (Bon Air): 7.7% Tampa: 7.8%
- Percentage of people 3 years and older in grad. or professional schools:
Grey Gables (Bon Air): 3.5% Tampa: 2.0%
- Percentage of students K-12 enrolled in private schools:
Grey Gables (Bon Air): 22.4% Tampa: 12.5%
Percentage of population below poverty level:
| Grey Gables (Bon Air): | 14.3% |
| Tampa: | 16.3% |
Median year owner moved in (as recorded in 2022):
| Grey Gables (Bon Air): | 2011 |
| Tampa: | 2013 |
Percentage of married-couple families with both working:
| Grey Gables (Bon Air): | 82.2% |
| Tampa: | 70.4% |

- 87.3%Electricity
- 7.9%Utility gas
- 3.1%No fuel used
- 1.7%Bottled, tank, or LP gas
Roads and streets:
W Azeele St
Length: 0.71 miles
Direction: E-W
Address range: 3100 to 3699
Direction: E-W
Address range: 3100 to 3699
Henderson Blvd
Length: 0.65 miles
Direction: SW-NE
Address range: 3000 to 3599
Direction: SW-NE
Address range: 3000 to 3599
W Cleveland St
Length: 0.50 miles
Direction: E-W
Address range: 3100 to 3699
Direction: E-W
Address range: 3100 to 3699
S Himes Ave
Length: 0.43 miles
Direction: N-S
Address range: 101 to 649
Direction: N-S
Address range: 101 to 649
S Sterling Ave
Length: 0.43 miles
Direction: N-S
Address range: 100 to 613
Direction: N-S
Address range: 100 to 613
S Gunlock Ave
Length: 0.33 miles
Directions: E-W, N-S, SE-NW, SW-NE
Address range: 100 to 298
Directions: E-W, N-S, SE-NW, SW-NE
Address range: 100 to 298
S Matanzas Ave
Length: 0.23 miles
Direction: N-S
Address range: 100 to 299
Direction: N-S
Address range: 100 to 299
W de Leon St
Length: 0.22 miles
Directions: E-W, SW-NE
Address range: 3450 to 3699
Directions: E-W, SW-NE
Address range: 3450 to 3699
W Gray Ct
Length: 0.22 miles
Directions: E-W, SE-NW, SW-NE
Directions: E-W, SE-NW, SW-NE
S Glen Ave
Length: 0.20 miles
Directions: N-S, SW-NE
Address range: 101 to 220
Directions: N-S, SW-NE
Address range: 101 to 220
S Bradford Ave
Length: 0.17 miles
Directions: N-S, SE-NW
Address range: 112 to 299
Directions: N-S, SE-NW
Address range: 112 to 299
S Macdill Ave
Length: 0.17 miles
Direction: N-S
Address range: 109 to 399
Direction: N-S
Address range: 109 to 399
Gables Ct
Length: 0.17 miles
Directions: E-W, SE-NW
Address range: 3400 to 3499
Directions: E-W, SE-NW
Address range: 3400 to 3499
W Horatio St
Length: 0.15 miles
Directions: E-W, SE-NW
Address range: 3400 to 3499
Directions: E-W, SE-NW
Address range: 3400 to 3499
Horatio St
Length: 0.15 miles
Directions: E-W, SE-NW
Address range: 3600 to 3699
Directions: E-W, SE-NW
Address range: 3600 to 3699
Roland St
Length: 0.14 miles
Direction: E-W
Address range: 3600 to 3699
Direction: E-W
Address range: 3600 to 3699
Dale Ave
Length: 0.14 miles
Direction: E-W
Address range: 3600 to 3699
Direction: E-W
Address range: 3600 to 3699
W Swann Ave
Length: 0.14 miles
Direction: E-W
Address range: 3600 to 3699
Direction: E-W
Address range: 3600 to 3699
W Platt St
Length: 0.14 miles
Direction: E-W
Address range: 3600 to 3699
Direction: E-W
Address range: 3600 to 3699
S Woodlynne Ave
Length: 0.12 miles
Direction: N-S
Address range: 200 to 299
Direction: N-S
Address range: 200 to 299
S Lincoln Ave
Length: 0.12 miles
Direction: N-S
Address range: 200 to 349
Direction: N-S
Address range: 200 to 349
S Beverly Ave
Length: 0.12 miles
Direction: N-S
Address range: 200 to 299
Direction: N-S
Address range: 200 to 299