Greenway Downs neighborhood in Falls Church, Virginia (VA), 22042 detailed profile
Settings
X


Business Search - 14 Million verified businesses
Area: 0.330 square miles
Population: 2,891
Population density:
| Greenway Downs: | 8,755 people per square mile |
| Falls Church: | 7,340 people per square mile |

- 1,54852.8%White
- 86829.6%Hispanic or Latino
- 29610.1%Asian
- 1294.4%Two or more races
- 652.2%Black
- 210.7%Some other race
- 70.2%American Indian

Median household income in 2022:
| Greenway Downs: | $148,757 |
| Falls Church: | $164,536 |
Distribution of median household income
![Distribution of median household income]()
- 29Less than $10,000
- 107$10,000 to $19,999
- 79$20,000 to $29,999
- 44$30,000 to $39,999
- 119$40,000 to $49,999
- 124$50,000 to $59,999
- 23$60,000 to $74,999
- 107$75,000 to $99,999
- 115$100,000 to $124,999
- 96$125,000 to $149,999
- 191$150,000 to $199,999
- 349$200,000 or more

Distribution of owner-occupied house/condo value
![Distribution of owner-occupied house/condo value]()
- 32$50,000 to $99,999
- 29$150,000 to $199,999
- 9$200,000 to $249,999
- 51$250,000 to $299,999
- 13$300,000 to $399,999
- 33$400,000 to $499,999
- 412$500,000 to $749,999
- 258$750,000 to $999,999
- 141$1,000,000 or more

Distribution of rent paid by renters
![Distribution of rent paid by renters]()
- 168$100 to $199
- 18$200 to $299
- 136$300 to $399
- 38$400 to $499
- 7$500 to $599
- 4$600 to $699
- 4$700 to $799
- 4$900 to $999
- 60$1,000 to $1,249
- 27$1,250 to $1,499
- 47$1,500 to $1,999
- 225$2,000 or more

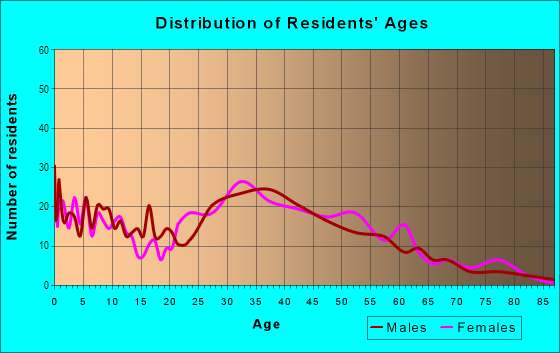
| Males: | 1,444 |
| Females: | 1,447 |
Males:
| This neighborhood: | 33.6 years |
| Whole city: | 36.7 years |
| This neighborhood: | 37.8 years |
| Whole city: | 41.5 years |
Average household size:
| Greenway Downs: | 7.9 people |
| Falls Church: | 2.5 people |
Percentage of family households:
| Greenway Downs: | 59.1% |
| Falls Church: | 46.0% |
| Here: | 60.1% |
| Falls Church: | 51.5% |
Percentage of married-couple families with children (among all households):
| Greenway Downs: | 26.8% |
| Falls Church: | 33.1% |
Percentage of single-mother households (among all households):
| Greenway Downs: | 2.8% |
| Falls Church: | 4.7% |
Percentage of never married males 15 years old and over:
Percentage of never married females 15 years old and over:
| Greenway Downs: | 16.7% |
| Falls Church: | 17.9% |
Percentage of never married females 15 years old and over:
| Greenway Downs: | 14.1% |
| city: | 16.2% |
Percentage of people that speak English not well or not at all:
| Greenway Downs: | 13.2% |
| Falls Church: | 2.2% |
Percentage of people born in this state:
Percentage of people born in another U.S. state:
Percentage of native residents but born outside the U.S.:
Percentage of foreign born residents:
| Here: | 24.1% |
| Falls Church: | 26.5% |
Percentage of people born in another U.S. state:
| Greenway Downs: | 38.7% |
| Falls Church: | 54.2% |
Percentage of native residents but born outside the U.S.:
| Here: | 1.5% |
| city: | 3.7% |
Percentage of foreign born residents:
| Here: | 35.6% |
| Falls Church: | 15.5% |

Owner-occupied
Renter-occupied


- Rooms in owner-occupied houses and condos in Greenway Downs
- 01 room
- 02 rooms
- 13 rooms
- 114 rooms
- 565 rooms
- 1916 rooms
- 1327 rooms
- 1568 rooms
- 2239+ rooms

- Rooms in renter-occupied apartments in Greenway Downs
- 221 room
- 772 rooms
- 1643 rooms
- 874 rooms
- 545 rooms
- 266 rooms
- 637 rooms
- 98 rooms
- 299+ rooms
Owner-occupied
Renter-occupied

- Bedrooms in owner-occupied houses and condos in Greenway Downs
- 0no bedroom
- 71 bedroom
- 232 bedrooms
- 3053 bedrooms
- 3234 bedrooms
- 995+ bedrooms

- Bedrooms in renter-occupied apartments in Greenway Downs
- 22no bedroom
- 1431 bedroom
- 1552 bedrooms
- 393 bedrooms
- 214 bedrooms
- 1255+ bedrooms
Average number of cars or other vehicles available in houses/condos:
Average number of cars or other vehicles available in apartments:
| This neighborhood: | 2.0 |
| Falls Church: | 1.9 |
Average number of cars or other vehicles available in apartments:
| Here: | 1.5 |
| city: | 1.4 |
Percentage of units with a mortgage:
| Greenway Downs: | 86.1% |
| Falls Church: | 70.0% |
Average estimated value of detached houses in 2022 (75.7% of all units):
| Greenway Downs: | $700,287 |
| Virginia: | $472,865 |

- Year house built in Greenway Downs
- 52020 or later
- 1472010 to 2019
- 1642000 to 2009
- 231990 to 1999
- 321980 to 1989
- 851970 to 1979
- 951960 to 1969
- 1171950 to 1959
- 4341940 to 1949
- 571939 or earlier

City-data.com crime index for city in 2020 (higher means more crime):
| City: | 120.0 |
| U.S. average: | 219.5 |
Travel time to work (commute)
![Travel time to work (commute)]()
- 32Less than 5 minutes
- 495 to 9 minutes
- 7710 to 14 minutes
- 15515 to 19 minutes
- 10020 to 24 minutes
- 5525 to 29 minutes
- 10130 to 34 minutes
- 2135 to 39 minutes
- 7540 to 44 minutes
- 25545 to 59 minutes
- 10660 to 89 minutes
- 3790 or more minutes

Means of transportation to work
![Means of transportation to work]()
- 58.8%925Drove a car alone
- 8.3%131Carpooled
- 3.3%52Bus
- 5.2%82Subway or elevated rail
- 1.5%23Long-distance train or commuter rail
- 1.3%20Motorcycle
- 0.5%8Bicycle
- 3.2%51Walked
- 5.9%93Other means
- 21.4%337Worked at home

Time leaving home to go to work
![Time leaving home to go to work]()
- 3312:00 a.m. to 4:59 a.m.
- 365:00 a.m. to 5:29 a.m.
- 95:30 a.m. to 5:59 a.m.
- 1136:00 a.m. to 6:29 a.m.
- 646:30 a.m. to 6:59 a.m.
- 1527:00 a.m. to 7:29 a.m.
- 1197:30 a.m. to 7:59 a.m.
- 1088:00 a.m. to 8:29 a.m.
- 558:30 a.m. to 8:59 a.m.
- 1239:00 a.m. to 9:59 a.m.
- 4810:00 a.m. to 10:59 a.m.
- 511:00 a.m. to 11:59 a.m.
- 4312:00 p.m. to 3:59 p.m.
- 404:00 p.m. to 11:59 p.m.

Occupations of males:
- Percentage of males in management occupations (except farmers):
Here: 16.6% city: 24.7%
- Percentage of males in business and financial operations occupations:
Here: 8.8% city: 9.3%
- Percentage of males in computer and mathematical occupations:
Here: 10.5% city: 15.0%
- Percentage of males in architecture and engineering occupations:
Here: 2.6% city: 3.6%
- Percentage of males in legal occupations:
Here: 5.0% city: 6.6%
- Percentage of males in arts, design, entertainment, sports, and media occupations:
Here: 5.2% city: 2.1%
- Percentage of males in service occupations:
Here: 9.2% city: 7.4%
- Percentage of males in sales and office occupations:
Here: 8.8% city: 12.4%
- Percentage of males in construction, extraction, and maintenance occupations:
Here: 19.2% city: 4.0%
- Percentage of males in transportation occupations:
Here: 10.1% city: 0.5%
Occupations of females:
- Percentage of females in management occupations (except farmers):
Here: 18.6% city: 15.1%
- Percentage of females in business and financial operations occupations:
Here: 15.4% city: 14.3%
- Percentage of females in computer and mathematical occupations:
Here: 6.1% city: 8.7%
- Percentage of females in life, physical, and social science occupations:
Here: 2.7% city: 2.7%
- Percentage of females in community and social services occupations:
Here: 3.1% city: 1.9%
- Percentage of females in legal occupations:
Here: 4.5% city: 4.6%
- Percentage of females in education, training, and library occupations:
Here: 12.8% city: 10.6%
- Percentage of females in arts, design, entertainment, sports, and media occupations:
Here: 5.1% city: 3.0%
- Percentage of females in healthcare practitioners and technical occupations:
Here: 3.7% city: 9.4%
- Percentage of females in service occupations:
Here: 13.3% city: 12.6%
- Percentage of females in sales and office occupations:
Here: 8.9% city: 15.9%
- Percentage of females in construction, extraction, and maintenance occupations:
Here: 1.4% city: 0.0%
- Percentage of females in material moving occupations:
Here: 5.6% city: 0.5%
Percentage of people 16-64 in Armed Forces:
| Greenway Downs: | 0.3% |
| Falls Church: | 1.3% |
Education in this neighborhood (subdivision or community):
- Percentage of people 3 years and older in K-12 schools:
Greenway Downs: 16.4% Falls Church: 21.3%
- Percentage of people 3 years and older in undergraduate colleges:
Greenway Downs: 5.6% Falls Church: 4.5%
- Percentage of people 3 years and older in grad. or professional schools:
Greenway Downs: 2.5% Falls Church: 2.0%
- Percentage of students K-12 enrolled in private schools:
Greenway Downs: 29.8% Falls Church: 11.0%
Percentage of population below poverty level:
| Greenway Downs: | 8.0% |
| Falls Church: | 2.3% |
Median year owner moved in (as recorded in 2022):
Median year renter moved in (as recorded in 2022):
| Greenway Downs: | 2007 |
| Falls Church: | 2010 |
Median year renter moved in (as recorded in 2022):
| Greenway Downs: | 2017 |
| Falls Church: | 2018 |
Percentage of married-couple families with both working:
| Greenway Downs: | 86.5% |
| Falls Church: | 77.3% |

- 48.7%Utility gas
- 36.5%Electricity
- 5.2%No fuel used
- 3.5%Fuel oil, kerosene, etc.
- 3.3%Bottled, tank, or LP gas
- 1.7%Other fuel
- 1.1%Solar energy
Highways in this neighborhood:
Annandale Rd (State Rte 649)
Length: 0.30 miles
Directions: N-S, SW-NE
Address range: 2700 to 2852
Directions: N-S, SW-NE
Address range: 2700 to 2852
State Rte 237 (US Hwy 29, Lee Hwy)
Length: 0.15 miles
Direction: E-W
Address range: 1000 to 7271
Direction: E-W
Address range: 1000 to 7271
Roads and streets:
Custis Pkwy
Length: 1.01 miles
Directions: E-W, N-S, SE-NW, SW-NE
Address range: 6801 to 6999
Directions: E-W, N-S, SE-NW, SW-NE
Address range: 6801 to 6999
Cavalier Trl
Length: 0.43 miles
Directions: E-W, SW-NE
Address range: 6805 to 6999
Directions: E-W, SW-NE
Address range: 6805 to 6999
W George Mason Rd
Length: 0.34 miles
Direction: N-S
Address range: 2700 to 2872
Direction: N-S
Address range: 2700 to 2872
Marshall St
Length: 0.33 miles
Direction: N-S
Address range: 2700 to 2859
Direction: N-S
Address range: 2700 to 2859
Winchester Way
Length: 0.28 miles
Directions: N-S, SE-NW
Address range: 2700 to 2899
Directions: N-S, SE-NW
Address range: 2700 to 2899
Summerfield Rd
Length: 0.26 miles
Direction: N-S
Address range: 2800 to 2844
Direction: N-S
Address range: 2800 to 2844
Bolling Rd
Length: 0.24 miles
Directions: E-W, N-S, SE-NW
Address range: 2800 to 2899
Directions: E-W, N-S, SE-NW
Address range: 2800 to 2899
Cameron Rd
Length: 0.23 miles
Direction: N-S
Address range: 2803 to 2899
Direction: N-S
Address range: 2803 to 2899
Greenway Blvd
Length: 0.22 miles
Directions: N-S, SE-NW
Address range: 2806 to 2870
Directions: N-S, SE-NW
Address range: 2806 to 2870
Woodlawn Ave
Length: 0.19 miles
Direction: N-S
Address range: 2814 to 2899
Direction: N-S
Address range: 2814 to 2899
Monroe St
Length: 0.18 miles
Directions: N-S, SE-NW
Address range: 2800 to 2899
Directions: N-S, SE-NW
Address range: 2800 to 2899
James Lee St
Length: 0.17 miles
Direction: E-W
Address range: 6600 to 6799
Direction: E-W
Address range: 6600 to 6799
Poplar St
Length: 0.14 miles
Directions: E-W, SE-NW
Address range: 6700 to 6721
Directions: E-W, SE-NW
Address range: 6700 to 6721
Great Oak Ct
Length: 0.11 miles
Directions: E-W, N-S, SW-NE
Address range: 2836 to 2885
Directions: E-W, N-S, SW-NE
Address range: 2836 to 2885
Raymond Ct
Length: 0.10 miles
Directions: E-W, N-S, SE-NW, SW-NE
Address range: 2800 to 2899
Directions: E-W, N-S, SE-NW, SW-NE
Address range: 2800 to 2899
Rosemary Ln
Length: 0.09 miles
Directions: N-S, SW-NE
Directions: N-S, SW-NE
Scipio Ln
Length: 0.09 miles
Directions: E-W, SW-NE
Address range: 6700 to 6799
Directions: E-W, SW-NE
Address range: 6700 to 6799
Prince Albert Ct
Length: 0.05 miles
Direction: SW-NE
Direction: SW-NE
Goodwin Ct
Length: 0.05 miles
Direction: N-S
Address range: 2700 to 2799
Direction: N-S
Address range: 2700 to 2799
Tinner Hill Rd
Length: 0.05 miles
Directions: N-S, SE-NW
Address range: 100 to 199
Directions: N-S, SE-NW
Address range: 100 to 199
Other features:
Tripps Run
Length: 0.08 miles
Direction: N-S
Direction: N-S
Highways in this neighborhood:
US Hwy 29 (State Rte 237, Lee Hwy)
Length: 0.15 miles
Direction: E-W
Address range: 1000 to 7271
Direction: E-W
Address range: 1000 to 7271
US Hwy 29 (State Rte 237, S Washington St)
Length: 0.11 miles
Direction: E-W
Address range: 401 to 545
Direction: E-W
Address range: 401 to 545
Roads and streets:
State Rte 649 (E Annandale Rd)
Length: 0.06 miles
Direction: N-S
Address range: 300 to 399
Direction: N-S
Address range: 300 to 399
Tinners Hill St
Length: 0.04 miles
Directions: N-S, SE-NW
Address range: 115 to 187
Directions: N-S, SE-NW
Address range: 115 to 187