Green Acres neighborhood in Newport News, Virginia (VA), 23608 detailed profile
Settings
X


Business Search - 14 Million verified businesses
Area: 0.169 square miles
Population: 344
Population density:
| Green Acres: | 2,040 people per square mile |
| Newport News: | 2,699 people per square mile |

- 15244.4%Black
- 12636.8%White
- 247.0%Hispanic or Latino
- 195.6%Two or more races
- 133.8%American Indian
- 61.8%Asian
- 20.6%Native Hawaiian and Other
Pacific Islander

Median household income in 2022:
| Green Acres: | $71,800 |
| Newport News: | $64,102 |
Distribution of median household income
![Distribution of median household income]()
- 3Less than $10,000
- 18$10,000 to $19,999
- 20$20,000 to $29,999
- 17$30,000 to $39,999
- 8$40,000 to $49,999
- 27$50,000 to $59,999
- 40$60,000 to $74,999
- 30$75,000 to $99,999
- 10$100,000 to $124,999
- 11$125,000 to $149,999
- 7$150,000 to $199,999
- 3$200,000 or more

Distribution of owner-occupied house/condo value
![Distribution of owner-occupied house/condo value]()
- 6$100,000 to $149,999
- 6$150,000 to $199,999
- 4$200,000 to $249,999
- 10$250,000 to $299,999
- 8$300,000 to $399,999
- 5$400,000 to $499,999
- 5$500,000 to $749,999
- 2$1,000,000 or more

Distribution of rent paid by renters
![Distribution of rent paid by renters]()
- 1$100 to $199
- 3$300 to $399
- 34$800 to $899
- 39$900 to $999
- 86$1,000 to $1,249
- 3$1,250 to $1,499
- 7$1,500 to $1,999
- 3$2,000 or more

Median rent in 2022:
| Green Acres: | $1,024 |
| Newport News: | $1,013 |
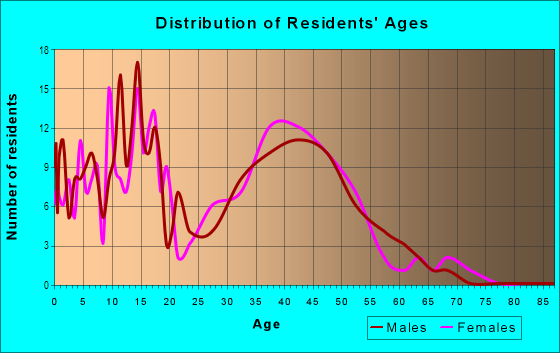
| Males: | 183 |
| Females: | 160 |
Males:
| This neighborhood: | 22.6 years |
| Whole city: | 32.8 years |
| This neighborhood: | 44.1 years |
| Whole city: | 35.9 years |
Average household size:
| Green Acres: | 1.9 people |
| Newport News: | 2.4 people |
Percentage of family households:
| Green Acres: | 16.7% |
| Newport News: | 43.1% |
| Here: | 18.4% |
| Newport News: | 36.0% |
Percentage of married-couple families with children (among all households):
| Green Acres: | 40.9% |
| Newport News: | 23.0% |
Percentage of single-mother households (among all households):
| Green Acres: | 11.8% |
| Newport News: | 14.6% |
Percentage of never married males 15 years old and over:
Percentage of never married females 15 years old and over:
| Green Acres: | 39.4% |
| Newport News: | 21.4% |
Percentage of never married females 15 years old and over:
| Green Acres: | 26.6% |
| city: | 19.2% |
Percentage of people born in this state:
Percentage of people born in another U.S. state:
Percentage of native residents but born outside the U.S.:
Percentage of foreign born residents:
| Here: | 41.6% |
| Newport News: | 52.5% |
Percentage of people born in another U.S. state:
| Green Acres: | 49.3% |
| Newport News: | 36.1% |
Percentage of native residents but born outside the U.S.:
| Here: | 1.0% |
| city: | 3.4% |
Percentage of foreign born residents:
| Here: | 8.0% |
| Newport News: | 8.1% |

Owner-occupied
Renter-occupied


- Rooms in owner-occupied houses and condos in Green Acres
- 01 room
- 02 rooms
- 03 rooms
- 104 rooms
- 85 rooms
- 76 rooms
- 37 rooms
- 28 rooms
- 59+ rooms

- Rooms in renter-occupied apartments in Green Acres
- 331 room
- 112 rooms
- 293 rooms
- 304 rooms
- 415 rooms
- 86 rooms
- 27 rooms
- 48 rooms
- 19+ rooms
Owner-occupied
Renter-occupied

- Bedrooms in owner-occupied houses and condos in Green Acres
- 0no bedroom
- 01 bedroom
- 112 bedrooms
- 183 bedrooms
- 34 bedrooms
- 75+ bedrooms

- Bedrooms in renter-occupied apartments in Green Acres
- 33no bedroom
- 521 bedroom
- 362 bedrooms
- 313 bedrooms
- 44 bedrooms
- 15+ bedrooms
Average number of cars or other vehicles available in houses/condos:
Average number of cars or other vehicles available in apartments:
| This neighborhood: | 2.5 |
| Newport News: | 2.1 |
Average number of cars or other vehicles available in apartments:
| Here: | 1.8 |
| city: | 1.3 |
Percentage of units with a mortgage:
| Green Acres: | 84.9% |
| Newport News: | 70.0% |
Housing prices:
- Average estimated value of detached houses in 2022 (18.0% of all units):
Green Acres: $282,648 Newport News: $282,487
- Average estimated value of townhouses or other attached units in 2022 (3.6% of all units):
This neighborhood: $140,369 city: $199,670

- Year house built in Green Acres
- 02020 or later
- 122010 to 2019
- 82000 to 2009
- 621990 to 1999
- 221980 to 1989
- 821970 to 1979
- 191960 to 1969
- 121950 to 1959
- 01940 to 1949
- 01939 or earlier

City-data.com crime index for city in 2020 (higher means more crime):
| City: | 274.6 |
| U.S. average: | 219.5 |
Travel time to work (commute)
![Travel time to work (commute)]()
- 2Less than 5 minutes
- 35 to 9 minutes
- 1510 to 14 minutes
- 4415 to 19 minutes
- 3320 to 24 minutes
- 1325 to 29 minutes
- 5730 to 34 minutes
- 335 to 39 minutes
- 1140 to 44 minutes
- 145 to 59 minutes
- 2560 to 89 minutes

Means of transportation to work
![Means of transportation to work]()
- 82.0%230Drove a car alone
- 8.9%25Carpooled
- 3.2%9Bus
- 0.7%2Walked
- 1.4%4Other means
- 5.3%15Worked at home

Time leaving home to go to work
![Time leaving home to go to work]()
- 912:00 a.m. to 4:59 a.m.
- 385:00 a.m. to 5:29 a.m.
- 85:30 a.m. to 5:59 a.m.
- 346:00 a.m. to 6:29 a.m.
- 156:30 a.m. to 6:59 a.m.
- 257:00 a.m. to 7:29 a.m.
- 277:30 a.m. to 7:59 a.m.
- 108:00 a.m. to 8:29 a.m.
- 118:30 a.m. to 8:59 a.m.
- 59:00 a.m. to 9:59 a.m.
- 210:00 a.m. to 10:59 a.m.
- 2112:00 p.m. to 3:59 p.m.
- 134:00 p.m. to 11:59 p.m.

Occupations of males:
- Percentage of males in management occupations (except farmers):
Here: 2.4% city: 8.6%
- Percentage of males in business and financial operations occupations:
Here: 3.4% city: 3.5%
- Percentage of males in computer and mathematical occupations:
Here: 2.4% city: 5.6%
- Percentage of males in architecture and engineering occupations:
Here: 2.4% city: 4.7%
- Percentage of males in community and social services occupations:
Here: 4.4% city: 1.4%
- Percentage of males in education, training, and library occupations:
Here: 7.9% city: 2.9%
- Percentage of males in service occupations:
Here: 16.0% city: 15.8%
- Percentage of males in sales and office occupations:
Here: 17.0% city: 13.9%
- Percentage of males in construction, extraction, and maintenance occupations:
Here: 9.2% city: 10.8%
- Percentage of males in production occupations:
Here: 21.7% city: 9.7%
- Percentage of males in transportation occupations:
Here: 5.1% city: 6.0%
- Percentage of males in material moving occupations:
Here: 9.2% city: 7.0%
Occupations of females:
- Percentage of females in management occupations (except farmers):
Here: 13.1% city: 8.1%
- Percentage of females in business and financial operations occupations:
Here: 2.4% city: 4.7%
- Percentage of females in computer and mathematical occupations:
Here: 2.5% city: 2.2%
- Percentage of females in life, physical, and social science occupations:
Here: 2.1% city: 0.7%
- Percentage of females in community and social services occupations:
Here: 20.4% city: 3.9%
- Percentage of females in education, training, and library occupations:
Here: 7.7% city: 8.8%
- Percentage of females in healthcare practitioners and technical occupations:
Here: 3.5% city: 7.8%
- Percentage of females in service occupations:
Here: 11.4% city: 22.8%
- Percentage of females in sales and office occupations:
Here: 20.0% city: 27.1%
- Percentage of females in production occupations:
Here: 6.7% city: 4.7%
- Percentage of females in transportation occupations:
Here: 11.0% city: 1.3%
- Percentage of females in material moving occupations:
Here: 1.7% city: 2.5%
Education in this neighborhood (subdivision or community):
- Percentage of people 3 years and older in K-12 schools:
Green Acres: 10.2% Newport News: 17.3%
- Percentage of people 3 years and older in undergraduate colleges:
Green Acres: 5.5% Newport News: 5.4%
- Percentage of people 3 years and older in grad. or professional schools:
Green Acres: 4.1% Newport News: 1.6%
- Percentage of students K-12 enrolled in private schools:
Green Acres: 14.3% Newport News: 9.9%
Percentage of population below poverty level:
| Green Acres: | 5.9% |
| Newport News: | 16.9% |
Median year owner moved in (as recorded in 2022):
Median year renter moved in (as recorded in 2022):
| Green Acres: | 1995 |
| Newport News: | 2009 |
Median year renter moved in (as recorded in 2022):
| Green Acres: | 2019 |
| Newport News: | 2020 |
Percentage of married-couple families with both working:
| Green Acres: | 100.0% |
| Newport News: | 67.5% |

- 93.5%Electricity
- 2.2%Utility gas
- 1.7%Fuel oil, kerosene, etc.
- 1.6%No fuel used
- 1.0%Bottled, tank, or LP gas
Roads and streets:
Chowan Pl
Length: 0.36 miles
Directions: E-W, N-S, SW-NE
Address range: 405 to 499
Directions: E-W, N-S, SW-NE
Address range: 405 to 499
Woodside Ln
Length: 0.30 miles
Directions: E-W, N-S, SE-NW, SW-NE
Address range: 13000 to 13091
Directions: E-W, N-S, SE-NW, SW-NE
Address range: 13000 to 13091
Red Oak Cir
Length: 0.28 miles
Directions: E-W, N-S, SE-NW, SW-NE
Address range: 900 to 969
Directions: E-W, N-S, SE-NW, SW-NE
Address range: 900 to 969
Aspen Dr
Length: 0.19 miles
Directions: N-S, SE-NW, SW-NE
Address range: 400 to 499
Directions: N-S, SE-NW, SW-NE
Address range: 400 to 499
Oakwood Pl
Length: 0.17 miles
Directions: E-W, N-S, SW-NE
Address range: 400 to 427
Directions: E-W, N-S, SW-NE
Address range: 400 to 427
Cottonwood St
Length: 0.14 miles
Direction: SW-NE
Address range: 401 to 499
Direction: SW-NE
Address range: 401 to 499
Maplewood Ct
Length: 0.04 miles
Directions: E-W, N-S, SE-NW, SW-NE
Address range: 400 to 499
Directions: E-W, N-S, SE-NW, SW-NE
Address range: 400 to 499
Redwood Ct
Length: 0.04 miles
Direction: E-W
Address range: 900 to 999
Direction: E-W
Address range: 900 to 999
Cherrywood Ct
Length: 0.03 miles
Direction: SW-NE
Address range: 400 to 499
Direction: SW-NE
Address range: 400 to 499
Peachwood Ct
Length: 0.03 miles
Direction: SW-NE
Address range: 422 to 440
Direction: SW-NE
Address range: 422 to 440
Orangewood Ct
Length: 0.03 miles
Directions: N-S, SW-NE
Address range: 426 to 438
Directions: N-S, SW-NE
Address range: 426 to 438
Pinewood Ct
Length: 0.03 miles
Direction: SE-NW
Address range: 100 to 113
Direction: SE-NW
Address range: 100 to 113
Hazelwood Ct
Length: 0.02 miles
Direction: SE-NW
Address range: 100 to 199
Direction: SE-NW
Address range: 100 to 199