Grafton Hill neighborhood in Dayton, Ohio (OH), 45405, 45406 detailed profile
Settings
X


Business Search - 14 Million verified businesses
Area: 0.216 square miles
Population: 1,214
Population density:
| Grafton Hill: | 5,621 people per square mile |
| Dayton: | 2,437 people per square mile |

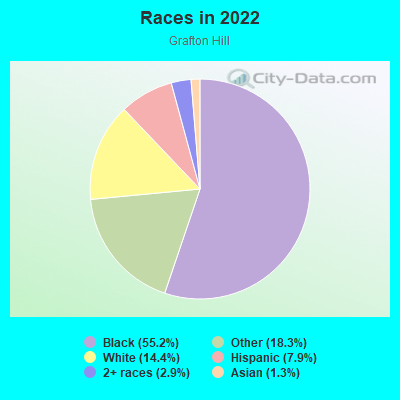
- 75255.2%Black
- 24918.3%Some other race
- 19614.4%White
- 1087.9%Hispanic or Latino
- 402.9%Two or more races
- 181.3%Asian
Distribution of median household income
![Distribution of median household income]()
- 10Less than $10,000
- 130$10,000 to $19,999
- 122$20,000 to $29,999
- 102$30,000 to $39,999
- 74$40,000 to $49,999
- 68$50,000 to $59,999
- 60$60,000 to $74,999
- 23$75,000 to $99,999
- 50$100,000 to $124,999
- 128$125,000 to $149,999
- 36$150,000 to $199,999

Distribution of owner-occupied house/condo value
![Distribution of owner-occupied house/condo value]()
- 283Less than $50,000
- 193$50,000 to $99,999
- 32$100,000 to $149,999
- 34$150,000 to $199,999
- 12$200,000 to $249,999

Distribution of rent paid by renters
![Distribution of rent paid by renters]()
- 150Less than $100
- 10$100 to $199
- 42$200 to $299
- 108$300 to $399
- 30$400 to $499
- 132$500 to $599
- 77$600 to $699
- 120$700 to $799
- 19$800 to $899
- 40$900 to $999
- 22$1,000 to $1,249
- 5$1,250 to $1,499
- 40$1,500 to $1,999
- 8$2,000 or more

Median rent in 2022:
| Grafton Hill: | $779 |
| Dayton: | $612 |
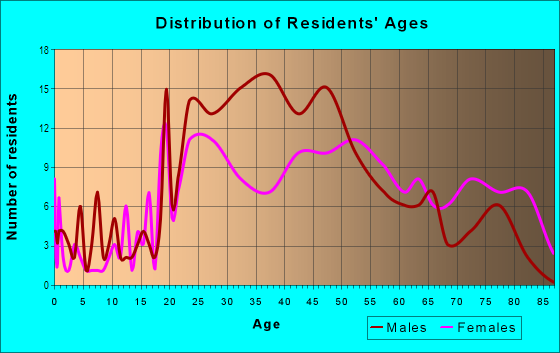
| Males: | 726 |
| Females: | 487 |
Males:
| This neighborhood: | 32.0 years |
| Whole city: | 36.3 years |
| This neighborhood: | 40.9 years |
| Whole city: | 40.2 years |
Average household size:
| Grafton Hill: | 2.4 people |
| Dayton: | 1.9 people |
Percentage of family households:
| Grafton Hill: | 38.6% |
| Dayton: | 32.6% |
| Here: | 7.8% |
| Dayton: | 24.5% |
Percentage of married-couple families with children (among all households):
| Grafton Hill: | 14.0% |
| Dayton: | 19.6% |
Percentage of single-mother households (among all households):
| Grafton Hill: | 30.0% |
| Dayton: | 24.9% |
Percentage of never married males 15 years old and over:
Percentage of never married females 15 years old and over:
| Grafton Hill: | 33.8% |
| Dayton: | 24.8% |
Percentage of never married females 15 years old and over:
| Grafton Hill: | 19.2% |
| city: | 23.3% |
Percentage of people that speak English not well or not at all:
| Grafton Hill: | 0.0% |
| Dayton: | 1.6% |
Percentage of people born in this state:
Percentage of people born in another U.S. state:
Percentage of native residents but born outside the U.S.:
Percentage of foreign born residents:
| Here: | 66.2% |
| Dayton: | 68.0% |
Percentage of people born in another U.S. state:
| Grafton Hill: | 26.1% |
| Dayton: | 26.4% |
Percentage of native residents but born outside the U.S.:
| Here: | 1.0% |
| city: | 1.7% |
Percentage of foreign born residents:
| Here: | 6.8% |
| Dayton: | 3.8% |
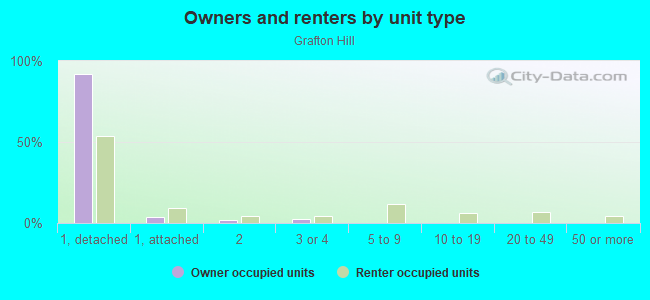
Owner-occupied
Renter-occupied

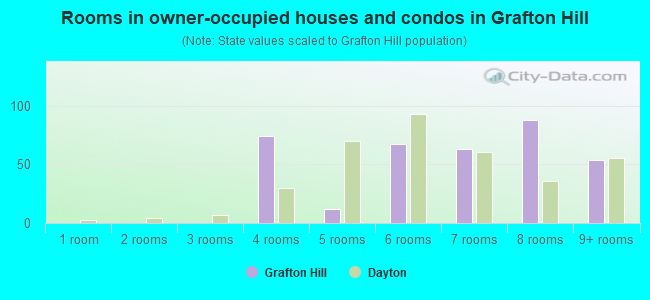
- Rooms in owner-occupied houses and condos in Grafton Hill
- 01 room
- 02 rooms
- 03 rooms
- 744 rooms
- 125 rooms
- 676 rooms
- 637 rooms
- 888 rooms
- 549+ rooms

- Rooms in renter-occupied apartments in Grafton Hill
- 61 room
- 312 rooms
- 1483 rooms
- 634 rooms
- 395 rooms
- 1026 rooms
- 997 rooms
- 318 rooms
- 99+ rooms
Owner-occupied
Renter-occupied
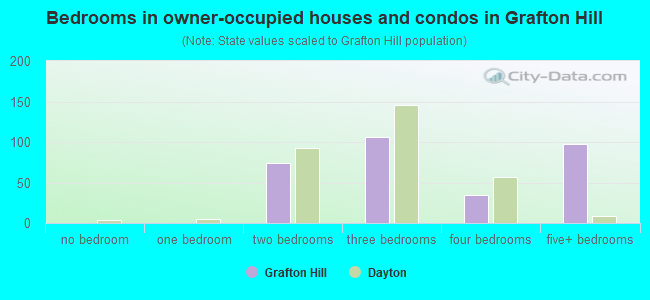
- Bedrooms in owner-occupied houses and condos in Grafton Hill
- 0no bedroom
- 01 bedroom
- 742 bedrooms
- 1063 bedrooms
- 354 bedrooms
- 985+ bedrooms
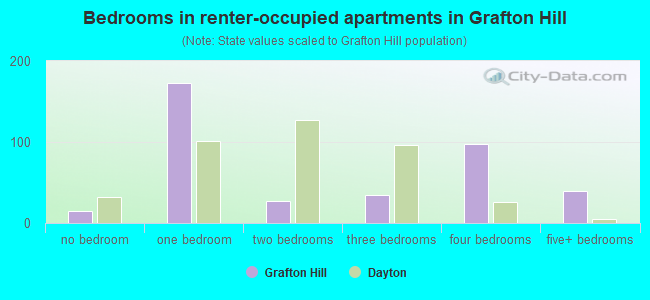
- Bedrooms in renter-occupied apartments in Grafton Hill
- 15no bedroom
- 1731 bedroom
- 272 bedrooms
- 353 bedrooms
- 984 bedrooms
- 395+ bedrooms
Average number of cars or other vehicles available in houses/condos:
Average number of cars or other vehicles available in apartments:
| This neighborhood: | 1.7 |
| Dayton: | 1.8 |
Average number of cars or other vehicles available in apartments:
| Here: | 0.9 |
| city: | 0.9 |
Percentage of units with a mortgage:
| Grafton Hill: | 55.7% |
| Dayton: | 54.7% |
Average estimated value of detached houses in 2022 (68.3% of all units):
| Grafton Hill: | $82,479 |
| Dayton: | $96,843 |
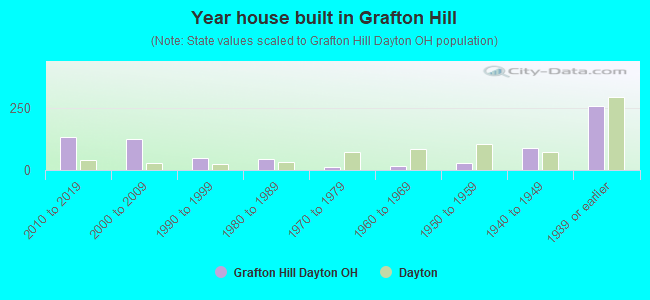
- Year house built in Grafton Hill
- 02020 or later
- 1312010 to 2019
- 1252000 to 2009
- 491990 to 1999
- 431980 to 1989
- 141970 to 1979
- 181960 to 1969
- 291950 to 1959
- 901940 to 1949
- 2581939 or earlier
City-data.com crime index for city in 2020 (higher means more crime):
| City: | 559.8 |
| U.S. average: | 219.5 |
Travel time to work (commute)
![Travel time to work (commute)]()
- 18Less than 5 minutes
- 1475 to 9 minutes
- 11110 to 14 minutes
- 17015 to 19 minutes
- 2720 to 24 minutes
- 2525 to 29 minutes
- 4230 to 34 minutes
- 335 to 39 minutes
- 2945 to 59 minutes
- 1560 to 89 minutes
- 3090 or more minutes

Means of transportation to work
![Means of transportation to work]()
- 43.5%243Drove a car alone
- 10.4%58Carpooled
- 9.1%51Bus
- 0.5%3Bicycle
- 4.8%27Walked
- 2.9%16Other means
- 31.5%176Worked at home

Time leaving home to go to work
![Time leaving home to go to work]()
- 2712:00 a.m. to 4:59 a.m.
- 155:00 a.m. to 5:29 a.m.
- 395:30 a.m. to 5:59 a.m.
- 136:00 a.m. to 6:29 a.m.
- 336:30 a.m. to 6:59 a.m.
- 797:00 a.m. to 7:29 a.m.
- 497:30 a.m. to 7:59 a.m.
- 598:00 a.m. to 8:29 a.m.
- 278:30 a.m. to 8:59 a.m.
- 529:00 a.m. to 9:59 a.m.
- 4410:00 a.m. to 10:59 a.m.
- 611:00 a.m. to 11:59 a.m.
- 5312:00 p.m. to 3:59 p.m.
- 624:00 p.m. to 11:59 p.m.

Occupations of males:
- Percentage of males in management occupations (except farmers):
Here: 1.1% city: 7.5%
- Percentage of males in business and financial operations occupations:
Here: 13.2% city: 2.7%
- Percentage of males in computer and mathematical occupations:
Here: 32.9% city: 3.2%
- Percentage of males in life, physical, and social science occupations:
Here: 38.9% city: 0.9%
- Percentage of males in legal occupations:
Here: 59.8% city: 0.5%
- Percentage of males in education, training, and library occupations:
Here: 113.6% city: 3.4%
- Percentage of males in arts, design, entertainment, sports, and media occupations:
Here: 104.7% city: 2.9%
- Percentage of males in service occupations:
Here: 27.8% city: 18.0%
- Percentage of males in sales and office occupations:
Here: 18.4% city: 14.3%
- Percentage of males in construction, extraction, and maintenance occupations:
Here: 1.2% city: 5.2%
- Percentage of males in production occupations:
Here: 25.3% city: 13.4%
- Percentage of males in transportation occupations:
Here: 8.6% city: 8.0%
Occupations of females:
- Percentage of females in management occupations (except farmers):
Here: 17.6% city: 6.5%
- Percentage of females in business and financial operations occupations:
Here: 10.1% city: 4.8%
- Percentage of females in community and social services occupations:
Here: 1.6% city: 2.8%
- Percentage of females in education, training, and library occupations:
Here: 2.2% city: 7.0%
- Percentage of females in healthcare practitioners and technical occupations:
Here: 6.4% city: 8.6%
- Percentage of females in service occupations:
Here: 20.8% city: 24.7%
- Percentage of females in sales and office occupations:
Here: 35.7% city: 27.9%
- Percentage of females in production occupations:
Here: 5.3% city: 5.9%
- Percentage of females in transportation occupations:
Here: 124.0% city: 1.6%
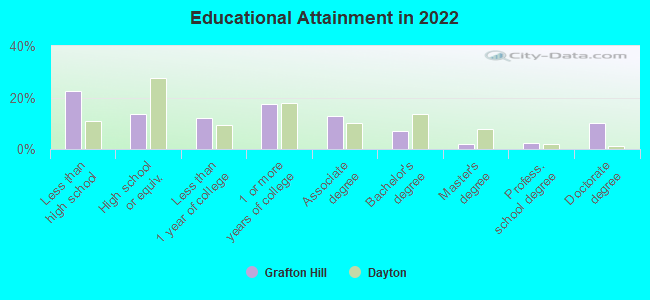
Education in this neighborhood (subdivision or community):
- Percentage of people 3 years and older in K-12 schools:
Grafton Hill: 29.3% Dayton: 12.8%
- Percentage of people 3 years and older in undergraduate colleges:
Grafton Hill: 3.8% Dayton: 11.0%
- Percentage of people 3 years and older in grad. or professional schools:
Grafton Hill: 2.6% Dayton: 1.3%
- Percentage of students K-12 enrolled in private schools:
Grafton Hill: 38.7% Dayton: 31.5%
Percentage of population below poverty level:
| Grafton Hill: | 27.1% |
| Dayton: | 25.4% |
Median year owner moved in (as recorded in 2022):
Median year renter moved in (as recorded in 2022):
| Grafton Hill: | 2002 |
| Dayton: | 2008 |
Median year renter moved in (as recorded in 2022):
| Grafton Hill: | 2013 |
| Dayton: | 2019 |
Percentage of married-couple families with both working:
| Grafton Hill: | 163.5% |
| Dayton: | 65.9% |
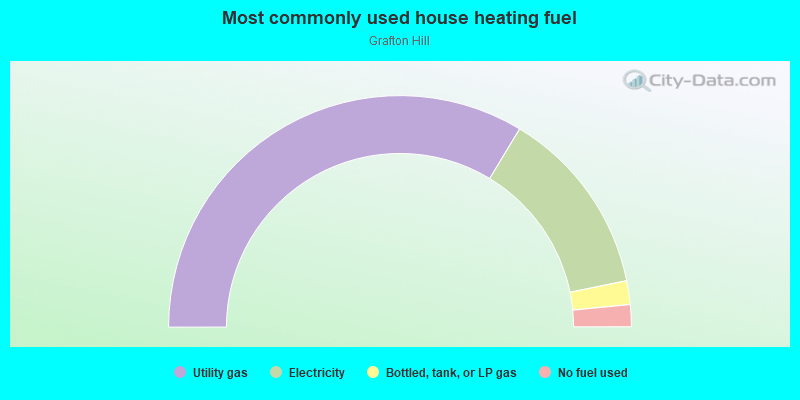
- 67.3%Utility gas
- 26.3%Electricity
- 3.3%Bottled, tank, or LP gas
- 3.1%No fuel used
Limited-access highways (interstate or state) in this neighborhood:
I- 75
Length: 0.25 miles
Direction: N-S
Direction: N-S
Highways in this neighborhood:
State Rte 49 (W Riverview Ave)
Length: 0.54 miles
Directions: E-W, SW-NE
Directions: E-W, SW-NE
Salem Ave (State Rte 49)
Length: 0.10 miles
Direction: SE-NW
Direction: SE-NW
State Rte 49 (W Monument Ave)
Length: 0.08 miles
Directions: E-W, SE-NW
Directions: E-W, SE-NW
Roads and streets:
Central Ave
Length: 0.48 miles
Direction: SE-NW
Address range: 1 to 399
Direction: SE-NW
Address range: 1 to 399
Belmonte Park N
Length: 0.40 miles
Directions: E-W, N-S, SE-NW, SW-NE
Address range: 400 to 599
Directions: E-W, N-S, SE-NW, SW-NE
Address range: 400 to 599
Grafton Ave
Length: 0.37 miles
Directions: N-S, SE-NW
Address range: 1 to 299
Directions: N-S, SE-NW
Address range: 1 to 299
Plymouth Ave
Length: 0.29 miles
Direction: SW-NE
Address range: 600 to 791
Direction: SW-NE
Address range: 600 to 791
Superior Ave
Length: 0.27 miles
Directions: E-W, SW-NE
Address range: 200 to 499
Directions: E-W, SW-NE
Address range: 200 to 499
Forest Ave
Length: 0.26 miles
Directions: E-W, N-S, SE-NW, SW-NE
Address range: 1 to 224
Directions: E-W, N-S, SE-NW, SW-NE
Address range: 1 to 224
Stoddard Ave
Length: 0.21 miles
Directions: E-W, SE-NW, SW-NE
Address range: 1 to 99
Directions: E-W, SE-NW, SW-NE
Address range: 1 to 99
Federal St
Length: 0.17 miles
Direction: SW-NE
Address range: 1 to 151
Direction: SW-NE
Address range: 1 to 151
Palmer St
Length: 0.12 miles
Direction: E-W
Address range: 1 to 99
Direction: E-W
Address range: 1 to 99
Belmonte Park E
Length: 0.09 miles
Directions: E-W, N-S, SW-NE
Address range: 200 to 275
Directions: E-W, N-S, SW-NE
Address range: 200 to 275
E Stoddard Cir
Length: 0.07 miles
Directions: E-W, N-S, SE-NW, SW-NE
Directions: E-W, N-S, SE-NW, SW-NE
W Grand Ave
Length: 0.05 miles
Directions: E-W, SW-NE
Address range: 700 to 771
Directions: E-W, SW-NE
Address range: 700 to 771
Stoddard Cir N
Length: 0.04 miles
Directions: E-W, SE-NW, SW-NE
Directions: E-W, SE-NW, SW-NE