Glenwood-Wilbur neighborhood in Mesa, Arizona (AZ), 85201, 85210 detailed profile
Settings
X


Business Search - 14 Million verified businesses
Area: 0.158 square miles
Population: 355
Population density:
| Glenwood-Wilbur: | 2,246 people per square mile |
| Mesa: | 4,101 people per square mile |

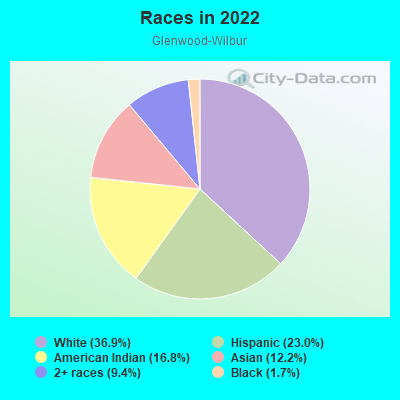
- 17336.9%White
- 10823.0%Hispanic or Latino
- 7916.8%American Indian
- 5712.2%Asian
- 449.4%Two or more races
- 81.7%Black
Median household income in 2022:
| Glenwood-Wilbur: | $42,110 |
| Mesa: | $79,496 |
Distribution of median household income
![Distribution of median household income]()
- 7Less than $10,000
- 13$10,000 to $19,999
- 27$20,000 to $29,999
- 16$30,000 to $39,999
- 74$40,000 to $49,999
- 6$50,000 to $59,999
- 14$60,000 to $74,999
- 25$75,000 to $99,999
- 43$100,000 to $124,999
- 7$125,000 to $149,999
- 6$150,000 to $199,999
- 10$200,000 or more

Distribution of owner-occupied house/condo value
![Distribution of owner-occupied house/condo value]()
- 19Less than $50,000
- 17$50,000 to $99,999
- 3$100,000 to $149,999
- 11$150,000 to $199,999
- 5$200,000 to $249,999
- 6$250,000 to $299,999
- 32$300,000 to $399,999
- 2$400,000 to $499,999
- 1$500,000 to $749,999
- 1$750,000 to $999,999
- 3$1,000,000 or more

Distribution of rent paid by renters
![Distribution of rent paid by renters]()
- 2$100 to $199
- 7$200 to $299
- 8$400 to $499
- 20$500 to $599
- 21$600 to $699
- 13$700 to $799
- 27$800 to $899
- 45$900 to $999
- 40$1,000 to $1,249
- 21$1,250 to $1,499
- 5$1,500 to $1,999
- 5$2,000 or more

Median rent in 2022:
| Glenwood-Wilbur: | $950 |
| Mesa: | $1,335 |
| Males: | 168 |
| Females: | 187 |
Males:
| This neighborhood: | 30.0 years |
| Whole city: | 34.8 years |
| This neighborhood: | 29.3 years |
| Whole city: | 38.9 years |
Average household size:
| Glenwood-Wilbur: | 2.4 people |
| Mesa: | 2.6 people |
Percentage of family households:
| Glenwood-Wilbur: | 43.5% |
| Mesa: | 46.8% |
| Here: | 43.4% |
| Mesa: | 47.2% |
Percentage of married-couple families with children (among all households):
| Glenwood-Wilbur: | 21.0% |
| Mesa: | 25.8% |
Percentage of single-mother households (among all households):
| Glenwood-Wilbur: | 49.3% |
| Mesa: | 7.6% |
Percentage of never married males 15 years old and over:
Percentage of never married females 15 years old and over:
| Glenwood-Wilbur: | 20.8% |
| Mesa: | 18.5% |
Percentage of never married females 15 years old and over:
| Glenwood-Wilbur: | 12.7% |
| city: | 14.8% |
Percentage of people that speak English not well or not at all:
| Glenwood-Wilbur: | 8.2% |
| Mesa: | 3.5% |
Percentage of people born in this state:
Percentage of people born in another U.S. state:
Percentage of native residents but born outside the U.S.:
Percentage of foreign born residents:
| Here: | 29.3% |
| Mesa: | 41.1% |
Percentage of people born in another U.S. state:
| Glenwood-Wilbur: | 56.7% |
| Mesa: | 46.7% |
Percentage of native residents but born outside the U.S.:
| Here: | 0.6% |
| city: | 1.2% |
Percentage of foreign born residents:
| Here: | 13.3% |
| Mesa: | 11.0% |
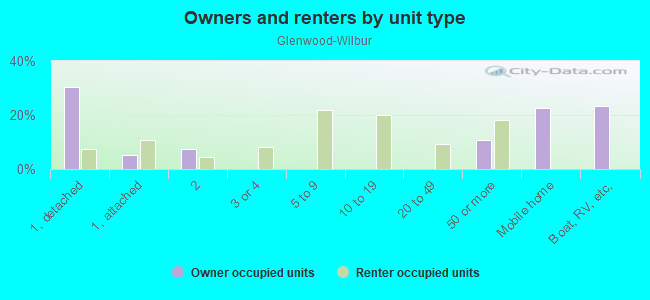
Owner-occupied
Renter-occupied

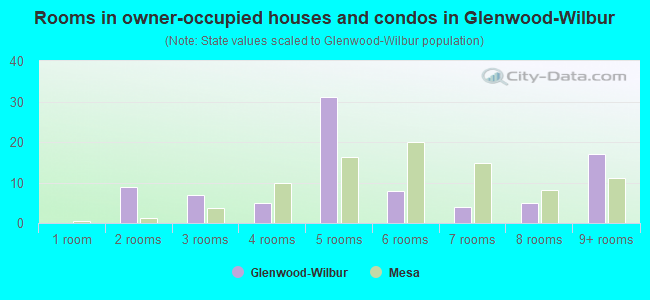
- Rooms in owner-occupied houses and condos in Glenwood-Wilbur
- 01 room
- 92 rooms
- 73 rooms
- 54 rooms
- 315 rooms
- 86 rooms
- 47 rooms
- 58 rooms
- 179+ rooms
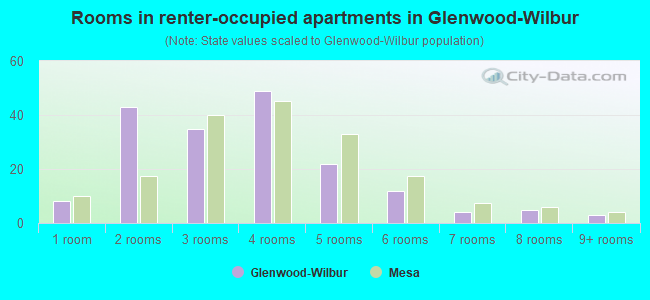
- Rooms in renter-occupied apartments in Glenwood-Wilbur
- 81 room
- 432 rooms
- 353 rooms
- 494 rooms
- 225 rooms
- 126 rooms
- 47 rooms
- 58 rooms
- 39+ rooms
Owner-occupied
Renter-occupied
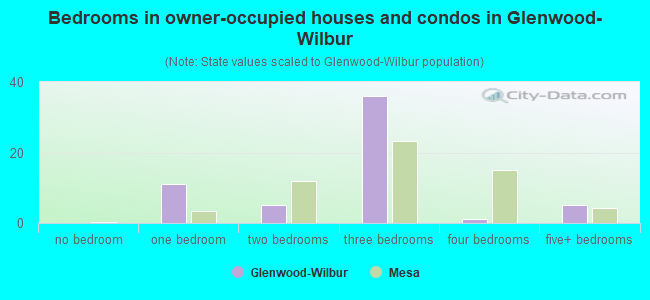
- Bedrooms in owner-occupied houses and condos in Glenwood-Wilbur
- 0no bedroom
- 111 bedroom
- 52 bedrooms
- 363 bedrooms
- 14 bedrooms
- 55+ bedrooms
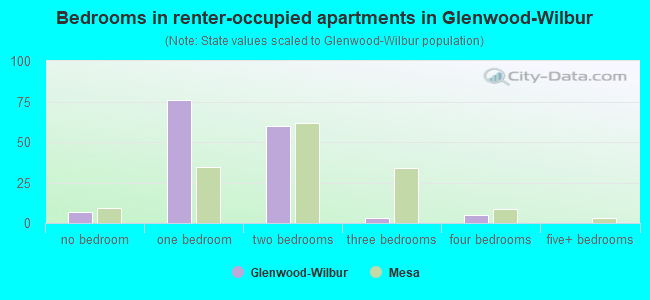
- Bedrooms in renter-occupied apartments in Glenwood-Wilbur
- 7no bedroom
- 761 bedroom
- 602 bedrooms
- 33 bedrooms
- 54 bedrooms
- 05+ bedrooms
Average number of cars or other vehicles available in houses/condos:
Average number of cars or other vehicles available in apartments:
| This neighborhood: | 4.2 |
| Mesa: | 2.1 |
Average number of cars or other vehicles available in apartments:
| Here: | 1.3 |
| city: | 1.6 |
Percentage of units with a mortgage:
| Glenwood-Wilbur: | 62.5% |
| Mesa: | 64.2% |
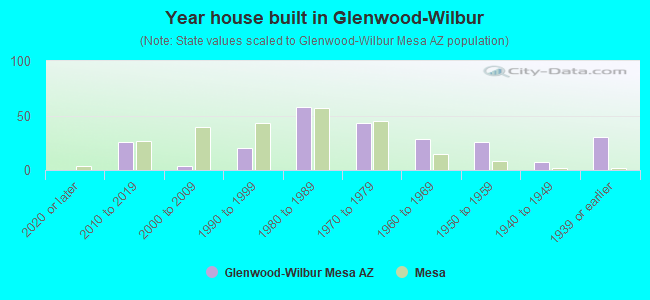
- Year house built in Glenwood-Wilbur
- 02020 or later
- 262010 to 2019
- 42000 to 2009
- 201990 to 1999
- 581980 to 1989
- 431970 to 1979
- 281960 to 1969
- 261950 to 1959
- 71940 to 1949
- 301939 or earlier
City-data.com crime index for city in 2020 (higher means more crime):
| City: | 205.4 |
| U.S. average: | 219.5 |
Travel time to work (commute)
![Travel time to work (commute)]()
- 3Less than 5 minutes
- 105 to 9 minutes
- 1510 to 14 minutes
- 2015 to 19 minutes
- 2520 to 24 minutes
- 1225 to 29 minutes
- 1130 to 34 minutes
- 535 to 39 minutes
- 440 to 44 minutes
- 1045 to 59 minutes
- 1060 to 89 minutes
- 190 or more minutes

Means of transportation to work
![Means of transportation to work]()
- 60.4%115Drove a car alone
- 4.2%8Carpooled
- 3.7%7Bus
- 1.1%2Long-distance train or commuter rail
- 6.3%12Light rail, streetcar or trolley
- 12.1%23Motorcycle
- 2.6%5Bicycle
- 6.8%13Walked
- 0.5%1Other means
- 24.2%46Worked at home

Time leaving home to go to work
![Time leaving home to go to work]()
- 512:00 a.m. to 4:59 a.m.
- 75:00 a.m. to 5:29 a.m.
- 25:30 a.m. to 5:59 a.m.
- 66:00 a.m. to 6:29 a.m.
- 56:30 a.m. to 6:59 a.m.
- 207:00 a.m. to 7:29 a.m.
- 107:30 a.m. to 7:59 a.m.
- 158:00 a.m. to 8:29 a.m.
- 28:30 a.m. to 8:59 a.m.
- 129:00 a.m. to 9:59 a.m.
- 410:00 a.m. to 10:59 a.m.
- 611:00 a.m. to 11:59 a.m.
- 1912:00 p.m. to 3:59 p.m.
- 114:00 p.m. to 11:59 p.m.

Occupations of males:
- Percentage of males in management occupations (except farmers):
Here: 4.0% city: 10.7%
- Percentage of males in business and financial operations occupations:
Here: 3.5% city: 6.4%
- Percentage of males in computer and mathematical occupations:
Here: 2.1% city: 5.3%
- Percentage of males in architecture and engineering occupations:
Here: 17.8% city: 4.0%
- Percentage of males in life, physical, and social science occupations:
Here: 4.1% city: 0.7%
- Percentage of males in education, training, and library occupations:
Here: 2.3% city: 2.5%
- Percentage of males in arts, design, entertainment, sports, and media occupations:
Here: 5.9% city: 1.9%
- Percentage of males in healthcare practitioners and technical occupations:
Here: 3.5% city: 2.3%
- Percentage of males in service occupations:
Here: 27.0% city: 15.6%
- Percentage of males in sales and office occupations:
Here: 3.5% city: 18.8%
- Percentage of males in construction, extraction, and maintenance occupations:
Here: 10.7% city: 9.1%
- Percentage of males in production occupations:
Here: 10.5% city: 5.4%
- Percentage of males in transportation occupations:
Here: 5.3% city: 5.3%
- Percentage of males in material moving occupations:
Here: 3.0% city: 4.2%
Occupations of females:
- Percentage of females in management occupations (except farmers):
Here: 2.0% city: 9.3%
- Percentage of females in business and financial operations occupations:
Here: 17.7% city: 7.6%
- Percentage of females in legal occupations:
Here: 2.6% city: 0.9%
- Percentage of females in education, training, and library occupations:
Here: 33.5% city: 7.8%
- Percentage of females in arts, design, entertainment, sports, and media occupations:
Here: 5.7% city: 1.7%
- Percentage of females in service occupations:
Here: 13.0% city: 20.2%
- Percentage of females in sales and office occupations:
Here: 35.1% city: 32.0%
Percentage of people 16-64 in Armed Forces:
| Glenwood-Wilbur: | 0.1% |
| Mesa: | 0.2% |
Education in this neighborhood (subdivision or community):
- Percentage of people 3 years and older in K-12 schools:
Glenwood-Wilbur: 48.5% Mesa: 17.9%
- Percentage of people 3 years and older in undergraduate colleges:
Glenwood-Wilbur: 9.6% Mesa: 4.5%
- Percentage of people 3 years and older in grad. or professional schools:
Glenwood-Wilbur: 2.6% Mesa: 1.2%
- Percentage of students K-12 enrolled in private schools:
Glenwood-Wilbur: 16.8% Mesa: 7.4%
Percentage of population below poverty level:
| Glenwood-Wilbur: | 16.3% |
| Mesa: | 9.5% |
Median year renter moved in (as recorded in 2022):
| Glenwood-Wilbur: | 2017 |
| Mesa: | 2020 |
Percentage of married-couple families with both working:
| Glenwood-Wilbur: | 326.0% |
| Mesa: | 65.9% |
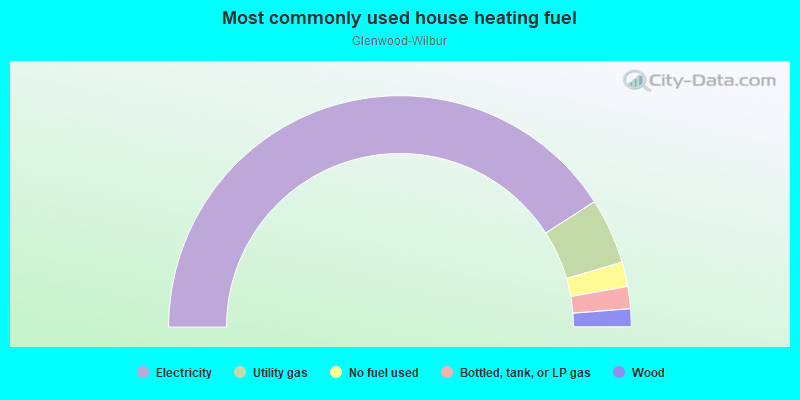
- 81.8%Electricity
- 9.2%Utility gas
- 3.4%No fuel used
- 3.1%Bottled, tank, or LP gas
- 2.5%Wood
Highways in this neighborhood:
US Hwy 89 (E Main St)
Length: 0.23 miles
Direction: E-W
Address range: 200 to 399
Direction: E-W
Address range: 200 to 399
Roads and streets:
N Hibbert
Length: 0.30 miles
Direction: N-S
Address range: 1 to 199
Direction: N-S
Address range: 1 to 199
N Pomeroy
Length: 0.30 miles
Direction: N-S
Address range: 1 to 199
Direction: N-S
Address range: 1 to 199
N Mesa Dr
Length: 0.30 miles
Direction: N-S
Address range: 1 to 221
Direction: N-S
Address range: 1 to 221
S Mesa Dr
Length: 0.26 miles
Direction: N-S
Address range: 1 to 149
Direction: N-S
Address range: 1 to 149
E 2nd St
Length: 0.23 miles
Direction: E-W
Address range: 200 to 399
Direction: E-W
Address range: 200 to 399
E 1st St
Length: 0.23 miles
Direction: E-W
Address range: 200 to 399
Direction: E-W
Address range: 200 to 399
E 1st Ave
Length: 0.23 miles
Direction: E-W
Address range: 200 to 399
Direction: E-W
Address range: 200 to 399
S Hibbert
Length: 0.21 miles
Direction: N-S
Address range: 1 to 130
Direction: N-S
Address range: 1 to 130
S Pomeroy
Length: 0.20 miles
Directions: E-W, N-S, SE-NW
Address range: 1 to 99
Directions: E-W, N-S, SE-NW
Address range: 1 to 99
E Pepper Pl
Length: 0.18 miles
Direction: E-W
Address range: 200 to 299
Direction: E-W
Address range: 200 to 299
N Wilbur
Length: 0.15 miles
Direction: N-S
Address range: 100 to 199
Direction: N-S
Address range: 100 to 199
E Temple Ct
Length: 0.12 miles
Directions: E-W, N-S
Address range: 1 to 58
Directions: E-W, N-S
Address range: 1 to 58
E Gateway Park
Length: 0.06 miles
Direction: E-W
Address range: 300 to 399
Direction: E-W
Address range: 300 to 399