Gardens (The Gardens) neighborhood in Westfield, New Jersey (NJ), 07090, 07092 detailed profile
Settings
X


Business Search - 14 Million verified businesses
Area: 0.204 square miles
Population: 1,217
Population density:
| Gardens (The Gardens): | 5,952 people per square mile |
| Westfield: | 4,581 people per square mile |

- 1,08587.5%White
- 453.6%Hispanic or Latino
- 433.5%Asian
- 393.1%Two or more races
- 110.9%Black
- 100.8%American Indian
- 70.6%Some other race

Median household income in 2022:
| Gardens (The Gardens): | $192,802 |
| Westfield: | $203,235 |
Distribution of median household income
![Distribution of median household income]()
- 9Less than $10,000
- 27$10,000 to $19,999
- 12$20,000 to $29,999
- 23$30,000 to $39,999
- 43$40,000 to $49,999
- 10$50,000 to $59,999
- 26$60,000 to $74,999
- 20$75,000 to $99,999
- 120$100,000 to $124,999
- 27$125,000 to $149,999
- 41$150,000 to $199,999
- 165$200,000 or more

Distribution of owner-occupied house/condo value
![Distribution of owner-occupied house/condo value]()
- 25Less than $50,000
- 15$50,000 to $99,999
- 18$100,000 to $149,999
- 7$150,000 to $199,999
- 6$200,000 to $249,999
- 4$300,000 to $399,999
- 11$400,000 to $499,999
- 17$500,000 to $749,999
- 69$750,000 to $999,999
- 287$1,000,000 or more

Distribution of rent paid by renters
![Distribution of rent paid by renters]()
- 3$500 to $599
- 3$600 to $699
- 2$700 to $799
- 2$1,000 to $1,249
- 7$1,250 to $1,499
- 82$1,500 to $1,999
- 206$2,000 or more

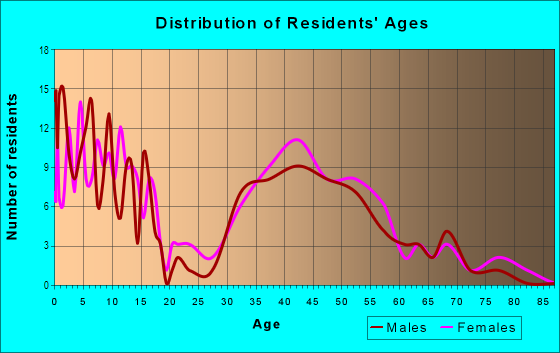
| Males: | 590 |
| Females: | 627 |
Males:
| This neighborhood: | 45.5 years |
| Whole city: | 40.3 years |
| This neighborhood: | 42.3 years |
| Whole city: | 40.4 years |
Average household size:
| Gardens (The Gardens): | 2.8 people |
| Westfield: | 2.9 people |
Percentage of family households:
| Gardens (The Gardens): | 79.9% |
| Westfield: | 62.0% |
| Here: | 89.6% |
| Westfield: | 71.7% |
Percentage of married-couple families with children (among all households):
| Gardens (The Gardens): | 29.0% |
| Westfield: | 30.1% |
Percentage of single-mother households (among all households):
| Gardens (The Gardens): | 3.4% |
| Westfield: | 2.4% |
Percentage of never married males 15 years old and over:
Percentage of never married females 15 years old and over:
| Gardens (The Gardens): | 11.0% |
| Westfield: | 12.0% |
Percentage of never married females 15 years old and over:
| Gardens (The Gardens): | 10.3% |
| town: | 11.6% |
Percentage of people that speak English not well or not at all:
| Gardens (The Gardens): | 0.9% |
| Westfield: | 1.2% |
Percentage of people born in this state:
Percentage of people born in another U.S. state:
Percentage of native residents but born outside the U.S.:
Percentage of foreign born residents:
| Here: | 43.0% |
| Westfield: | 50.2% |
Percentage of people born in another U.S. state:
| Gardens (The Gardens): | 47.2% |
| Westfield: | 37.0% |
Percentage of native residents but born outside the U.S.:
| Here: | 0.8% |
| town: | 1.2% |
Percentage of foreign born residents:
| Here: | 9.0% |
| Westfield: | 11.6% |

Owner-occupied
Renter-occupied


- Rooms in owner-occupied houses and condos in Gardens <
> - 01 room
- 02 rooms
- 33 rooms
- 134 rooms
- 245 rooms
- 346 rooms
- 197 rooms
- 588 rooms
- 2789+ rooms

- Rooms in renter-occupied apartments in Gardens <
> - 1241 room
- 62 rooms
- 373 rooms
- 94 rooms
- 335 rooms
- 246 rooms
- 107 rooms
- 388 rooms
- 49+ rooms
Owner-occupied
Renter-occupied

- Bedrooms in owner-occupied houses and condos in Gardens <
> - 0no bedroom
- 51 bedroom
- 492 bedrooms
- 383 bedrooms
- 2244 bedrooms
- 995+ bedrooms

- Bedrooms in renter-occupied apartments in Gardens <
> - 124no bedroom
- 381 bedroom
- 732 bedrooms
- 383 bedrooms
- 54 bedrooms
- 15+ bedrooms
Average number of cars or other vehicles available in houses/condos:
Average number of cars or other vehicles available in apartments:
| This neighborhood: | 0.9 |
| Westfield: | 2.2 |
Average number of cars or other vehicles available in apartments:
| Here: | 10.1 |
| town: | 1.4 |
Percentage of units with a mortgage:
| Gardens (The Gardens): | 75.7% |
| Westfield: | 69.8% |
Average estimated value of detached houses in 2022 (94.5% of all units):
| Gardens (The Gardens): | $1,211,118 |
| New Jersey: | $537,591 |

- Year house built in Gardens <
> - 12020 or later
- 62010 to 2019
- 62000 to 2009
- 31990 to 1999
- 81980 to 1989
- 141970 to 1979
- 451960 to 1969
- 661950 to 1959
- 201940 to 1949
- 2531939 or earlier

City-data.com crime index for town in 2020 (higher means more crime):
| City: | 34.4 |
| U.S. average: | 219.5 |
Travel time to work (commute)
![Travel time to work (commute)]()
- 8Less than 5 minutes
- 375 to 9 minutes
- 1410 to 14 minutes
- 3715 to 19 minutes
- 2920 to 24 minutes
- 1225 to 29 minutes
- 2530 to 34 minutes
- 1235 to 39 minutes
- 1640 to 44 minutes
- 3245 to 59 minutes
- 5360 to 89 minutes
- 2990 or more minutes

Means of transportation to work
![Means of transportation to work]()
- 47.3%241Drove a car alone
- 2.6%13Carpooled
- 1.8%9Bus
- 0.4%2Subway or elevated rail
- 3.5%18Long-distance train or commuter rail
- 0.4%2Light rail, streetcar or trolley
- 1.6%8Ferryboat
- 5.7%29Walked
- 1.4%7Other means
- 42.6%217Worked at home

Time leaving home to go to work
![Time leaving home to go to work]()
- 2412:00 a.m. to 4:59 a.m.
- 65:00 a.m. to 5:29 a.m.
- 25:30 a.m. to 5:59 a.m.
- 296:00 a.m. to 6:29 a.m.
- 196:30 a.m. to 6:59 a.m.
- 597:00 a.m. to 7:29 a.m.
- 387:30 a.m. to 7:59 a.m.
- 558:00 a.m. to 8:29 a.m.
- 358:30 a.m. to 8:59 a.m.
- 359:00 a.m. to 9:59 a.m.
- 710:00 a.m. to 10:59 a.m.
- 311:00 a.m. to 11:59 a.m.
- 912:00 p.m. to 3:59 p.m.
- 64:00 p.m. to 11:59 p.m.

Occupations of males:
- Percentage of males in management occupations (except farmers):
Here: 52.4% town: 26.3%
- Percentage of males in business and financial operations occupations:
Here: 6.7% town: 9.3%
- Percentage of males in computer and mathematical occupations:
Here: 6.2% town: 5.6%
- Percentage of males in architecture and engineering occupations:
Here: 6.5% town: 4.6%
- Percentage of males in life, physical, and social science occupations:
Here: 1.8% town: 1.7%
- Percentage of males in legal occupations:
Here: 2.7% town: 7.3%
- Percentage of males in education, training, and library occupations:
Here: 1.6% town: 3.3%
- Percentage of males in arts, design, entertainment, sports, and media occupations:
Here: 3.4% town: 3.4%
- Percentage of males in healthcare practitioners and technical occupations:
Here: 2.1% town: 3.7%
- Percentage of males in service occupations:
Here: 1.6% town: 6.1%
- Percentage of males in sales and office occupations:
Here: 11.8% town: 18.5%
- Percentage of males in production occupations:
Here: 1.0% town: 1.1%
- Percentage of males in transportation occupations:
Here: 1.1% town: 1.9%
- Percentage of males in material moving occupations:
Here: 1.6% town: 1.0%
Occupations of females:
- Percentage of females in management occupations (except farmers):
Here: 6.0% town: 14.0%
- Percentage of females in business and financial operations occupations:
Here: 14.9% town: 13.9%
- Percentage of females in computer and mathematical occupations:
Here: 2.4% town: 4.1%
- Percentage of females in life, physical, and social science occupations:
Here: 2.6% town: 2.7%
- Percentage of females in community and social services occupations:
Here: 4.3% town: 1.6%
- Percentage of females in legal occupations:
Here: 1.8% town: 4.4%
- Percentage of females in education, training, and library occupations:
Here: 9.6% town: 12.0%
- Percentage of females in arts, design, entertainment, sports, and media occupations:
Here: 5.5% town: 3.0%
- Percentage of females in healthcare practitioners and technical occupations:
Here: 6.5% town: 8.0%
- Percentage of females in sales and office occupations:
Here: 45.3% town: 22.7%
Education in this neighborhood (subdivision or community):
- Percentage of people 3 years and older in K-12 schools:
Gardens (The Gardens): 22.9% Westfield: 22.7%
- Percentage of people 3 years and older in undergraduate colleges:
Gardens (The Gardens): 6.0% Westfield: 3.6%
- Percentage of people 3 years and older in grad. or professional schools:
Gardens (The Gardens): 2.9% Westfield: 1.2%
- Percentage of students K-12 enrolled in private schools:
Gardens (The Gardens): 22.3% Westfield: 10.5%
Percentage of population below poverty level:
| Gardens (The Gardens): | 1.3% |
| Westfield: | 2.0% |
Median year owner moved in (as recorded in 2022):
| Gardens (The Gardens): | 2007 |
| Westfield: | 2005 |
Percentage of married-couple families with both working:
| Gardens (The Gardens): | 62.4% |
| Westfield: | 73.6% |

- 83.7%Utility gas
- 3.9%Electricity
- 3.9%Fuel oil, kerosene, etc.
- 2.4%Coal or coke
- 2.2%Solar energy
- 1.5%Bottled, tank, or LP gas
- 1.2%Other fuel
- 1.2%No fuel used
Roads and streets:
Highland Ave
Length: 0.80 miles
Directions: N-S, SE-NW, SW-NE
Address range: 400 to 999
Directions: N-S, SE-NW, SW-NE
Address range: 400 to 999
Bradford Ave
Length: 0.66 miles
Directions: E-W, N-S, SE-NW, SW-NE
Address range: 500 to 899
Directions: E-W, N-S, SE-NW, SW-NE
Address range: 500 to 899
Mountain Ave E
Length: 0.49 miles
Directions: N-S, SE-NW, SW-NE
Address range: 411 to 799
Directions: N-S, SE-NW, SW-NE
Address range: 411 to 799
Birch Ave
Length: 0.42 miles
Directions: E-W, SW-NE
Address range: 400 to 599
Directions: E-W, SW-NE
Address range: 400 to 599
Colonial Ave
Length: 0.37 miles
Directions: E-W, SW-NE
Address range: 400 to 599
Directions: E-W, SW-NE
Address range: 400 to 599
Alden St (Alden Ave)
Length: 0.32 miles
Directions: E-W, SW-NE
Address range: 400 to 599
Directions: E-W, SW-NE
Address range: 400 to 599
Priscilla Ln
Length: 0.27 miles
Direction: SE-NW
Address range: 1 to 127
Direction: SE-NW
Address range: 1 to 127
Standish Ave
Length: 0.24 miles
Direction: N-S
Address range: 600 to 831
Direction: N-S
Address range: 600 to 831
Dudley Ct
Length: 0.19 miles
Directions: N-S, SE-NW, SW-NE
Address range: 500 to 599
Directions: N-S, SE-NW, SW-NE
Address range: 500 to 599
Cedar Ter
Length: 0.17 miles
Directions: E-W, SE-NW, SW-NE
Address range: 800 to 899
Directions: E-W, SE-NW, SW-NE
Address range: 800 to 899
Hillside Ave
Length: 0.15 miles
Direction: SW-NE
Address range: 480 to 750
Direction: SW-NE
Address range: 480 to 750
E Dudley Ave
Length: 0.14 miles
Direction: SW-NE
Address range: 400 to 499
Direction: SW-NE
Address range: 400 to 499