Galveston neighborhood in Chandler, Arizona (AZ), 85225 detailed profile
Settings
X

Business Search - 14 Million verified businesses
Area: 0.383 square miles
Population: 475
Population density:
| Galveston: | 1,242 people per square mile |
| Chandler: | 4,849 people per square mile |

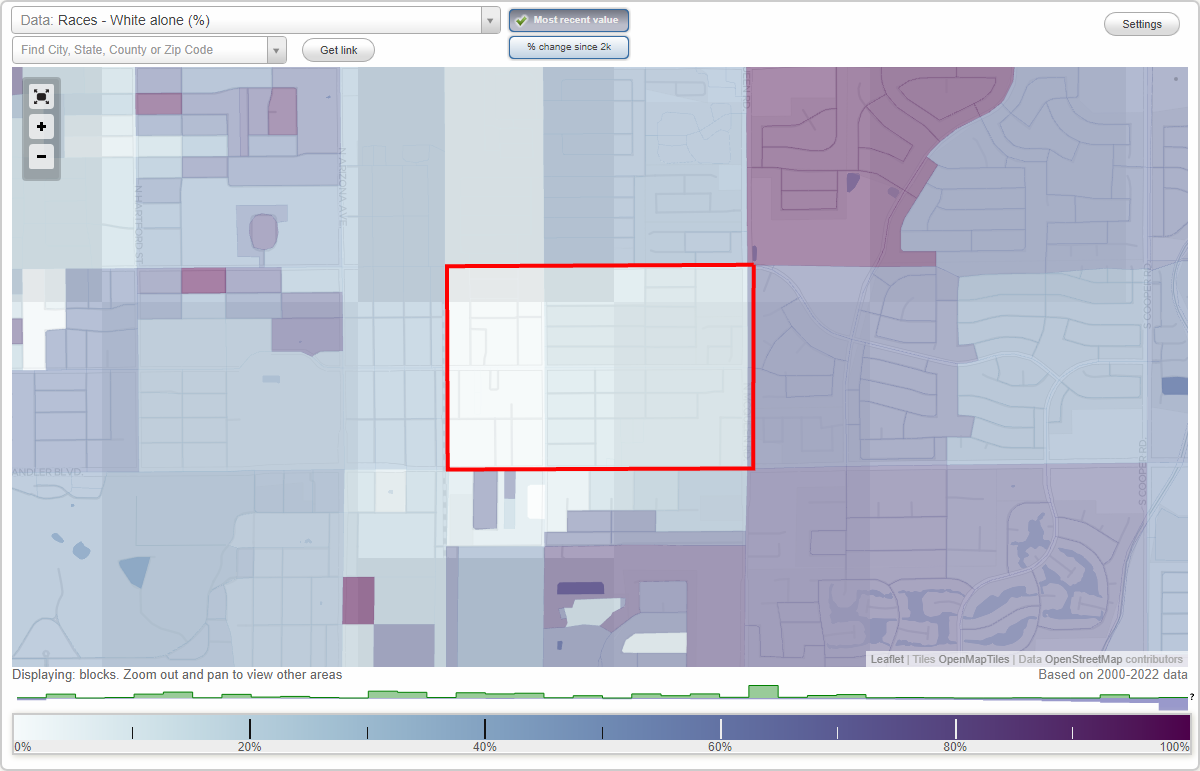
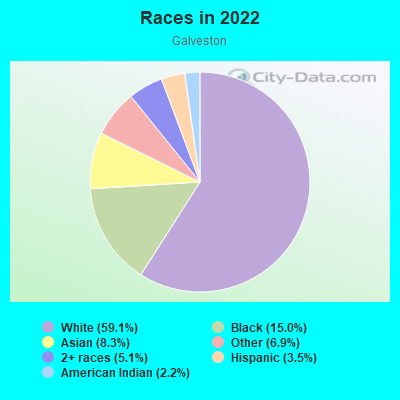
- 30059.1%White
- 7615.0%Black
- 428.3%Asian
- 356.9%Some other race
- 265.1%Two or more races
- 183.5%Hispanic or Latino
- 112.2%American Indian
Median household income in 2022:
| Galveston: | $67,968 |
| Chandler: | $98,664 |
Distribution of median household income
![Distribution of median household income]()
- 23Less than $10,000
- 51$10,000 to $19,999
- 34$20,000 to $29,999
- 38$30,000 to $39,999
- 93$40,000 to $49,999
- 47$50,000 to $59,999
- 68$60,000 to $74,999
- 39$75,000 to $99,999
- 12$100,000 to $124,999
- 33$125,000 to $149,999
- 12$150,000 to $199,999
- 44$200,000 or more

Distribution of owner-occupied house/condo value
![Distribution of owner-occupied house/condo value]()
- 15$150,000 to $199,999
- 38$200,000 to $249,999
- 13$250,000 to $299,999
- 140$300,000 to $399,999
- 48$400,000 to $499,999
- 34$500,000 to $749,999
- 6$750,000 to $999,999

Distribution of rent paid by renters
![Distribution of rent paid by renters]()
- 8$100 to $199
- 4$400 to $499
- 24$600 to $699
- 32$700 to $799
- 17$800 to $899
- 35$900 to $999
- 23$1,000 to $1,249
- 81$1,250 to $1,499
- 118$1,500 to $1,999

Median rent in 2022:
| Galveston: | $1,470 |
| Chandler: | $1,692 |
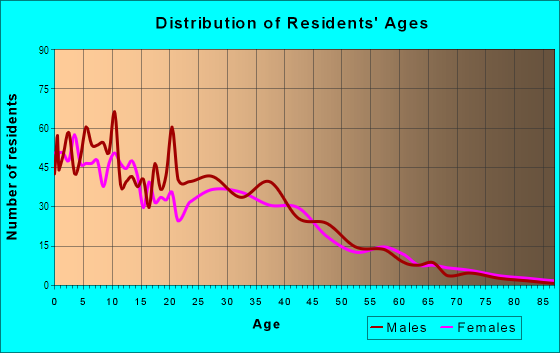
| Males: | 243 |
| Females: | 232 |
Males:
| This neighborhood: | 32.1 years |
| Whole city: | 35.8 years |
| This neighborhood: | 27.1 years |
| Whole city: | 38.3 years |
Average household size:
| Galveston: | 1.6 people |
| Chandler: | 2.6 people |
Percentage of family households:
| Galveston: | 29.5% |
| Chandler: | 53.2% |
| Here: | 29.5% |
| Chandler: | 50.7% |
Percentage of married-couple families with children (among all households):
| Galveston: | 31.4% |
| Chandler: | 26.2% |
Percentage of single-mother households (among all households):
| Galveston: | 26.8% |
| Chandler: | 7.3% |
Percentage of never married males 15 years old and over:
Percentage of never married females 15 years old and over:
| Galveston: | 29.7% |
| Chandler: | 20.3% |
Percentage of never married females 15 years old and over:
| Galveston: | 23.4% |
| city: | 14.9% |
Percentage of people born in this state:
Percentage of people born in another U.S. state:
Percentage of native residents but born outside the U.S.:
Percentage of foreign born residents:
| Here: | 41.7% |
| Chandler: | 35.8% |
Percentage of people born in another U.S. state:
| Galveston: | 37.4% |
| Chandler: | 44.6% |
Percentage of native residents but born outside the U.S.:
| Here: | 0.3% |
| city: | 1.5% |
Percentage of foreign born residents:
| Here: | 20.6% |
| Chandler: | 18.0% |
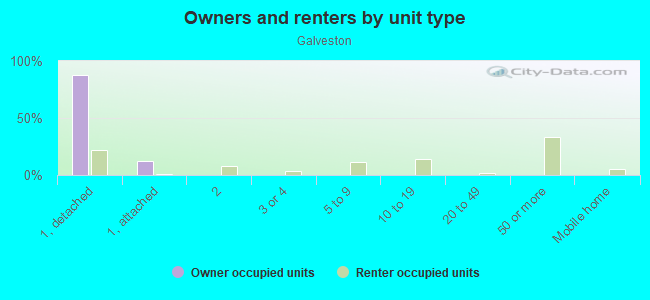
Owner-occupied
Renter-occupied

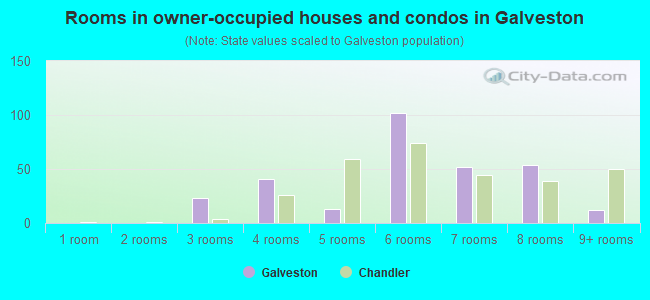
- Rooms in owner-occupied houses and condos in Galveston
- 01 room
- 02 rooms
- 233 rooms
- 414 rooms
- 135 rooms
- 1026 rooms
- 527 rooms
- 548 rooms
- 129+ rooms
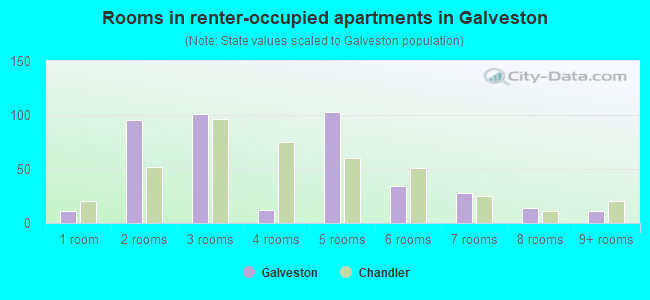
- Rooms in renter-occupied apartments in Galveston
- 111 room
- 952 rooms
- 1013 rooms
- 124 rooms
- 1035 rooms
- 346 rooms
- 287 rooms
- 148 rooms
- 119+ rooms
Owner-occupied
Renter-occupied
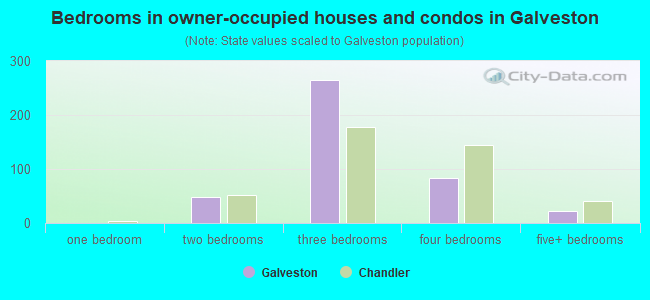
- Bedrooms in owner-occupied houses and condos in Galveston
- 0no bedroom
- 01 bedroom
- 492 bedrooms
- 2643 bedrooms
- 834 bedrooms
- 225+ bedrooms
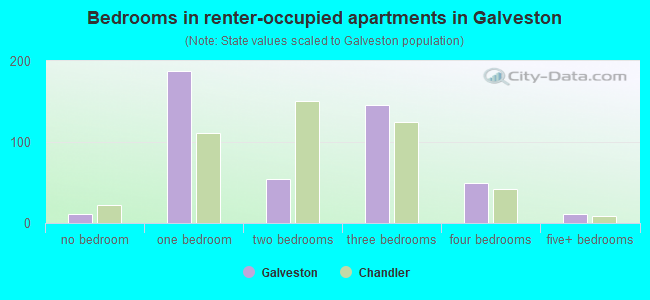
- Bedrooms in renter-occupied apartments in Galveston
- 11no bedroom
- 1881 bedroom
- 542 bedrooms
- 1463 bedrooms
- 494 bedrooms
- 115+ bedrooms
Average number of cars or other vehicles available in houses/condos:
Average number of cars or other vehicles available in apartments:
| This neighborhood: | 1.7 |
| Chandler: | 2.1 |
Average number of cars or other vehicles available in apartments:
| Here: | 1.2 |
| city: | 1.5 |
Percentage of units with a mortgage:
| Galveston: | 33.5% |
| Chandler: | 73.1% |
Average estimated value of townhouses or other attached units in 2022 (15.1% of all units):
| This neighborhood: | $248,206 |
| city: | $322,028 |
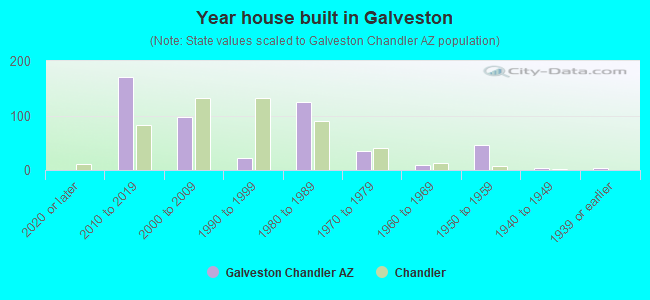
- Year house built in Galveston
- 02020 or later
- 1712010 to 2019
- 972000 to 2009
- 221990 to 1999
- 1251980 to 1989
- 341970 to 1979
- 91960 to 1969
- 451950 to 1959
- 41940 to 1949
- 31939 or earlier
City-data.com crime index for city in 2020 (higher means more crime):
| City: | 165.7 |
| U.S. average: | 219.5 |
Travel time to work (commute)
![Travel time to work (commute)]()
- 15Less than 5 minutes
- 915 to 9 minutes
- 21610 to 14 minutes
- 21215 to 19 minutes
- 15620 to 24 minutes
- 12825 to 29 minutes
- 17330 to 34 minutes
- 3535 to 39 minutes
- 8540 to 44 minutes
- 9545 to 59 minutes
- 3760 to 89 minutes
- 3290 or more minutes

Means of transportation to work
![Means of transportation to work]()
- 77.0%331Drove a car alone
- 9.1%39Carpooled
- 1.6%7Bus
- 0.9%4Taxi
- 0.9%4Bicycle
- 3.0%13Walked
- 4.9%21Other means
- 10.7%46Worked at home

Time leaving home to go to work
![Time leaving home to go to work]()
- 6512:00 a.m. to 4:59 a.m.
- 1415:00 a.m. to 5:29 a.m.
- 345:30 a.m. to 5:59 a.m.
- 1176:00 a.m. to 6:29 a.m.
- 1316:30 a.m. to 6:59 a.m.
- 2987:00 a.m. to 7:29 a.m.
- 567:30 a.m. to 7:59 a.m.
- 898:00 a.m. to 8:29 a.m.
- 48:30 a.m. to 8:59 a.m.
- 669:00 a.m. to 9:59 a.m.
- 1011:00 a.m. to 11:59 a.m.
- 14112:00 p.m. to 3:59 p.m.
- 1204:00 p.m. to 11:59 p.m.

Occupations of males:
- Percentage of males in management occupations (except farmers):
Here: 16.9% city: 13.0%
- Percentage of males in business and financial operations occupations:
Here: 8.0% city: 7.1%
- Percentage of males in computer and mathematical occupations:
Here: 27.7% city: 8.4%
- Percentage of males in architecture and engineering occupations:
Here: 8.4% city: 9.9%
- Percentage of males in education, training, and library occupations:
Here: 5.3% city: 3.3%
- Percentage of males in arts, design, entertainment, sports, and media occupations:
Here: 5.3% city: 2.0%
- Percentage of males in healthcare practitioners and technical occupations:
Here: 5.3% city: 3.0%
- Percentage of males in service occupations:
Here: 28.4% city: 11.0%
- Percentage of males in sales and office occupations:
Here: 11.6% city: 17.8%
- Percentage of males in construction, extraction, and maintenance occupations:
Here: 4.9% city: 5.9%
- Percentage of males in production occupations:
Here: 4.0% city: 4.4%
- Percentage of males in transportation occupations:
Here: 5.8% city: 3.6%
- Percentage of males in material moving occupations:
Here: 11.0% city: 3.9%
Occupations of females:
- Percentage of females in management occupations (except farmers):
Here: 10.0% city: 11.0%
- Percentage of females in business and financial operations occupations:
Here: 5.8% city: 9.3%
- Percentage of females in computer and mathematical occupations:
Here: 5.3% city: 3.8%
- Percentage of females in architecture and engineering occupations:
Here: 8.9% city: 2.4%
- Percentage of females in life, physical, and social science occupations:
Here: 14.6% city: 0.9%
- Percentage of females in community and social services occupations:
Here: 5.3% city: 2.1%
- Percentage of females in education, training, and library occupations:
Here: 12.0% city: 8.7%
- Percentage of females in healthcare practitioners and technical occupations:
Here: 27.5% city: 9.8%
- Percentage of females in service occupations:
Here: 30.7% city: 15.2%
- Percentage of females in sales and office occupations:
Here: 13.8% city: 28.7%
- Percentage of females in production occupations:
Here: 4.7% city: 2.0%
- Percentage of females in transportation occupations:
Here: 5.3% city: 1.1%
- Percentage of females in material moving occupations:
Here: 12.9% city: 1.1%
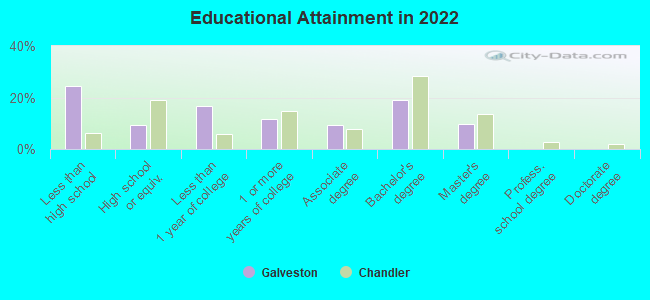
Education in this neighborhood (subdivision or community):
- Percentage of people 3 years and older in K-12 schools:
Galveston: 123.8% Chandler: 19.1%
- Percentage of people 3 years and older in undergraduate colleges:
Galveston: 8.8% Chandler: 4.5%
- Percentage of people 3 years and older in grad. or professional schools:
Galveston: 3.2% Chandler: 1.8%
- Percentage of students K-12 enrolled in private schools:
Galveston: 4.3% Chandler: 14.2%
Percentage of population below poverty level:
| Galveston: | 18.1% |
| Chandler: | 7.6% |
Median year renter moved in (as recorded in 2022):
| Galveston: | 2019 |
| Chandler: | 2020 |
Percentage of married-couple families with both working:
| Galveston: | 72.6% |
| Chandler: | 68.1% |
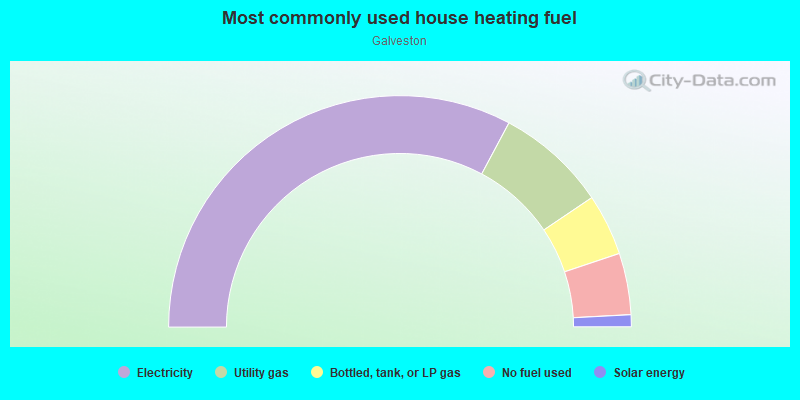
- 65.7%Electricity
- 15.5%Utility gas
- 8.6%Bottled, tank, or LP gas
- 8.6%No fuel used
- 1.7%Solar energy
Roads and streets:
E Erie St
Length: 0.85 miles
Direction: E-W
Address range: 346 to 999
Direction: E-W
Address range: 346 to 999
E Detroit St
Length: 0.78 miles
Directions: E-W, SW-NE
Address range: 300 to 999
Directions: E-W, SW-NE
Address range: 300 to 999
E Chandler Blvd
Length: 0.78 miles
Direction: E-W
Address range: 322 to 951
Direction: E-W
Address range: 322 to 951
E Oakland St
Length: 0.67 miles
Direction: E-W
Address range: 400 to 899
Direction: E-W
Address range: 400 to 899
E Flint St
Length: 0.53 miles
Directions: E-W, SW-NE
Address range: 600 to 999
Directions: E-W, SW-NE
Address range: 600 to 999
E Tyson St
Length: 0.51 miles
Directions: E-W, SW-NE
Address range: 600 to 999
Directions: E-W, SW-NE
Address range: 600 to 999
N McQueen Rd
Length: 0.50 miles
Direction: N-S
Address range: 200 to 599
Direction: N-S
Address range: 200 to 599
N Jackson St
Length: 0.45 miles
Directions: N-S, SW-NE
Address range: 200 to 549
Directions: N-S, SW-NE
Address range: 200 to 549
E Carla Vista Dr
Length: 0.45 miles
Direction: E-W
Address range: 600 to 899
Direction: E-W
Address range: 600 to 899
N Hamilton St
Length: 0.40 miles
Direction: N-S
Address range: 200 to 499
Direction: N-S
Address range: 200 to 499
N Exeter St
Length: 0.34 miles
Direction: N-S
Address range: 200 to 577
Direction: N-S
Address range: 200 to 577
N Fresno St
Length: 0.34 miles
Direction: N-S
Address range: 200 to 577
Direction: N-S
Address range: 200 to 577
E Tulsa St
Length: 0.29 miles
Direction: E-W
Address range: 400 to 899
Direction: E-W
Address range: 400 to 899
N Ithica St
Length: 0.25 miles
Direction: N-S
Address range: 200 to 398
Direction: N-S
Address range: 200 to 398
E Toledo St
Length: 0.21 miles
Direction: E-W
Address range: 600 to 799
Direction: E-W
Address range: 600 to 799
N Kingston St
Length: 0.21 miles
Directions: N-S, SW-NE
Address range: 300 to 549
Directions: N-S, SW-NE
Address range: 300 to 549
N Monte Vista St
Length: 0.17 miles
Directions: N-S, SW-NE
Address range: 200 to 449
Directions: N-S, SW-NE
Address range: 200 to 449
N Williams St
Length: 0.14 miles
Directions: N-S, SW-NE
Address range: 300 to 499
Directions: N-S, SW-NE
Address range: 300 to 499
E San Tan St
Length: 0.14 miles
Direction: E-W
Address range: 400 to 499
Direction: E-W
Address range: 400 to 499
E Carla Vista Pl
Length: 0.13 miles
Directions: E-W, SW-NE
Address range: 900 to 999
Directions: E-W, SW-NE
Address range: 900 to 999
N Nevada St
Length: 0.13 miles
Direction: N-S
Address range: 300 to 399
Direction: N-S
Address range: 300 to 399
E Galveston St
Length: 0.02 miles
Direction: E-W
Address range: 986 to 999
Direction: E-W
Address range: 986 to 999