Fort Eureka Estates neighborhood in Southgate, Michigan (MI), 48192, 48195 detailed profile
Settings
X


Business Search - 14 Million verified businesses
Area: 0.137 square miles
Population: 716
Population density:
| Fort Eureka Estates: | 5,226 people per square mile |
| Southgate: | 4,368 people per square mile |

- 66277.2%White
- 9711.3%Black
- 303.5%Asian
- 303.5%Hispanic or Latino
- 182.1%Two or more races
- 141.6%Some other race
- 70.8%American Indian

Distribution of median household income
![Distribution of median household income]()
- 34Less than $10,000
- 17$10,000 to $19,999
- 23$20,000 to $29,999
- 59$30,000 to $39,999
- 58$40,000 to $49,999
- 14$50,000 to $59,999
- 25$60,000 to $74,999
- 66$75,000 to $99,999
- 9$100,000 to $124,999
- 15$125,000 to $149,999
- 49$150,000 to $199,999
- 9$200,000 or more

Distribution of owner-occupied house/condo value
![Distribution of owner-occupied house/condo value]()
- 28Less than $50,000
- 46$50,000 to $99,999
- 164$100,000 to $149,999
- 63$150,000 to $199,999
- 26$200,000 to $249,999
- 23$250,000 to $299,999
- 3$300,000 to $399,999
- 3$400,000 to $499,999
- 13$1,000,000 or more

Distribution of rent paid by renters
![Distribution of rent paid by renters]()
- 3$200 to $299
- 18$400 to $499
- 17$500 to $599
- 21$600 to $699
- 57$700 to $799
- 23$800 to $899
- 64$900 to $999
- 13$1,000 to $1,249
- 7$1,250 to $1,499

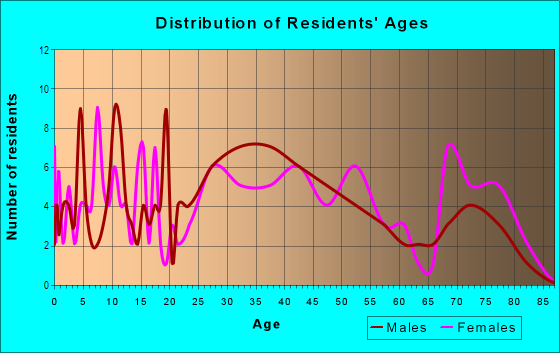
| Males: | 300 |
| Females: | 416 |
Males:
| This neighborhood: | 34.2 years |
| Whole city: | 38.6 years |
| This neighborhood: | 38.6 years |
| Whole city: | 42.4 years |
Average household size:
| Fort Eureka Estates: | 6.1 people |
| Southgate: | 2.4 people |
Percentage of family households:
| Fort Eureka Estates: | 51.8% |
| Southgate: | 43.8% |
| Here: | 40.5% |
| Southgate: | 42.1% |
Percentage of married-couple families with children (among all households):
| Fort Eureka Estates: | 11.8% |
| Southgate: | 27.5% |
Percentage of single-mother households (among all households):
| Fort Eureka Estates: | 19.7% |
| Southgate: | 8.8% |
Percentage of never married males 15 years old and over:
Percentage of never married females 15 years old and over:
| Fort Eureka Estates: | 12.9% |
| Southgate: | 19.3% |
Percentage of never married females 15 years old and over:
| Fort Eureka Estates: | 18.9% |
| city: | 14.8% |
Percentage of people that speak English not well or not at all:
| Fort Eureka Estates: | 0.5% |
| Southgate: | 1.1% |
Percentage of people born in this state:
Percentage of people born in another U.S. state:
Percentage of native residents but born outside the U.S.:
Percentage of foreign born residents:
| Here: | 84.6% |
| Southgate: | 80.4% |
Percentage of people born in another U.S. state:
| Fort Eureka Estates: | 11.6% |
| Southgate: | 12.8% |
Percentage of native residents but born outside the U.S.:
| Here: | 1.7% |
| city: | 0.6% |
Percentage of foreign born residents:
| Here: | 3.8% |
| Southgate: | 6.2% |

Owner-occupied
Renter-occupied


- Rooms in owner-occupied houses and condos in Fort Eureka Estates
- 01 room
- 02 rooms
- 253 rooms
- 224 rooms
- 1575 rooms
- 166 rooms
- 457 rooms
- 348 rooms
- 239+ rooms

- Rooms in renter-occupied apartments in Fort Eureka Estates
- 31 room
- 482 rooms
- 373 rooms
- 134 rooms
- 265 rooms
- 96 rooms
- 27 rooms
- 128 rooms
- 09+ rooms
Owner-occupied
Renter-occupied

- Bedrooms in owner-occupied houses and condos in Fort Eureka Estates
- 0no bedroom
- 01 bedroom
- 1442 bedrooms
- 1233 bedrooms
- 84 bedrooms
- 695+ bedrooms

- Bedrooms in renter-occupied apartments in Fort Eureka Estates
- 3no bedroom
- 571 bedroom
- 232 bedrooms
- 123 bedrooms
- 94 bedrooms
- 05+ bedrooms
Average number of cars or other vehicles available in houses/condos:
Average number of cars or other vehicles available in apartments:
| This neighborhood: | 1.8 |
| Southgate: | 1.9 |
Average number of cars or other vehicles available in apartments:
| Here: | |
| city: |
Percentage of units with a mortgage:
| Fort Eureka Estates: | 62.5% |
| Southgate: | 61.2% |
Average estimated value of detached houses in 2022 (98.7% of all units):
| Fort Eureka Estates: | $144,705 |
| Michigan: | $280,038 |

- Year house built in Fort Eureka Estates
- 02020 or later
- 02010 to 2019
- 52000 to 2009
- 121990 to 1999
- 171980 to 1989
- 871970 to 1979
- 371960 to 1969
- 1651950 to 1959
- 901940 to 1949
- 81939 or earlier

City-data.com crime index for city in 2020 (higher means more crime):
| City: | 165.3 |
| U.S. average: | 219.5 |
Travel time to work (commute)
![Travel time to work (commute)]()
- 14Less than 5 minutes
- 615 to 9 minutes
- 5510 to 14 minutes
- 3315 to 19 minutes
- 7220 to 24 minutes
- 2325 to 29 minutes
- 4030 to 34 minutes
- 235 to 39 minutes
- 1540 to 44 minutes
- 2645 to 59 minutes
- 2060 to 89 minutes
- 490 or more minutes

Means of transportation to work
![Means of transportation to work]()
- 79.2%344Drove a car alone
- 9.4%41Carpooled
- 0.7%3Bus
- 0.7%3Taxi
- 2.5%11Bicycle
- 1.2%5Walked
- 3.2%14Other means
- 11.1%48Worked at home

Time leaving home to go to work
![Time leaving home to go to work]()
- 2012:00 a.m. to 4:59 a.m.
- 45:00 a.m. to 5:29 a.m.
- 85:30 a.m. to 5:59 a.m.
- 216:00 a.m. to 6:29 a.m.
- 206:30 a.m. to 6:59 a.m.
- 847:00 a.m. to 7:29 a.m.
- 437:30 a.m. to 7:59 a.m.
- 418:00 a.m. to 8:29 a.m.
- 58:30 a.m. to 8:59 a.m.
- 189:00 a.m. to 9:59 a.m.
- 2110:00 a.m. to 10:59 a.m.
- 411:00 a.m. to 11:59 a.m.
- 3012:00 p.m. to 3:59 p.m.
- 284:00 p.m. to 11:59 p.m.

Occupations of males:
- Percentage of males in management occupations (except farmers):
Here: 12.3% city: 10.1%
- Percentage of males in business and financial operations occupations:
Here: 3.8% city: 4.3%
- Percentage of males in computer and mathematical occupations:
Here: 18.5% city: 4.5%
- Percentage of males in architecture and engineering occupations:
Here: 3.3% city: 4.9%
- Percentage of males in education, training, and library occupations:
Here: 4.4% city: 2.1%
- Percentage of males in service occupations:
Here: 6.0% city: 13.4%
- Percentage of males in production occupations:
Here: 21.4% city: 15.2%
- Percentage of males in transportation occupations:
Here: 9.9% city: 8.2%
- Percentage of males in material moving occupations:
Here: 6.5% city: 5.8%
Occupations of females:
- Percentage of females in management occupations (except farmers):
Here: 10.8% city: 6.6%
- Percentage of females in education, training, and library occupations:
Here: 9.8% city: 8.4%
- Percentage of females in arts, design, entertainment, sports, and media occupations:
Here: 3.1% city: 1.0%
- Percentage of females in healthcare practitioners and technical occupations:
Here: 17.6% city: 11.4%
- Percentage of females in service occupations:
Here: 43.8% city: 17.0%
- Percentage of females in sales and office occupations:
Here: 14.3% city: 33.4%
Percentage of people 16-64 in Armed Forces:
| Fort Eureka Estates: | 0.1% |
| Southgate: | 0.0% |
Education in this neighborhood (subdivision or community):
- Percentage of people 3 years and older in K-12 schools:
Fort Eureka Estates: 35.2% Southgate: 15.2%
- Percentage of people 3 years and older in undergraduate colleges:
Fort Eureka Estates: 9.5% Southgate: 4.3%
- Percentage of people 3 years and older in grad. or professional schools:
Fort Eureka Estates: 3.6% Southgate: 1.3%
- Percentage of students K-12 enrolled in private schools:
Fort Eureka Estates: 51.8% Southgate: 21.0%
Percentage of population below poverty level:
| Fort Eureka Estates: | 22.4% |
| Southgate: | 9.7% |
Percentage of married-couple families with both working:
| Fort Eureka Estates: | 341.9% |
| Southgate: | 62.3% |

- 67.3%Utility gas
- 20.0%Electricity
- 4.3%Bottled, tank, or LP gas
- 4.1%Wood
- 2.5%Other fuel
- 1.8%No fuel used
Highways in this neighborhood:
State Hwy 85 (Fort St)
Length: 1.00 miles
Direction: N-S
Direction: N-S
Roads and streets:
Barberry Ave (Barberry St)
Length: 0.50 miles
Direction: N-S
Address range: 15000 to 15999
Direction: N-S
Address range: 15000 to 15999
Eureka Rd
Length: 0.17 miles
Direction: E-W
Address range: 12700 to 12999
Direction: E-W
Address range: 12700 to 12999
Peach St
Length: 0.14 miles
Direction: E-W
Address range: 12700 to 12999
Direction: E-W
Address range: 12700 to 12999
Orange St
Length: 0.14 miles
Direction: E-W
Address range: 12700 to 12999
Direction: E-W
Address range: 12700 to 12999
Cherry St
Length: 0.14 miles
Direction: E-W
Address range: 12700 to 12999
Direction: E-W
Address range: 12700 to 12999
Spruce St
Length: 0.14 miles
Direction: E-W
Address range: 12700 to 12999
Direction: E-W
Address range: 12700 to 12999
Plum St
Length: 0.14 miles
Direction: E-W
Address range: 12700 to 12999
Direction: E-W
Address range: 12700 to 12999
Leroy St
Length: 0.14 miles
Direction: E-W
Address range: 12700 to 12999
Direction: E-W
Address range: 12700 to 12999
Balsam St
Length: 0.14 miles
Direction: E-W
Address range: 12700 to 12999
Direction: E-W
Address range: 12700 to 12999
Orchard St
Length: 0.14 miles
Direction: E-W
Address range: 12700 to 12999
Direction: E-W
Address range: 12700 to 12999
Orchard Ave
Length: 0.04 miles
Directions: E-W, SE-NW
Directions: E-W, SE-NW
Balsam Ave
Length: 0.04 miles
Directions: E-W, SE-NW
Directions: E-W, SE-NW
Grove St
Length: 0.03 miles
Direction: E-W
Direction: E-W