Fairmont Park neighborhood in Johnson City, New York (NY), 13760, 13790 detailed profile
Settings
X


Business Search - 14 Million verified businesses
Area: 1.778 square miles
Population: 1,124
Population density:
| Fairmont Park: | 632 people per square mile |
| Johnson City: | 3,428 people per square mile |

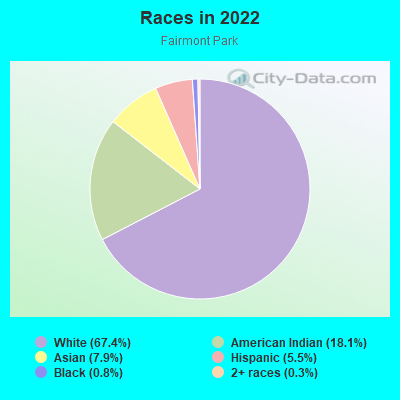
- 92567.4%White
- 24818.1%American Indian
- 1087.9%Asian
- 765.5%Hispanic or Latino
- 110.8%Black
- 40.3%Two or more races
Distribution of median household income
![Distribution of median household income]()
- 103Less than $10,000
- 35$10,000 to $19,999
- 119$20,000 to $29,999
- 15$30,000 to $39,999
- 27$40,000 to $49,999
- 20$50,000 to $59,999
- 11$60,000 to $74,999
- 47$75,000 to $99,999
- 44$100,000 to $124,999
- 77$125,000 to $149,999
- 81$150,000 to $199,999
- 83$200,000 or more

Distribution of owner-occupied house/condo value
![Distribution of owner-occupied house/condo value]()
- 143Less than $50,000
- 316$50,000 to $99,999
- 49$100,000 to $149,999
- 180$150,000 to $199,999
- 94$200,000 to $249,999
- 69$250,000 to $299,999
- 77$300,000 to $399,999
- 17$400,000 to $499,999
- 21$500,000 to $749,999
- 25$750,000 to $999,999
- 104$1,000,000 or more

Distribution of rent paid by renters
![Distribution of rent paid by renters]()
- 3$100 to $199
- 1$300 to $399
- 51$400 to $499
- 55$500 to $599
- 33$600 to $699
- 173$700 to $799
- 177$800 to $899
- 141$900 to $999
- 800$1,000 to $1,249
- 744$1,250 to $1,499
- 64$1,500 to $1,999
- 49$2,000 or more

| Males: | 557 |
| Females: | 566 |
Males:
| This neighborhood: | 40.1 years |
| Whole city: | 36.0 years |
| This neighborhood: | 47.8 years |
| Whole city: | 41.2 years |
Average household size:
| Fairmont Park: | 6.3 people |
| Johnson City: | 2.2 people |
Percentage of family households:
| Fairmont Park: | 52.4% |
| Johnson City: | 31.6% |
| Here: | 62.9% |
| Johnson City: | 31.6% |
Percentage of married-couple families with children (among all households):
| Fairmont Park: | 33.4% |
| Johnson City: | 20.1% |
Percentage of single-mother households (among all households):
| Fairmont Park: | 1.1% |
| Johnson City: | 18.9% |
Percentage of never married males 15 years old and over:
Percentage of never married females 15 years old and over:
| Fairmont Park: | 11.8% |
| Johnson City: | 23.9% |
Percentage of never married females 15 years old and over:
| Fairmont Park: | 11.9% |
| village: | 20.9% |
Percentage of people that speak English not well or not at all:
| Fairmont Park: | 0.7% |
| Johnson City: | 3.3% |
Percentage of people born in this state:
Percentage of people born in another U.S. state:
Percentage of native residents but born outside the U.S.:
Percentage of foreign born residents:
| Here: | 77.6% |
| Johnson City: | 72.7% |
Percentage of people born in another U.S. state:
| Fairmont Park: | 16.1% |
| Johnson City: | 15.9% |
Percentage of native residents but born outside the U.S.:
| Here: | 0.8% |
| village: | 0.9% |
Percentage of foreign born residents:
| Here: | 5.5% |
| Johnson City: | 10.5% |
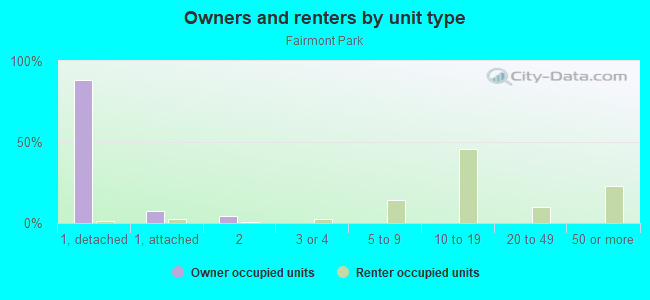
Owner-occupied
Renter-occupied

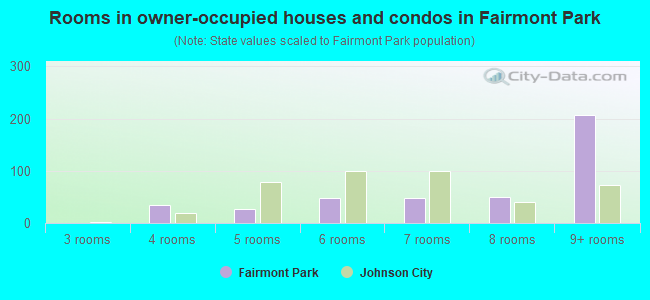
- Rooms in owner-occupied houses and condos in Fairmont Park
- 01 room
- 02 rooms
- 03 rooms
- 344 rooms
- 265 rooms
- 486 rooms
- 487 rooms
- 508 rooms
- 2079+ rooms
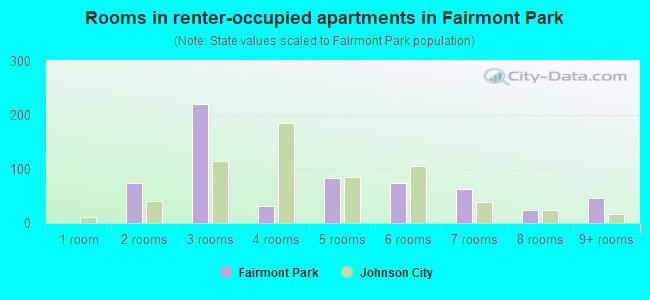
- Rooms in renter-occupied apartments in Fairmont Park
- 01 room
- 752 rooms
- 2203 rooms
- 324 rooms
- 845 rooms
- 756 rooms
- 637 rooms
- 258 rooms
- 479+ rooms
Owner-occupied
Renter-occupied
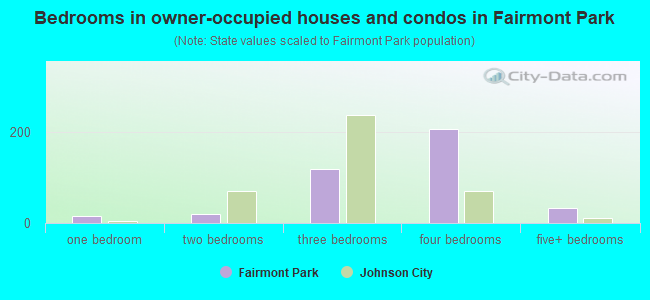
- Bedrooms in owner-occupied houses and condos in Fairmont Park
- 0no bedroom
- 161 bedroom
- 192 bedrooms
- 1203 bedrooms
- 2074 bedrooms
- 345+ bedrooms
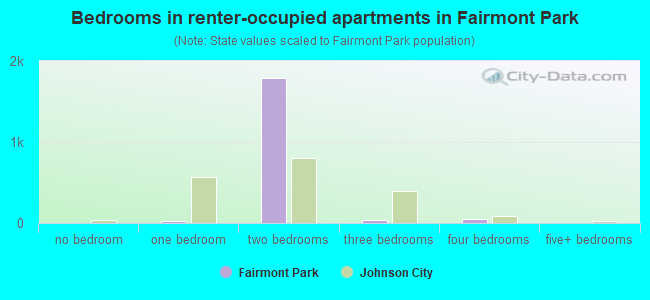
- Bedrooms in renter-occupied apartments in Fairmont Park
- 4no bedroom
- 221 bedroom
- 1,7862 bedrooms
- 393 bedrooms
- 474 bedrooms
- 05+ bedrooms
Average number of cars or other vehicles available in houses/condos:
Average number of cars or other vehicles available in apartments:
| This neighborhood: | 4.5 |
| Johnson City: | 1.8 |
Average number of cars or other vehicles available in apartments:
| Here: | 58.1 |
| village: | 1.0 |
Percentage of units with a mortgage:
| Fairmont Park: | 62.7% |
| Johnson City: | 51.4% |
Average estimated value of detached houses in 2022 (83.1% of all units):
| Fairmont Park: | $253,077 |
| New York: | $476,719 |
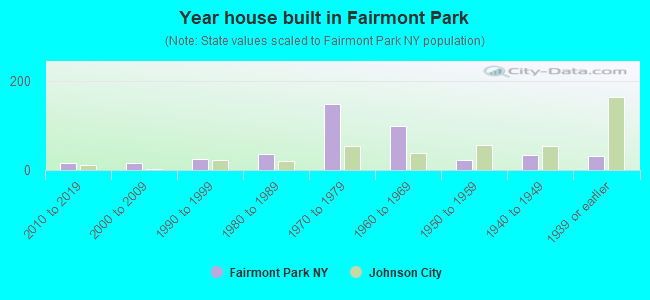
- Year house built in Fairmont Park
- 02020 or later
- 152010 to 2019
- 162000 to 2009
- 241990 to 1999
- 351980 to 1989
- 1491970 to 1979
- 991960 to 1969
- 221950 to 1959
- 341940 to 1949
- 311939 or earlier
City-data.com crime index for village in 2020 (higher means more crime):
| City: | 417.9 |
| U.S. average: | 219.5 |
Travel time to work (commute)
![Travel time to work (commute)]()
- 35Less than 5 minutes
- 705 to 9 minutes
- 9610 to 14 minutes
- 10615 to 19 minutes
- 5020 to 24 minutes
- 2325 to 29 minutes
- 730 to 34 minutes
- 835 to 39 minutes
- 2745 to 59 minutes
- 460 to 89 minutes
- 290 or more minutes

Means of transportation to work
![Means of transportation to work]()
- 85.4%497Drove a car alone
- 28.2%164Carpooled
- 5.8%34Motorcycle
- 2.7%16Walked
- 21.1%123Other means
- 14.1%82Worked at home

Time leaving home to go to work
![Time leaving home to go to work]()
- 212:00 a.m. to 4:59 a.m.
- 145:00 a.m. to 5:29 a.m.
- 195:30 a.m. to 5:59 a.m.
- 266:00 a.m. to 6:29 a.m.
- 286:30 a.m. to 6:59 a.m.
- 677:00 a.m. to 7:29 a.m.
- 707:30 a.m. to 7:59 a.m.
- 638:00 a.m. to 8:29 a.m.
- 238:30 a.m. to 8:59 a.m.
- 399:00 a.m. to 9:59 a.m.
- 2310:00 a.m. to 10:59 a.m.
- 111:00 a.m. to 11:59 a.m.
- 1812:00 p.m. to 3:59 p.m.
- 114:00 p.m. to 11:59 p.m.

Occupations of males:
- Percentage of males in management occupations (except farmers):
Here: 10.6% village: 11.6%
- Percentage of males in computer and mathematical occupations:
Here: 11.1% village: 4.4%
- Percentage of males in architecture and engineering occupations:
Here: 5.1% village: 3.6%
- Percentage of males in legal occupations:
Here: 2.8% village: 0.4%
- Percentage of males in education, training, and library occupations:
Here: 22.1% village: 5.2%
- Percentage of males in arts, design, entertainment, sports, and media occupations:
Here: 4.8% village: 2.4%
- Percentage of males in service occupations:
Here: 18.4% village: 21.1%
- Percentage of males in sales and office occupations:
Here: 17.6% village: 14.7%
- Percentage of males in production occupations:
Here: 1.3% village: 5.3%
- Percentage of males in transportation occupations:
Here: 1.2% village: 6.9%
- Percentage of males in material moving occupations:
Here: 3.4% village: 5.0%
Occupations of females:
- Percentage of females in management occupations (except farmers):
Here: 7.6% village: 7.1%
- Percentage of females in business and financial operations occupations:
Here: 3.7% village: 9.9%
- Percentage of females in computer and mathematical occupations:
Here: 10.7% village: 1.0%
- Percentage of females in community and social services occupations:
Here: 4.3% village: 3.5%
- Percentage of females in legal occupations:
Here: 4.7% village: 0.2%
- Percentage of females in education, training, and library occupations:
Here: 17.0% village: 10.2%
- Percentage of females in healthcare practitioners and technical occupations:
Here: 16.1% village: 9.5%
- Percentage of females in service occupations:
Here: 8.8% village: 27.7%
- Percentage of females in sales and office occupations:
Here: 26.6% village: 25.9%
Education in this neighborhood (subdivision or community):
- Percentage of people 3 years and older in K-12 schools:
Fairmont Park: 17.4% Johnson City: 12.9%
- Percentage of people 3 years and older in undergraduate colleges:
Fairmont Park: 5.3% Johnson City: 6.4%
- Percentage of people 3 years and older in grad. or professional schools:
Fairmont Park: 5.1% Johnson City: 3.0%
- Percentage of students K-12 enrolled in private schools:
Fairmont Park: 42.8% Johnson City: 2.6%
Percentage of population below poverty level:
| Fairmont Park: | 11.2% |
| Johnson City: | 20.3% |
Median year owner moved in (as recorded in 2022):
| Fairmont Park: | 2003 |
| Johnson City: | 2003 |
Percentage of married-couple families with both working:
| Fairmont Park: | 86.8% |
| Johnson City: | 71.2% |
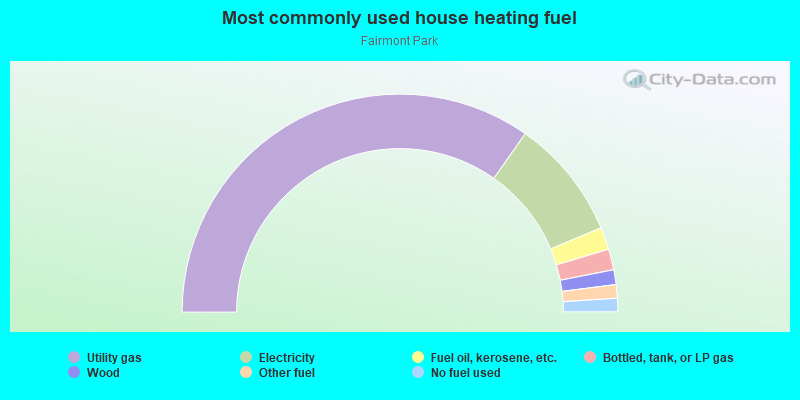
- 69.5%Utility gas
- 17.9%Electricity
- 3.3%Fuel oil, kerosene, etc.
- 3.1%Bottled, tank, or LP gas
- 2.2%Wood
- 2.0%Other fuel
- 2.0%No fuel used
Highways in this neighborhood:
State Hwy 17C
Length: 0.88 miles
Direction: E-W
Direction: E-W
State Hwy 17
Length: 0.75 miles
Direction: E-W
Direction: E-W
Main St (State Hwy 17C)
Length: 0.29 miles
Direction: E-W
Direction: E-W
Roads and streets:
Robinson Hill Rd
Length: 3.57 miles
Directions: E-W, N-S, SE-NW, SW-NE
Address range: 840 to 1599
Directions: E-W, N-S, SE-NW, SW-NE
Address range: 840 to 1599
Watson Blvd (Co Rd 56)
Length: 1.42 miles
Directions: E-W, N-S, SW-NE
Address range: 3900 to 4499
Directions: E-W, N-S, SW-NE
Address range: 3900 to 4499
Country Club Rd
Length: 0.59 miles
Directions: E-W, SE-NW
Address range: 3800 to 3875
Directions: E-W, SE-NW
Address range: 3800 to 3875
Eagle Dr
Length: 0.29 miles
Directions: E-W, N-S, SW-NE
Address range: 1 to 53
Directions: E-W, N-S, SW-NE
Address range: 1 to 53
Barton Ave
Length: 0.25 miles
Direction: N-S
Address range: 1 to 40
Direction: N-S
Address range: 1 to 40
Oak St
Length: 0.24 miles
Directions: N-S, SW-NE
Address range: 1 to 40
Directions: N-S, SW-NE
Address range: 1 to 40
Beech St
Length: 0.22 miles
Directions: E-W, SE-NW
Address range: 1 to 102
Directions: E-W, SE-NW
Address range: 1 to 102
Poplar St
Length: 0.21 miles
Directions: N-S, SE-NW
Address range: 1 to 41
Directions: N-S, SE-NW
Address range: 1 to 41
Woodland Ave
Length: 0.18 miles
Direction: SW-NE
Address range: 1 to 40
Direction: SW-NE
Address range: 1 to 40
Birch St
Length: 0.15 miles
Direction: SW-NE
Address range: 1 to 40
Direction: SW-NE
Address range: 1 to 40
Grays Xing
Length: 0.05 miles
Directions: N-S, SE-NW, SW-NE
Directions: N-S, SE-NW, SW-NE
Sycamore St
Length: 0.05 miles
Direction: SE-NW
Address range: 1 to 99
Direction: SE-NW
Address range: 1 to 99
Railroad features:
Norfolk-Southern RR
Length: 1.03 miles
Direction: E-W
Direction: E-W
Southern Tier
Length: 1.00 miles
Direction: E-W
Direction: E-W