Evergreen neighborhood in Tempe, Arizona (AZ), 85282 detailed profile
Settings
X


Business Search - 14 Million verified businesses
Area: 0.194 square miles
Population: 679
Population density:
| Evergreen: | 3,493 people per square mile |
| Tempe: | 4,641 people per square mile |

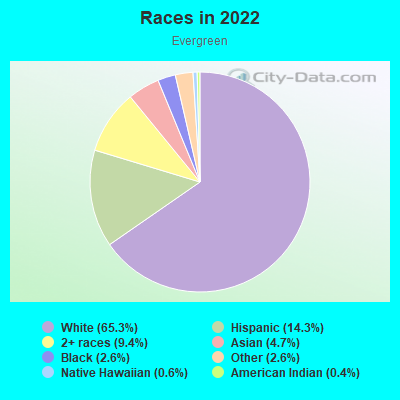
- 44665.3%White
- 9814.3%Hispanic or Latino
- 649.4%Two or more races
- 324.7%Asian
- 182.6%Black
- 182.6%Some other race
- 40.6%Native Hawaiian and Other
Pacific Islander - 30.4%American Indian
Median household income in 2022:
| Evergreen: | $92,484 |
| Tempe: | $76,007 |
Distribution of median household income
![Distribution of median household income]()
- 13Less than $10,000
- 31$10,000 to $19,999
- 17$20,000 to $29,999
- 45$30,000 to $39,999
- 24$40,000 to $49,999
- 21$50,000 to $59,999
- 23$60,000 to $74,999
- 43$75,000 to $99,999
- 41$100,000 to $124,999
- 20$125,000 to $149,999
- 50$150,000 to $199,999
- 30$200,000 or more

Distribution of owner-occupied house/condo value
![Distribution of owner-occupied house/condo value]()
- 7Less than $50,000
- 31$100,000 to $149,999
- 11$150,000 to $199,999
- 5$200,000 to $249,999
- 17$250,000 to $299,999
- 108$300,000 to $399,999
- 69$400,000 to $499,999
- 20$500,000 to $749,999
- 7$750,000 to $999,999

Distribution of rent paid by renters
![Distribution of rent paid by renters]()
- 7$100 to $199
- 5$200 to $299
- 18$300 to $399
- 7$400 to $499
- 13$600 to $699
- 25$700 to $799
- 49$800 to $899
- 36$900 to $999
- 17$1,000 to $1,249
- 20$1,250 to $1,499
- 5$1,500 to $1,999
- 152$2,000 or more

Median rent in 2022:
| Evergreen: | $2,029 |
| Tempe: | $1,566 |
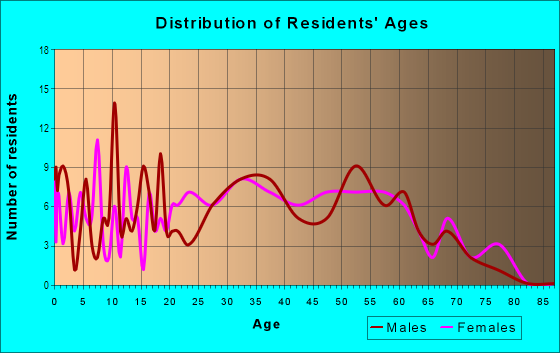
| Males: | 375 |
| Females: | 304 |
Males:
| This neighborhood: | 38.2 years |
| Whole city: | 28.9 years |
| This neighborhood: | 58.2 years |
| Whole city: | 30.5 years |
Average household size:
| Evergreen: | 2.1 people |
| Tempe: | 2.3 people |
Percentage of family households:
| Evergreen: | 50.5% |
| Tempe: | 36.3% |
| Here: | 53.0% |
| Tempe: | 32.6% |
Percentage of married-couple families with children (among all households):
| Evergreen: | 26.9% |
| Tempe: | 26.9% |
Percentage of single-mother households (among all households):
| Evergreen: | 8.5% |
| Tempe: | 8.3% |
Percentage of never married males 15 years old and over:
Percentage of never married females 15 years old and over:
| Evergreen: | 26.3% |
| Tempe: | 32.9% |
Percentage of never married females 15 years old and over:
| Evergreen: | 11.5% |
| city: | 21.7% |
Percentage of people that speak English not well or not at all:
| Evergreen: | 2.8% |
| Tempe: | 2.0% |
Percentage of people born in this state:
Percentage of people born in another U.S. state:
Percentage of native residents but born outside the U.S.:
Percentage of foreign born residents:
| Here: | 35.5% |
| Tempe: | 39.3% |
Percentage of people born in another U.S. state:
| Evergreen: | 57.6% |
| Tempe: | 46.0% |
Percentage of native residents but born outside the U.S.:
| Here: | 1.2% |
| city: | 1.8% |
Percentage of foreign born residents:
| Here: | 5.7% |
| Tempe: | 12.9% |
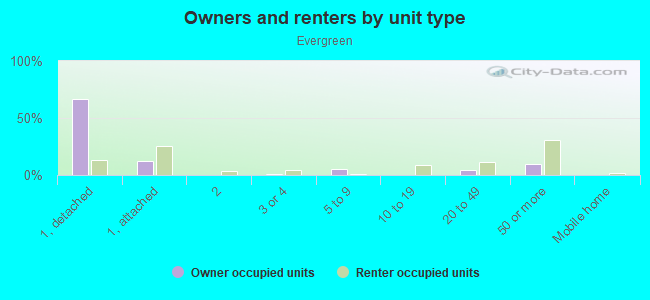
Owner-occupied
Renter-occupied

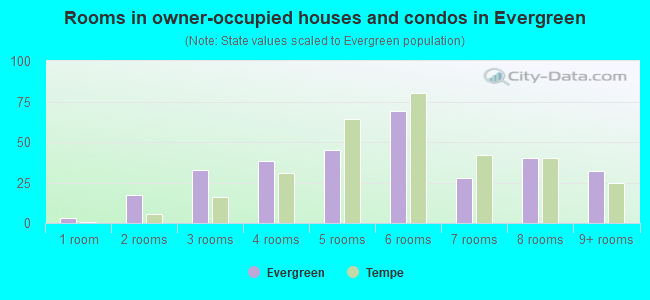
- Rooms in owner-occupied houses and condos in Evergreen
- 31 room
- 172 rooms
- 333 rooms
- 384 rooms
- 455 rooms
- 696 rooms
- 287 rooms
- 408 rooms
- 329+ rooms
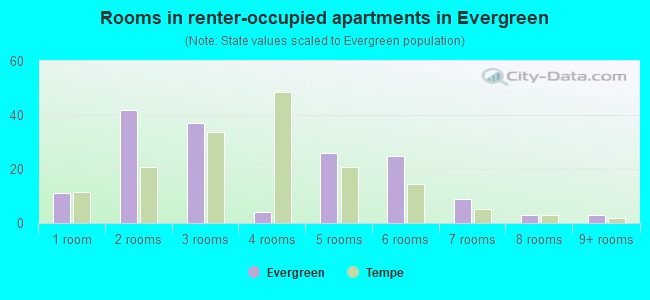
- Rooms in renter-occupied apartments in Evergreen
- 111 room
- 422 rooms
- 373 rooms
- 44 rooms
- 265 rooms
- 256 rooms
- 97 rooms
- 38 rooms
- 39+ rooms
Owner-occupied
Renter-occupied
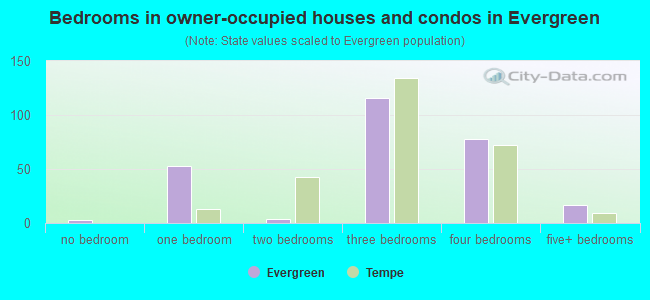
- Bedrooms in owner-occupied houses and condos in Evergreen
- 3no bedroom
- 531 bedroom
- 42 bedrooms
- 1163 bedrooms
- 784 bedrooms
- 175+ bedrooms
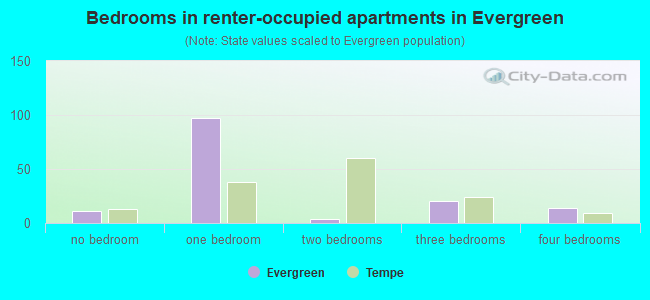
- Bedrooms in renter-occupied apartments in Evergreen
- 11no bedroom
- 971 bedroom
- 42 bedrooms
- 203 bedrooms
- 144 bedrooms
- 05+ bedrooms
Average number of cars or other vehicles available in houses/condos:
Average number of cars or other vehicles available in apartments:
| This neighborhood: | 2.2 |
| Tempe: | 2.0 |
Average number of cars or other vehicles available in apartments:
| Here: | 2.2 |
| city: | 1.6 |
Percentage of units with a mortgage:
| Evergreen: | 75.7% |
| Tempe: | 69.2% |
Average estimated value of detached houses in 2022 (97.3% of all units):
| Evergreen: | $391,633 |
| Tempe: | $535,475 |
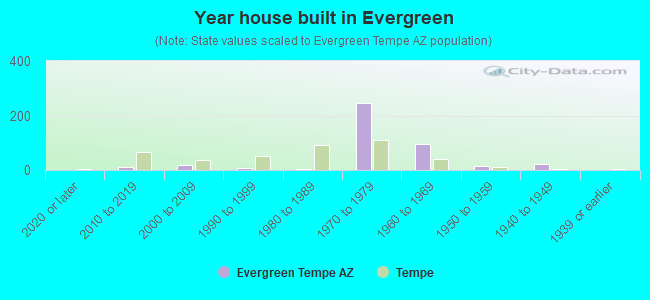
- Year house built in Evergreen
- 02020 or later
- 122010 to 2019
- 172000 to 2009
- 61990 to 1999
- 51980 to 1989
- 2461970 to 1979
- 961960 to 1969
- 151950 to 1959
- 211940 to 1949
- 01939 or earlier
City-data.com crime index for city in 2020 (higher means more crime):
| City: | 347.1 |
| U.S. average: | 219.5 |
Travel time to work (commute)
![Travel time to work (commute)]()
- 1Less than 5 minutes
- 195 to 9 minutes
- 1910 to 14 minutes
- 3115 to 19 minutes
- 4220 to 24 minutes
- 4025 to 29 minutes
- 3130 to 34 minutes
- 935 to 39 minutes
- 340 to 44 minutes
- 845 to 59 minutes
- 1860 to 89 minutes
- 990 or more minutes

Means of transportation to work
![Means of transportation to work]()
- 59.2%222Drove a car alone
- 9.3%35Carpooled
- 1.6%6Bus
- 1.9%7Light rail, streetcar or trolley
- 1.1%4Motorcycle
- 6.9%26Bicycle
- 2.4%9Walked
- 1.6%6Other means
- 14.7%55Worked at home

Time leaving home to go to work
![Time leaving home to go to work]()
- 1512:00 a.m. to 4:59 a.m.
- 395:00 a.m. to 5:29 a.m.
- 75:30 a.m. to 5:59 a.m.
- 156:00 a.m. to 6:29 a.m.
- 146:30 a.m. to 6:59 a.m.
- 527:00 a.m. to 7:29 a.m.
- 267:30 a.m. to 7:59 a.m.
- 348:00 a.m. to 8:29 a.m.
- 28:30 a.m. to 8:59 a.m.
- 119:00 a.m. to 9:59 a.m.
- 510:00 a.m. to 10:59 a.m.
- 511:00 a.m. to 11:59 a.m.
- 2312:00 p.m. to 3:59 p.m.
- 54:00 p.m. to 11:59 p.m.

Occupations of males:
- Percentage of males in management occupations (except farmers):
Here: 11.2% city: 10.2%
- Percentage of males in business and financial operations occupations:
Here: 4.6% city: 6.5%
- Percentage of males in computer and mathematical occupations:
Here: 5.4% city: 8.4%
- Percentage of males in architecture and engineering occupations:
Here: 11.1% city: 5.0%
- Percentage of males in legal occupations:
Here: 3.6% city: 1.1%
- Percentage of males in education, training, and library occupations:
Here: 4.4% city: 6.1%
- Percentage of males in arts, design, entertainment, sports, and media occupations:
Here: 1.4% city: 2.8%
- Percentage of males in service occupations:
Here: 18.2% city: 14.4%
- Percentage of males in sales and office occupations:
Here: 19.0% city: 19.0%
- Percentage of males in farming, fishing, and forestry occupations:
Here: 2.8% city: 0.0%
- Percentage of males in production occupations:
Here: 2.7% city: 4.4%
- Percentage of males in transportation occupations:
Here: 2.6% city: 3.9%
- Percentage of males in material moving occupations:
Here: 4.6% city: 3.5%
Occupations of females:
- Percentage of females in management occupations (except farmers):
Here: 14.9% city: 7.5%
- Percentage of females in business and financial operations occupations:
Here: 10.9% city: 9.3%
- Percentage of females in community and social services occupations:
Here: 2.0% city: 3.4%
- Percentage of females in education, training, and library occupations:
Here: 12.7% city: 12.0%
- Percentage of females in healthcare practitioners and technical occupations:
Here: 2.6% city: 7.4%
- Percentage of females in service occupations:
Here: 21.7% city: 18.9%
- Percentage of females in sales and office occupations:
Here: 34.9% city: 26.9%
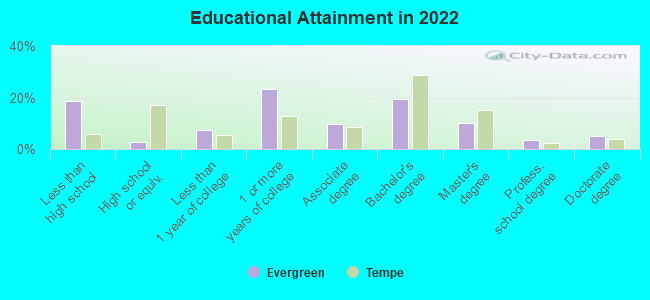
Education in this neighborhood (subdivision or community):
- Percentage of people 3 years and older in K-12 schools:
Evergreen: 19.1% Tempe: 12.5%
- Percentage of people 3 years and older in undergraduate colleges:
Evergreen: 4.1% Tempe: 15.4%
- Percentage of people 3 years and older in grad. or professional schools:
Evergreen: 2.6% Tempe: 6.3%
- Percentage of students K-12 enrolled in private schools:
Evergreen: 5.6% Tempe: 9.2%
Percentage of population below poverty level:
| Evergreen: | 6.5% |
| Tempe: | 15.0% |
Median year owner moved in (as recorded in 2022):
Median year renter moved in (as recorded in 2022):
| Evergreen: | 2008 |
| Tempe: | 2013 |
Median year renter moved in (as recorded in 2022):
| Evergreen: | 2015 |
| Tempe: | 2022 |
Percentage of married-couple families with both working:
| Evergreen: | 115.7% |
| Tempe: | 77.6% |
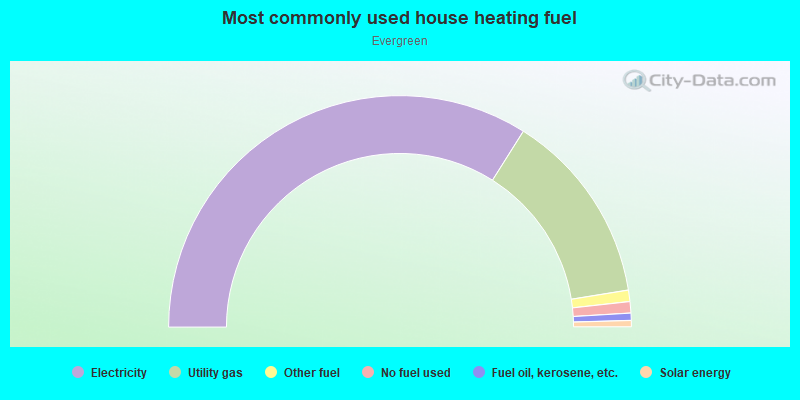
- 67.9%Electricity
- 27.0%Utility gas
- 1.6%Other fuel
- 1.6%No fuel used
- 1.0%Fuel oil, kerosene, etc.
- 0.9%Solar energy
Roads and streets:
S Evergreen Rd
Length: 0.53 miles
Directions: N-S, SE-NW
Address range: 2800 to 3299
Directions: N-S, SE-NW
Address range: 2800 to 3299
S George Dr
Length: 0.49 miles
Directions: N-S, SE-NW
Address range: 2750 to 3299
Directions: N-S, SE-NW
Address range: 2750 to 3299
E Geneva Dr
Length: 0.47 miles
Direction: E-W
Address range: 2200 to 2599
Direction: E-W
Address range: 2200 to 2599
E Loyola Dr
Length: 0.35 miles
Directions: E-W, SW-NE
Address range: 2300 to 2599
Directions: E-W, SW-NE
Address range: 2300 to 2599
E del Rio Dr
Length: 0.32 miles
Directions: E-W, SW-NE
Address range: 2300 to 2699
Directions: E-W, SW-NE
Address range: 2300 to 2699
E Huntington Dr
Length: 0.31 miles
Direction: E-W
Address range: 2400 to 2599
Direction: E-W
Address range: 2400 to 2599
S Cottonwood Dr
Length: 0.30 miles
Directions: N-S, SW-NE
Address range: 2800 to 3199
Directions: N-S, SW-NE
Address range: 2800 to 3199
E Southern Ave
Length: 0.30 miles
Direction: E-W
Address range: 2400 to 2599
Direction: E-W
Address range: 2400 to 2599
E Balboa Dr
Length: 0.26 miles
Direction: E-W
Address range: 2400 to 2695
Direction: E-W
Address range: 2400 to 2695
E Wesleyan Dr
Length: 0.24 miles
Directions: E-W, N-S
Address range: 2400 to 2599
Directions: E-W, N-S
Address range: 2400 to 2599
E Cairo Dr
Length: 0.19 miles
Directions: E-W, SW-NE
Address range: 2300 to 2499
Directions: E-W, SW-NE
Address range: 2300 to 2499
E Fairmont Dr
Length: 0.17 miles
Directions: E-W, SW-NE
Address range: 2400 to 2599
Directions: E-W, SW-NE
Address range: 2400 to 2599
S Allred Dr
Length: 0.15 miles
Directions: N-S, SE-NW
Address range: 2800 to 3299
Directions: N-S, SE-NW
Address range: 2800 to 3299
S Lebanon Ln
Length: 0.13 miles
Direction: N-S
Address range: 3100 to 3299
Direction: N-S
Address range: 3100 to 3299
Tempe Canal
Length: 0.08 miles
Direction: SE-NW
Direction: SE-NW
S Birchett Dr
Length: 0.05 miles
Direction: N-S
Address range: 3200 to 3299
Direction: N-S
Address range: 3200 to 3299
Other features:
Tempe Cnl
Length: 0.09 miles
Direction: SE-NW
Direction: SE-NW