El Encanto neighborhood in Tucson, Arizona (AZ), 85716 detailed profile
Settings
X


Business Search - 14 Million verified businesses
Area: 0.187 square miles
Population: 722
Population density:
| El Encanto: | 3,857 people per square mile |
| Tucson: | 2,808 people per square mile |

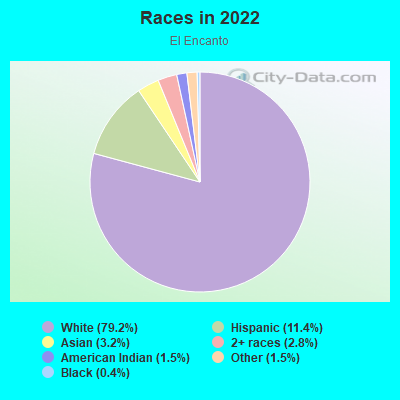
- 58679.2%White
- 8411.4%Hispanic or Latino
- 243.2%Asian
- 212.8%Two or more races
- 111.5%American Indian
- 111.5%Some other race
- 30.4%Black
Median household income in 2022:
| El Encanto: | $102,236 |
| Tucson: | $51,281 |
Distribution of median household income
![Distribution of median household income]()
- 6Less than $10,000
- 53$10,000 to $19,999
- 31$20,000 to $29,999
- 39$30,000 to $39,999
- 34$40,000 to $49,999
- 17$50,000 to $59,999
- 34$60,000 to $74,999
- 31$75,000 to $99,999
- 55$100,000 to $124,999
- 28$125,000 to $149,999
- 31$150,000 to $199,999
- 56$200,000 or more

Distribution of owner-occupied house/condo value
![Distribution of owner-occupied house/condo value]()
- 7Less than $50,000
- 21$100,000 to $149,999
- 19$150,000 to $199,999
- 12$200,000 to $249,999
- 20$250,000 to $299,999
- 25$300,000 to $399,999
- 21$400,000 to $499,999
- 50$500,000 to $749,999
- 27$750,000 to $999,999
- 22$1,000,000 or more

Distribution of rent paid by renters
![Distribution of rent paid by renters]()
- 4$400 to $499
- 10$600 to $699
- 6$700 to $799
- 63$800 to $899
- 50$900 to $999
- 25$1,000 to $1,249
- 18$1,250 to $1,499
- 9$1,500 to $1,999
- 2$2,000 or more

Median rent in 2022:
| El Encanto: | $924 |
| Tucson: | $912 |
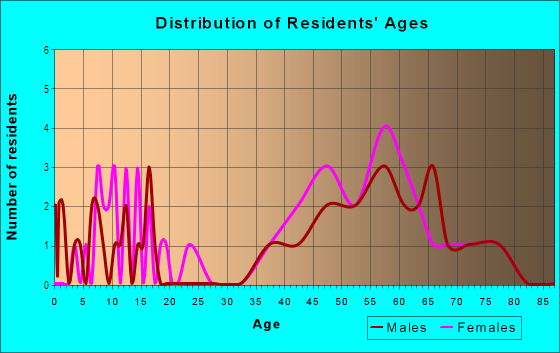
| Males: | 305 |
| Females: | 417 |
Males:
| This neighborhood: | 46.2 years |
| Whole city: | 33.1 years |
| This neighborhood: | 40.7 years |
| Whole city: | 34.8 years |
Average household size:
| El Encanto: | 2.1 people |
| Tucson: | 2.3 people |
Percentage of family households:
| El Encanto: | 28.4% |
| Tucson: | 37.6% |
| Here: | 33.4% |
| Tucson: | 31.5% |
Percentage of married-couple families with children (among all households):
| El Encanto: | 43.7% |
| Tucson: | 24.4% |
Percentage of single-mother households (among all households):
| El Encanto: | 7.2% |
| Tucson: | 12.1% |
Percentage of never married males 15 years old and over:
Percentage of never married females 15 years old and over:
| El Encanto: | 15.8% |
| Tucson: | 24.8% |
Percentage of never married females 15 years old and over:
| El Encanto: | 26.6% |
| city: | 20.6% |
Percentage of people that speak English not well or not at all:
| El Encanto: | 0.9% |
| Tucson: | 4.5% |
Percentage of people born in this state:
Percentage of people born in another U.S. state:
Percentage of native residents but born outside the U.S.:
Percentage of foreign born residents:
| Here: | 27.8% |
| Tucson: | 46.2% |
Percentage of people born in another U.S. state:
| El Encanto: | 53.5% |
| Tucson: | 38.2% |
Percentage of native residents but born outside the U.S.:
| Here: | 5.0% |
| city: | 1.8% |
Percentage of foreign born residents:
| Here: | 13.6% |
| Tucson: | 13.7% |
Owner-occupied
Renter-occupied

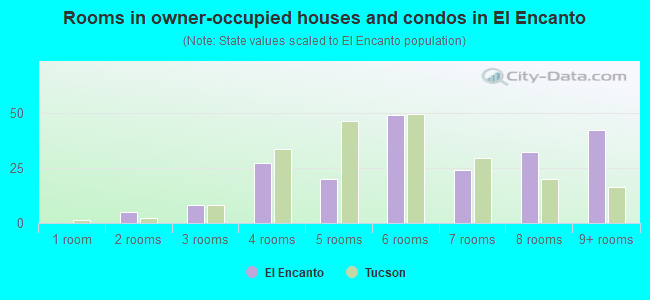
- Rooms in owner-occupied houses and condos in El Encanto
- 01 room
- 52 rooms
- 83 rooms
- 274 rooms
- 205 rooms
- 496 rooms
- 247 rooms
- 328 rooms
- 429+ rooms

- Rooms in renter-occupied apartments in El Encanto
- 581 room
- 342 rooms
- 303 rooms
- 324 rooms
- 215 rooms
- 106 rooms
- 37 rooms
- 08 rooms
- 09+ rooms
Owner-occupied
Renter-occupied
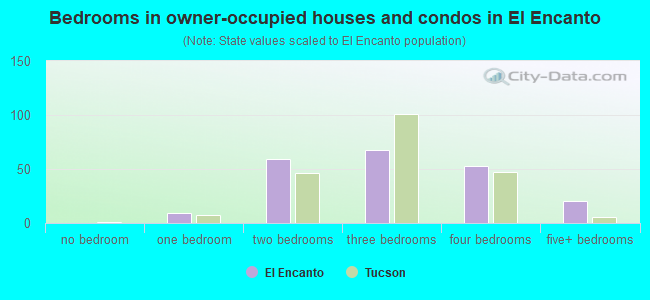
- Bedrooms in owner-occupied houses and condos in El Encanto
- 0no bedroom
- 91 bedroom
- 592 bedrooms
- 683 bedrooms
- 534 bedrooms
- 205+ bedrooms
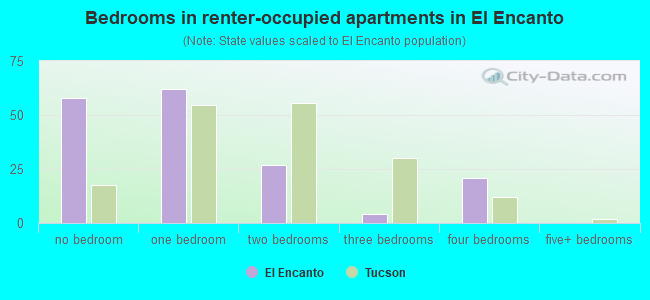
- Bedrooms in renter-occupied apartments in El Encanto
- 58no bedroom
- 621 bedroom
- 272 bedrooms
- 43 bedrooms
- 214 bedrooms
- 05+ bedrooms
Average number of cars or other vehicles available in houses/condos:
Average number of cars or other vehicles available in apartments:
| This neighborhood: | 1.6 |
| Tucson: | 1.9 |
Average number of cars or other vehicles available in apartments:
| Here: | 1.3 |
| city: | 1.3 |
Percentage of units with a mortgage:
| El Encanto: | 62.9% |
| Tucson: | 59.8% |
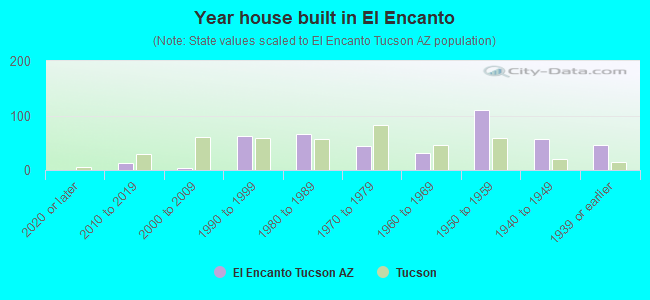
- Year house built in El Encanto
- 02020 or later
- 132010 to 2019
- 32000 to 2009
- 621990 to 1999
- 661980 to 1989
- 441970 to 1979
- 321960 to 1969
- 1111950 to 1959
- 561940 to 1949
- 461939 or earlier

City-data.com crime index for city in 2020 (higher means more crime):
| City: | 397.7 |
| U.S. average: | 219.5 |
Travel time to work (commute)
![Travel time to work (commute)]()
- 6Less than 5 minutes
- 255 to 9 minutes
- 7510 to 14 minutes
- 11115 to 19 minutes
- 4020 to 24 minutes
- 1525 to 29 minutes
- 1330 to 34 minutes
- 345 to 59 minutes
- 660 to 89 minutes

Means of transportation to work
![Means of transportation to work]()
- 58.5%250Drove a car alone
- 2.8%12Carpooled
- 2.1%9Bus
- 0.7%3Taxi
- 0.9%4Motorcycle
- 18.7%80Bicycle
- 1.6%7Walked
- 3.0%13Other means
- 14.0%60Worked at home

Time leaving home to go to work
![Time leaving home to go to work]()
- 35:00 a.m. to 5:29 a.m.
- 75:30 a.m. to 5:59 a.m.
- 56:00 a.m. to 6:29 a.m.
- 46:30 a.m. to 6:59 a.m.
- 417:00 a.m. to 7:29 a.m.
- 827:30 a.m. to 7:59 a.m.
- 358:00 a.m. to 8:29 a.m.
- 498:30 a.m. to 8:59 a.m.
- 279:00 a.m. to 9:59 a.m.
- 3110:00 a.m. to 10:59 a.m.
- 111:00 a.m. to 11:59 a.m.
- 212:00 p.m. to 3:59 p.m.
- 54:00 p.m. to 11:59 p.m.

Occupations of males:
- Percentage of males in management occupations (except farmers):
Here: 13.3% city: 7.7%
- Percentage of males in business and financial operations occupations:
Here: 7.9% city: 3.8%
- Percentage of males in computer and mathematical occupations:
Here: 3.2% city: 4.5%
- Percentage of males in architecture and engineering occupations:
Here: 4.6% city: 4.0%
- Percentage of males in life, physical, and social science occupations:
Here: 7.2% city: 1.1%
- Percentage of males in community and social services occupations:
Here: 2.6% city: 1.0%
- Percentage of males in legal occupations:
Here: 10.2% city: 0.6%
- Percentage of males in education, training, and library occupations:
Here: 9.6% city: 4.7%
- Percentage of males in arts, design, entertainment, sports, and media occupations:
Here: 5.1% city: 1.6%
- Percentage of males in healthcare practitioners and technical occupations:
Here: 5.1% city: 3.0%
- Percentage of males in sales and office occupations:
Here: 19.3% city: 16.2%
- Percentage of males in construction, extraction, and maintenance occupations:
Here: 2.8% city: 10.5%
- Percentage of males in production occupations:
Here: 1.9% city: 5.2%
- Percentage of males in transportation occupations:
Here: 7.2% city: 4.0%
- Percentage of males in material moving occupations:
Here: 3.3% city: 5.3%
Occupations of females:
- Percentage of females in management occupations (except farmers):
Here: 14.4% city: 8.2%
- Percentage of females in business and financial operations occupations:
Here: 2.2% city: 4.7%
- Percentage of females in computer and mathematical occupations:
Here: 4.4% city: 1.6%
- Percentage of females in life, physical, and social science occupations:
Here: 5.7% city: 1.1%
- Percentage of females in legal occupations:
Here: 3.0% city: 1.0%
- Percentage of females in education, training, and library occupations:
Here: 28.0% city: 8.8%
- Percentage of females in arts, design, entertainment, sports, and media occupations:
Here: 7.6% city: 2.6%
- Percentage of females in healthcare practitioners and technical occupations:
Here: 7.4% city: 8.3%
- Percentage of females in service occupations:
Here: 9.4% city: 24.9%
- Percentage of females in sales and office occupations:
Here: 17.3% city: 29.9%
Percentage of people 16-64 in Armed Forces:
| El Encanto: | 0.2% |
| Tucson: | 1.8% |
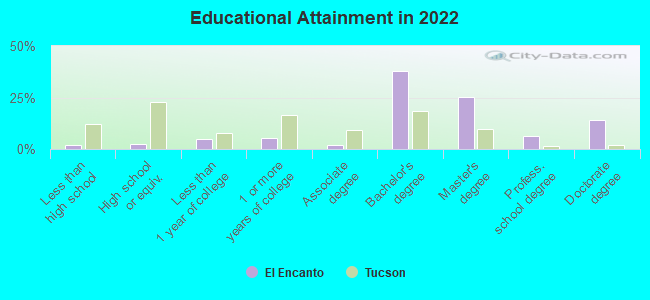
Education in this neighborhood (subdivision or community):
- Percentage of people 3 years and older in K-12 schools:
El Encanto: 11.7% Tucson: 15.1%
- Percentage of people 3 years and older in undergraduate colleges:
El Encanto: 15.2% Tucson: 9.7%
- Percentage of people 3 years and older in grad. or professional schools:
El Encanto: 10.5% Tucson: 2.1%
- Percentage of students K-12 enrolled in private schools:
El Encanto: 22.6% Tucson: 9.2%
Percentage of population below poverty level:
| El Encanto: | 18.4% |
| Tucson: | 19.2% |
Median year owner moved in (as recorded in 2022):
Median year renter moved in (as recorded in 2022):
| El Encanto: | 2011 |
| Tucson: | 2012 |
Median year renter moved in (as recorded in 2022):
| El Encanto: | 2019 |
| Tucson: | 2020 |
Percentage of married-couple families with both working:
| El Encanto: | 85.4% |
| Tucson: | 63.0% |
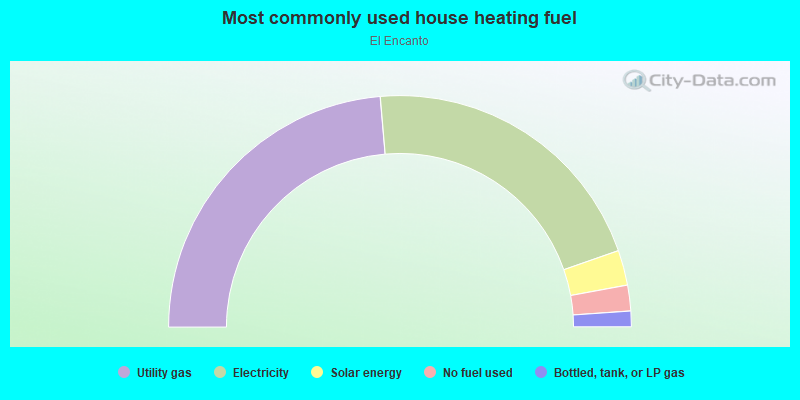
- 47.3%Utility gas
- 42.0%Electricity
- 4.9%Solar energy
- 3.6%No fuel used
- 2.2%Bottled, tank, or LP gas
Roads and streets:
E Cll Primorosa
Length: 0.45 miles
Directions: E-W, N-S, SE-NW, SW-NE
Address range: 1 to 102
Directions: E-W, N-S, SE-NW, SW-NE
Address range: 1 to 102
N Jones Ave
Length: 0.43 miles
Direction: N-S
Address range: 1 to 539
Direction: N-S
Address range: 1 to 539
N Cam Miramonte
Length: 0.40 miles
Directions: N-S, SE-NW, SW-NE
Address range: 1 to 129
Directions: N-S, SE-NW, SW-NE
Address range: 1 to 129
N Cam Espanol
Length: 0.40 miles
Directions: N-S, SE-NW, SW-NE
Address range: 1 to 125
Directions: N-S, SE-NW, SW-NE
Address range: 1 to 125
E Cll Resplendor
Length: 0.40 miles
Directions: E-W, SE-NW
Address range: 1 to 121
Directions: E-W, SE-NW
Address range: 1 to 121
E Broadway Blvd
Length: 0.35 miles
Direction: E-W
Address range: 3200 to 3399
Direction: E-W
Address range: 3200 to 3399
N Cll Encanto
Length: 0.29 miles
Direction: E-W
Address range: 1 to 100
Direction: E-W
Address range: 1 to 100
E Cll Claravista
Length: 0.26 miles
Directions: E-W, N-S, SE-NW, SW-NE
Address range: 1 to 99
Directions: E-W, N-S, SE-NW, SW-NE
Address range: 1 to 99
E Cll Belleza
Length: 0.17 miles
Direction: E-W
Address range: 1 to 99
Direction: E-W
Address range: 1 to 99
E Cll Encanto
Length: 0.16 miles
Directions: E-W, N-S, SE-NW, SW-NE
Address range: 1 to 105
Directions: E-W, N-S, SE-NW, SW-NE
Address range: 1 to 105
E Cll de Felicidad
Length: 0.14 miles
Directions: E-W, SE-NW, SW-NE
Address range: 1 to 99
Directions: E-W, SE-NW, SW-NE
Address range: 1 to 99
E Cll de Amistad
Length: 0.14 miles
Directions: E-W, SE-NW, SW-NE
Address range: 1 to 99
Directions: E-W, SE-NW, SW-NE
Address range: 1 to 99
E Cll Conquista
Length: 0.07 miles
Direction: E-W
Address range: 1 to 99
Direction: E-W
Address range: 1 to 99
E Cll Mirasol
Length: 0.07 miles
Direction: E-W
Address range: 1 to 99
Direction: E-W
Address range: 1 to 99