East Lynne (Saratoga) neighborhood in Norfolk, Virginia (VA), 23518 detailed profile
Settings
X


Business Search - 14 Million verified businesses
Area: 0.207 square miles
Population: 308
Population density:
| East Lynne (Saratoga): | 1,488 people per square mile |
| Norfolk: | 4,337 people per square mile |

- 23978.4%White
- 4113.4%Black
- 165.2%Hispanic or Latino
- 62.0%Asian
- 31.0%Two or more races

Median household income in 2022:
| East Lynne (Saratoga): | $87,814 |
| Norfolk: | $61,090 |
Distribution of median household income
![Distribution of median household income]()
- 3Less than $10,000
- 30$10,000 to $19,999
- 14$20,000 to $29,999
- 19$30,000 to $39,999
- 23$40,000 to $49,999
- 12$50,000 to $59,999
- 18$60,000 to $74,999
- 11$75,000 to $99,999
- 36$100,000 to $124,999
- 11$125,000 to $149,999
- 12$150,000 to $199,999
- 20$200,000 or more

Distribution of owner-occupied house/condo value
![Distribution of owner-occupied house/condo value]()
- 6Less than $50,000
- 1$50,000 to $99,999
- 22$100,000 to $149,999
- 29$150,000 to $199,999
- 22$200,000 to $249,999
- 30$250,000 to $299,999
- 16$300,000 to $399,999
- 10$400,000 to $499,999
- 4$500,000 to $749,999
- 6$750,000 to $999,999
- 2$1,000,000 or more

Distribution of rent paid by renters
![Distribution of rent paid by renters]()
- 4$400 to $499
- 2$500 to $599
- 8$600 to $699
- 28$700 to $799
- 5$800 to $899
- 5$900 to $999
- 7$1,000 to $1,249
- 23$1,250 to $1,499
- 10$1,500 to $1,999
- 16$2,000 or more

Median rent in 2022:
| East Lynne (Saratoga): | $1,228 |
| Norfolk: | $1,035 |
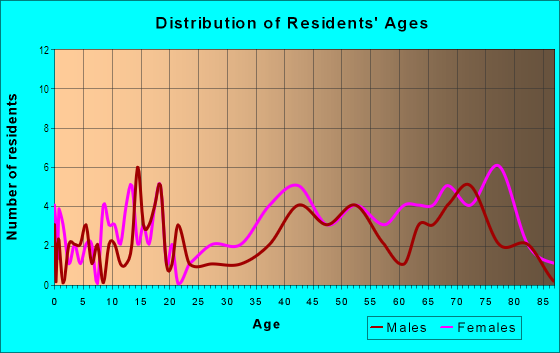
| Males: | 154 |
| Females: | 153 |
Males:
| This neighborhood: | 44.4 years |
| Whole city: | 31.3 years |
| This neighborhood: | 45.7 years |
| Whole city: | 34.4 years |
Average household size:
| East Lynne (Saratoga): | 2.2 people |
| Norfolk: | 2.3 people |
Percentage of family households:
| East Lynne (Saratoga): | 39.3% |
| Norfolk: | 41.3% |
| Here: | 56.3% |
| Norfolk: | 31.7% |
Percentage of married-couple families with children (among all households):
| East Lynne (Saratoga): | 45.6% |
| Norfolk: | 20.2% |
Percentage of single-mother households (among all households):
| East Lynne (Saratoga): | 8.9% |
| Norfolk: | 16.3% |
Percentage of never married males 15 years old and over:
Percentage of never married females 15 years old and over:
| East Lynne (Saratoga): | 11.2% |
| Norfolk: | 25.4% |
Percentage of never married females 15 years old and over:
| East Lynne (Saratoga): | 7.2% |
| city: | 20.5% |
Percentage of people that speak English not well or not at all:
| East Lynne (Saratoga): | 1.3% |
| Norfolk: | 1.4% |
Percentage of people born in this state:
Percentage of people born in another U.S. state:
Percentage of native residents but born outside the U.S.:
Percentage of foreign born residents:
| Here: | 36.1% |
| Norfolk: | 51.1% |
Percentage of people born in another U.S. state:
| East Lynne (Saratoga): | 53.8% |
| Norfolk: | 40.8% |
Percentage of native residents but born outside the U.S.:
| Here: | 2.9% |
| city: | 1.6% |
Percentage of foreign born residents:
| Here: | 7.3% |
| Norfolk: | 6.5% |

Owner-occupied
Renter-occupied


- Rooms in owner-occupied houses and condos in East Lynne <
> - 31 room
- 02 rooms
- 03 rooms
- 34 rooms
- 75 rooms
- 326 rooms
- 217 rooms
- 138 rooms
- 119+ rooms

- Rooms in renter-occupied apartments in East Lynne <
> - 41 room
- 152 rooms
- 103 rooms
- 34 rooms
- 165 rooms
- 136 rooms
- 67 rooms
- 48 rooms
- 129+ rooms
Owner-occupied
Renter-occupied

- Bedrooms in owner-occupied houses and condos in East Lynne <
> - 3no bedroom
- 01 bedroom
- 32 bedrooms
- 483 bedrooms
- 354 bedrooms
- 165+ bedrooms

- Bedrooms in renter-occupied apartments in East Lynne <
> - 4no bedroom
- 131 bedroom
- 32 bedrooms
- 303 bedrooms
- 34 bedrooms
- 65+ bedrooms
Average number of cars or other vehicles available in houses/condos:
Average number of cars or other vehicles available in apartments:
| This neighborhood: | 2.3 |
| Norfolk: | 2.0 |
Average number of cars or other vehicles available in apartments:
| Here: | 1.8 |
| city: | 1.3 |
Percentage of units with a mortgage:
| East Lynne (Saratoga): | 65.4% |
| Norfolk: | 70.0% |
Average estimated value of detached houses in 2022 (81.7% of all units):
| East Lynne (Saratoga): | $298,588 |
| Norfolk: | $337,508 |

- Year house built in East Lynne <
> - 02020 or later
- 12010 to 2019
- 252000 to 2009
- 51990 to 1999
- 71980 to 1989
- 211970 to 1979
- 751960 to 1969
- 311950 to 1959
- 31940 to 1949
- 01939 or earlier

City-data.com crime index for city in 2020 (higher means more crime):
| City: | 327.9 |
| U.S. average: | 219.5 |
Travel time to work (commute)
![Travel time to work (commute)]()
- 1Less than 5 minutes
- 155 to 9 minutes
- 1610 to 14 minutes
- 2515 to 19 minutes
- 3920 to 24 minutes
- 2025 to 29 minutes
- 3530 to 34 minutes
- 240 to 44 minutes
- 445 to 59 minutes
- 660 to 89 minutes

Means of transportation to work
![Means of transportation to work]()
- 84.2%140Drove a car alone
- 9.6%16Carpooled
- 4.2%7Bus
- 1.8%3Taxi
- 1.2%2Motorcycle
- 0.6%1Walked
- 0.6%1Other means
- 2.4%4Worked at home

Time leaving home to go to work
![Time leaving home to go to work]()
- 1212:00 a.m. to 4:59 a.m.
- 135:00 a.m. to 5:29 a.m.
- 55:30 a.m. to 5:59 a.m.
- 66:00 a.m. to 6:29 a.m.
- 306:30 a.m. to 6:59 a.m.
- 147:00 a.m. to 7:29 a.m.
- 247:30 a.m. to 7:59 a.m.
- 248:00 a.m. to 8:29 a.m.
- 48:30 a.m. to 8:59 a.m.
- 69:00 a.m. to 9:59 a.m.
- 310:00 a.m. to 10:59 a.m.
- 311:00 a.m. to 11:59 a.m.
- 1212:00 p.m. to 3:59 p.m.
- 114:00 p.m. to 11:59 p.m.

Occupations of males:
- Percentage of males in management occupations (except farmers):
Here: 15.5% city: 8.2%
- Percentage of males in business and financial operations occupations:
Here: 12.7% city: 4.4%
- Percentage of males in computer and mathematical occupations:
Here: 5.5% city: 4.2%
- Percentage of males in architecture and engineering occupations:
Here: 3.8% city: 3.7%
- Percentage of males in healthcare practitioners and technical occupations:
Here: 5.8% city: 3.2%
- Percentage of males in service occupations:
Here: 20.7% city: 16.9%
- Percentage of males in sales and office occupations:
Here: 1.8% city: 15.6%
- Percentage of males in farming, fishing, and forestry occupations:
Here: 1.4% city: 0.1%
- Percentage of males in construction, extraction, and maintenance occupations:
Here: 15.1% city: 9.8%
- Percentage of males in production occupations:
Here: 8.2% city: 6.5%
- Percentage of males in material moving occupations:
Here: 6.0% city: 5.3%
Occupations of females:
- Percentage of females in management occupations (except farmers):
Here: 3.8% city: 7.7%
- Percentage of females in business and financial operations occupations:
Here: 12.3% city: 5.2%
- Percentage of females in life, physical, and social science occupations:
Here: 1.4% city: 0.9%
- Percentage of females in community and social services occupations:
Here: 1.8% city: 3.1%
- Percentage of females in education, training, and library occupations:
Here: 40.5% city: 9.1%
- Percentage of females in healthcare practitioners and technical occupations:
Here: 7.0% city: 9.6%
- Percentage of females in service occupations:
Here: 11.1% city: 22.3%
- Percentage of females in sales and office occupations:
Here: 23.7% city: 28.7%
Percentage of people 16-64 in Armed Forces:
| East Lynne (Saratoga): | 14.3% |
| Norfolk: | 15.8% |
Education in this neighborhood (subdivision or community):
- Percentage of people 3 years and older in K-12 schools:
East Lynne (Saratoga): 40.7% Norfolk: 14.3%
- Percentage of people 3 years and older in undergraduate colleges:
East Lynne (Saratoga): 4.9% Norfolk: 8.0%
- Percentage of people 3 years and older in grad. or professional schools:
East Lynne (Saratoga): 3.3% Norfolk: 2.1%
- Percentage of students K-12 enrolled in private schools:
East Lynne (Saratoga): 20.0% Norfolk: 16.2%
Percentage of population below poverty level:
| East Lynne (Saratoga): | 2.7% |
| Norfolk: | 17.7% |
Median year owner moved in (as recorded in 2022):
Median year renter moved in (as recorded in 2022):
| East Lynne (Saratoga): | 1995 |
| Norfolk: | 2013 |
Median year renter moved in (as recorded in 2022):
| East Lynne (Saratoga): | 2017 |
| Norfolk: | 2020 |
Percentage of married-couple families with both working:
| East Lynne (Saratoga): | 115.3% |
| Norfolk: | 65.5% |

- 45.5%Electricity
- 39.9%Utility gas
- 7.1%Other fuel
- 3.7%Fuel oil, kerosene, etc.
- 2.2%Bottled, tank, or LP gas
- 1.7%No fuel used
Highways in this neighborhood:
Azalea Garden Rd (State Rte 192)
Length: 0.72 miles
Directions: N-S, SE-NW, SW-NE
Address range: 6674 to 7895
Directions: N-S, SE-NW, SW-NE
Address range: 6674 to 7895
State Rte 170 (E Little Creek Rd)
Length: 0.31 miles
Direction: E-W
Direction: E-W
Roads and streets:
Leafwood Dr
Length: 0.61 miles
Directions: E-W, N-S, SE-NW
Address range: 7600 to 7799
Directions: E-W, N-S, SE-NW
Address range: 7600 to 7799
Jasper Ct
Length: 0.39 miles
Direction: E-W
Address range: 2400 to 2499
Direction: E-W
Address range: 2400 to 2499
Tullibee Dr
Length: 0.34 miles
Direction: E-W
Address range: 2400 to 2499
Direction: E-W
Address range: 2400 to 2499
Stribling Ln
Length: 0.29 miles
Direction: E-W
Address range: 2400 to 2499
Direction: E-W
Address range: 2400 to 2499
Everglades Rd
Length: 0.24 miles
Direction: SW-NE
Address range: 2400 to 2499
Direction: SW-NE
Address range: 2400 to 2499
Heutte Dr
Length: 0.22 miles
Direction: SW-NE
Address range: 2400 to 2499
Direction: SW-NE
Address range: 2400 to 2499
Blueberry Rd
Length: 0.21 miles
Direction: SW-NE
Address range: 2400 to 2499
Direction: SW-NE
Address range: 2400 to 2499
Mimosa Rd
Length: 0.15 miles
Directions: N-S, SE-NW, SW-NE
Address range: 2400 to 2499
Directions: N-S, SE-NW, SW-NE
Address range: 2400 to 2499
Sea Wolf Dr
Length: 0.13 miles
Directions: E-W, N-S, SE-NW
Address range: 7800 to 7899
Directions: E-W, N-S, SE-NW
Address range: 7800 to 7899
Borb Ave
Length: 0.10 miles
Directions: E-W, N-S, SE-NW, SW-NE
Address range: 7800 to 7899
Directions: E-W, N-S, SE-NW, SW-NE
Address range: 7800 to 7899
Jasper Cir
Length: 0.03 miles
Directions: N-S, SE-NW
Address range: 7800 to 7824
Directions: N-S, SE-NW
Address range: 7800 to 7824