Downtown Woodhaven (Downtown) neighborhood in Trenton, Michigan (MI), 48183 detailed profile
Settings
X


Business Search - 14 Million verified businesses
Area: 0.306 square miles
Population: 1,394
Population density:
| Downtown Woodhaven (Downtown): | 4,556 people per square mile |
| Trenton: | 2,523 people per square mile |

- 1,11980.3%White
- 15010.8%Hispanic or Latino
- 533.8%Asian
- 412.9%Two or more races
- 302.2%Black

Median household income in 2022:
| Downtown Woodhaven (Downtown): | $77,614 |
| Trenton: | $74,267 |
Distribution of median household income
![Distribution of median household income]()
- 5Less than $10,000
- 22$10,000 to $19,999
- 54$20,000 to $29,999
- 62$30,000 to $39,999
- 87$40,000 to $49,999
- 59$50,000 to $59,999
- 71$60,000 to $74,999
- 106$75,000 to $99,999
- 60$100,000 to $124,999
- 109$125,000 to $149,999
- 37$150,000 to $199,999
- 48$200,000 or more

Distribution of owner-occupied house/condo value
![Distribution of owner-occupied house/condo value]()
- 6Less than $50,000
- 14$50,000 to $99,999
- 125$100,000 to $149,999
- 191$150,000 to $199,999
- 149$200,000 to $249,999
- 48$250,000 to $299,999
- 33$300,000 to $399,999
- 18$400,000 to $499,999
- 5$1,000,000 or more

Distribution of rent paid by renters
![Distribution of rent paid by renters]()
- 16$600 to $699
- 75$700 to $799
- 16$800 to $899
- 21$900 to $999
- 8$1,000 to $1,249
- 23$1,250 to $1,499

Median rent in 2022:
| Downtown Woodhaven (Downtown): | $770 |
| Trenton: | $722 |
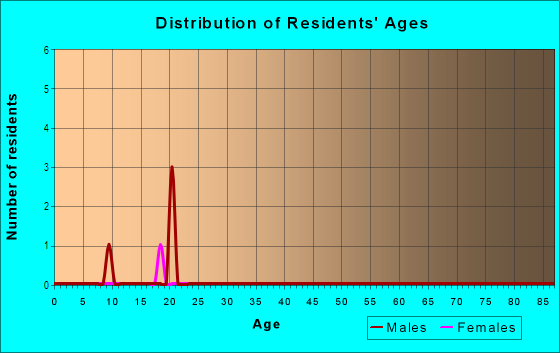
| Males: | 558 |
| Females: | 835 |
Males:
| This neighborhood: | 47.9 years |
| Whole city: | 46.1 years |
| This neighborhood: | 53.6 years |
| Whole city: | 52.8 years |
Average household size:
| Downtown Woodhaven (Downtown): | 1.9 people |
| Trenton: | 2.3 people |
Percentage of family households:
| Downtown Woodhaven (Downtown): | 32.3% |
| Trenton: | 41.2% |
| Here: | 46.7% |
| Trenton: | 45.9% |
Percentage of married-couple families with children (among all households):
| Downtown Woodhaven (Downtown): | 38.8% |
| Trenton: | 31.1% |
Percentage of single-mother households (among all households):
| Downtown Woodhaven (Downtown): | 12.5% |
| Trenton: | 8.9% |
Percentage of never married males 15 years old and over:
Percentage of never married females 15 years old and over:
| Downtown Woodhaven (Downtown): | 9.1% |
| Trenton: | 13.7% |
Percentage of never married females 15 years old and over:
| Downtown Woodhaven (Downtown): | 15.9% |
| city: | 11.4% |
Percentage of people that speak English not well or not at all:
| Downtown Woodhaven (Downtown): | 0.0% |
| Trenton: | 0.2% |
Percentage of people born in this state:
Percentage of people born in another U.S. state:
Percentage of native residents but born outside the U.S.:
Percentage of foreign born residents:
| Here: | 78.2% |
| Trenton: | 84.5% |
Percentage of people born in another U.S. state:
| Downtown Woodhaven (Downtown): | 17.1% |
| Trenton: | 11.0% |
Percentage of native residents but born outside the U.S.:
| Here: | 0.7% |
| city: | 0.8% |
Percentage of foreign born residents:
| Here: | 4.0% |
| Trenton: | 3.7% |

Owner-occupied
Renter-occupied


- Rooms in owner-occupied houses and condos in Downtown Woodhaven <
> - 01 room
- 02 rooms
- 03 rooms
- 494 rooms
- 1285 rooms
- 1516 rooms
- 1277 rooms
- 688 rooms
- 549+ rooms

- Rooms in renter-occupied apartments in Downtown Woodhaven <
> - 01 room
- 52 rooms
- 193 rooms
- 644 rooms
- 385 rooms
- 76 rooms
- 07 rooms
- 08 rooms
- 09+ rooms
Owner-occupied
Renter-occupied

- Bedrooms in owner-occupied houses and condos in Downtown Woodhaven <
> - 0no bedroom
- 01 bedroom
- 1262 bedrooms
- 3463 bedrooms
- 1064 bedrooms
- 05+ bedrooms

- Bedrooms in renter-occupied apartments in Downtown Woodhaven <
> - 0no bedroom
- 901 bedroom
- 372 bedrooms
- 73 bedrooms
- 04 bedrooms
- 05+ bedrooms
Average number of cars or other vehicles available in houses/condos:
Average number of cars or other vehicles available in apartments:
| This neighborhood: | 1.7 |
| Trenton: | 1.8 |
Average number of cars or other vehicles available in apartments:
| Here: | 1.1 |
| city: | 1.3 |
Percentage of units with a mortgage:
| Downtown Woodhaven (Downtown): | 61.7% |
| Trenton: | 53.5% |
Housing prices:
- Average estimated value of detached houses in 2022 (61.9% of all units):
Downtown Woodhaven (Downtown): $239,485 Michigan: $280,038
- Average estimated value of townhouses or other attached units in 2022 (12.8% of all units):
This neighborhood: $140,692 Michigan: $239,520
- Average estimated '22 value of housing units in 3-to-4-unit structures (6.8% of all units):
Downtown Woodhaven (Downtown): $141,565 Michigan: $207,067

- Year house built in Downtown Woodhaven <
> - 02020 or later
- 62010 to 2019
- 502000 to 2009
- 1391990 to 1999
- 991980 to 1989
- 3141970 to 1979
- 861960 to 1969
- 71950 to 1959
- 01940 to 1949
- 151939 or earlier

City-data.com crime index for city in 2020 (higher means more crime):
| City: | 78.1 |
| U.S. average: | 219.5 |
Travel time to work (commute)
![Travel time to work (commute)]()
- 23Less than 5 minutes
- 645 to 9 minutes
- 16010 to 14 minutes
- 13915 to 19 minutes
- 2920 to 24 minutes
- 9425 to 29 minutes
- 14130 to 34 minutes
- 5035 to 39 minutes
- 6140 to 44 minutes
- 2145 to 59 minutes
- 5060 to 89 minutes
- 490 or more minutes

Means of transportation to work
![Means of transportation to work]()
- 86.9%606Drove a car alone
- 4.7%33Carpooled
- 2.7%19Walked
- 0.9%6Other means
- 5.3%37Worked at home

Time leaving home to go to work
![Time leaving home to go to work]()
- 6712:00 a.m. to 4:59 a.m.
- 335:00 a.m. to 5:29 a.m.
- 625:30 a.m. to 5:59 a.m.
- 806:00 a.m. to 6:29 a.m.
- 1226:30 a.m. to 6:59 a.m.
- 887:00 a.m. to 7:29 a.m.
- 1317:30 a.m. to 7:59 a.m.
- 768:00 a.m. to 8:29 a.m.
- 598:30 a.m. to 8:59 a.m.
- 289:00 a.m. to 9:59 a.m.
- 3110:00 a.m. to 10:59 a.m.
- 1411:00 a.m. to 11:59 a.m.
- 1812:00 p.m. to 3:59 p.m.
- 554:00 p.m. to 11:59 p.m.

Occupations of males:
- Percentage of males in management occupations (except farmers):
Here: 3.3% city: 10.5%
- Percentage of males in business and financial operations occupations:
Here: 7.0% city: 5.0%
- Percentage of males in computer and mathematical occupations:
Here: 1.7% city: 3.2%
- Percentage of males in life, physical, and social science occupations:
Here: 1.2% city: 0.2%
- Percentage of males in education, training, and library occupations:
Here: 6.3% city: 1.6%
- Percentage of males in arts, design, entertainment, sports, and media occupations:
Here: 5.6% city: 1.7%
- Percentage of males in healthcare practitioners and technical occupations:
Here: 3.5% city: 2.0%
- Percentage of males in service occupations:
Here: 7.2% city: 15.4%
- Percentage of males in sales and office occupations:
Here: 11.8% city: 15.5%
- Percentage of males in construction, extraction, and maintenance occupations:
Here: 11.1% city: 8.9%
- Percentage of males in production occupations:
Here: 21.3% city: 10.8%
- Percentage of males in material moving occupations:
Here: 16.3% city: 6.0%
Occupations of females:
- Percentage of females in management occupations (except farmers):
Here: 5.1% city: 8.5%
- Percentage of females in business and financial operations occupations:
Here: 8.6% city: 5.9%
- Percentage of females in computer and mathematical occupations:
Here: 4.4% city: 1.8%
- Percentage of females in community and social services occupations:
Here: 2.6% city: 1.9%
- Percentage of females in education, training, and library occupations:
Here: 6.4% city: 10.9%
- Percentage of females in arts, design, entertainment, sports, and media occupations:
Here: 1.2% city: 2.0%
- Percentage of females in healthcare practitioners and technical occupations:
Here: 20.8% city: 9.8%
- Percentage of females in service occupations:
Here: 13.1% city: 18.7%
- Percentage of females in sales and office occupations:
Here: 28.9% city: 30.3%
- Percentage of females in farming, fishing, and forestry occupations:
Here: 7.5% city: 0.0%
- Percentage of females in material moving occupations:
Here: 1.4% city: 1.7%
Education in this neighborhood (subdivision or community):
- Percentage of people 3 years and older in K-12 schools:
Downtown Woodhaven (Downtown): 11.3% Trenton: 15.4%
- Percentage of people 3 years and older in undergraduate colleges:
Downtown Woodhaven (Downtown): 3.9% Trenton: 4.1%
- Percentage of people 3 years and older in grad. or professional schools:
Downtown Woodhaven (Downtown): 1.4% Trenton: 0.9%
- Percentage of students K-12 enrolled in private schools:
Downtown Woodhaven (Downtown): 21.4% Trenton: 12.0%
Percentage of population below poverty level:
| Downtown Woodhaven (Downtown): | 4.5% |
| Trenton: | 6.7% |
Median year owner moved in (as recorded in 2022):
Median year renter moved in (as recorded in 2022):
| Downtown Woodhaven (Downtown): | 2001 |
| Trenton: | 2005 |
Median year renter moved in (as recorded in 2022):
| Downtown Woodhaven (Downtown): | 2014 |
| Trenton: | 2014 |
Percentage of married-couple families with both working:
| Downtown Woodhaven (Downtown): | 82.6% |
| Trenton: | 76.3% |

- 84.2%Utility gas
- 14.2%Electricity
- 0.9%Bottled, tank, or LP gas
- 0.7%No fuel used
Limited-access highways (interstate or state) in this neighborhood:
Detroit Toledo Fwy (I- 75)
Length: 1.99 miles
Direction: N-S
Direction: N-S
Roads and streets:
Hall Rd
Length: 2.05 miles
Directions: N-S, SE-NW, SW-NE
Directions: N-S, SE-NW, SW-NE
Van Horn Rd
Length: 0.34 miles
Direction: E-W
Address range: 21000 to 21999
Direction: E-W
Address range: 21000 to 21999
West Rd
Length: 0.34 miles
Direction: E-W
Address range: 21700 to 21993
Direction: E-W
Address range: 21700 to 21993
Other features:
Brownstown Crk
Length: 0.59 miles
Directions: E-W, N-S, SE-NW, SW-NE
Directions: E-W, N-S, SE-NW, SW-NE