Downtown (Central Business District) neighborhood in Richland, Washington (WA), 99352 detailed profile
Settings
X


Business Search - 14 Million verified businesses
Area: 0.409 square miles
Population: 1,860
Population density:
| Downtown (Central Business District): | 4,548 people per square mile |
| Richland: | 1,748 people per square mile |

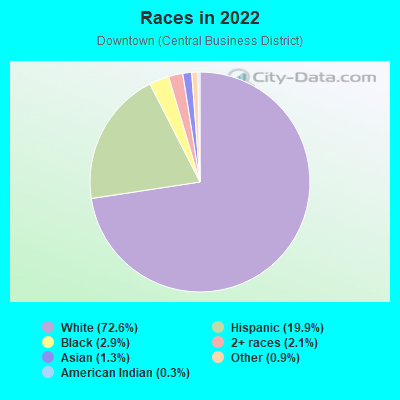
- 1,38472.6%White
- 37919.9%Hispanic or Latino
- 562.9%Black
- 412.1%Two or more races
- 241.3%Asian
- 170.9%Some other race
- 50.3%American Indian
- 10.05%Native Hawaiian and Other
Pacific Islander
Median household income in 2022:
| Downtown (Central Business District): | $69,523 |
| Richland: | $89,283 |
Distribution of median household income
![Distribution of median household income]()
- 10Less than $10,000
- 52$10,000 to $19,999
- 39$20,000 to $29,999
- 59$30,000 to $39,999
- 46$40,000 to $49,999
- 25$50,000 to $59,999
- 57$60,000 to $74,999
- 163$75,000 to $99,999
- 62$100,000 to $124,999
- 53$125,000 to $149,999
- 43$150,000 to $199,999
- 31$200,000 or more

Distribution of owner-occupied house/condo value
![Distribution of owner-occupied house/condo value]()
- 12Less than $50,000
- 1$50,000 to $99,999
- 13$100,000 to $149,999
- 32$150,000 to $199,999
- 37$200,000 to $249,999
- 43$250,000 to $299,999
- 83$300,000 to $399,999
- 33$400,000 to $499,999
- 10$500,000 to $749,999
- 3$750,000 to $999,999
- 22$1,000,000 or more

Distribution of rent paid by renters
![Distribution of rent paid by renters]()
- 10$200 to $299
- 3$300 to $399
- 28$400 to $499
- 24$500 to $599
- 14$600 to $699
- 24$700 to $799
- 41$800 to $899
- 51$900 to $999
- 90$1,000 to $1,249
- 65$1,250 to $1,499
- 25$1,500 to $1,999
- 23$2,000 or more

Median rent in 2022:
| Downtown (Central Business District): | $1,077 |
| Richland: | $1,145 |
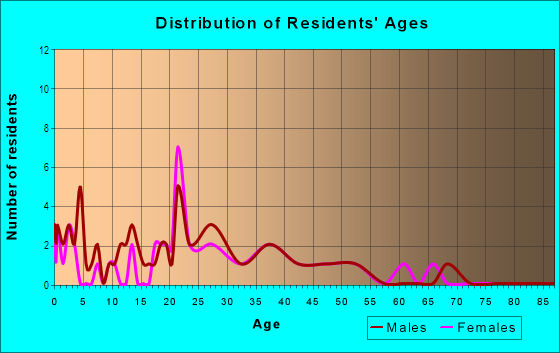
| Males: | 946 |
| Females: | 914 |
Males:
| This neighborhood: | 27.8 years |
| Whole city: | 35.0 years |
| This neighborhood: | 34.6 years |
| Whole city: | 39.1 years |
Average household size:
| Downtown (Central Business District): | 2.7 people |
| Richland: | 2.5 people |
Percentage of family households:
| Downtown (Central Business District): | 51.1% |
| Richland: | 46.0% |
| Here: | 43.8% |
| Richland: | 46.9% |
Percentage of married-couple families with children (among all households):
| Downtown (Central Business District): | 18.9% |
| Richland: | 26.4% |
Percentage of single-mother households (among all households):
| Downtown (Central Business District): | 9.1% |
| Richland: | 9.1% |
Percentage of never married males 15 years old and over:
Percentage of never married females 15 years old and over:
| Downtown (Central Business District): | 20.9% |
| Richland: | 18.2% |
Percentage of never married females 15 years old and over:
| Downtown (Central Business District): | 15.6% |
| city: | 14.0% |
Percentage of people that speak English not well or not at all:
| Downtown (Central Business District): | 2.9% |
| Richland: | 1.4% |
Percentage of people born in this state:
Percentage of people born in another U.S. state:
Percentage of native residents but born outside the U.S.:
Percentage of foreign born residents:
| Here: | 54.2% |
| Richland: | 49.4% |
Percentage of people born in another U.S. state:
| Downtown (Central Business District): | 36.3% |
| Richland: | 40.4% |
Percentage of native residents but born outside the U.S.:
| Here: | 1.5% |
| city: | 1.4% |
Percentage of foreign born residents:
| Here: | 8.0% |
| Richland: | 8.9% |
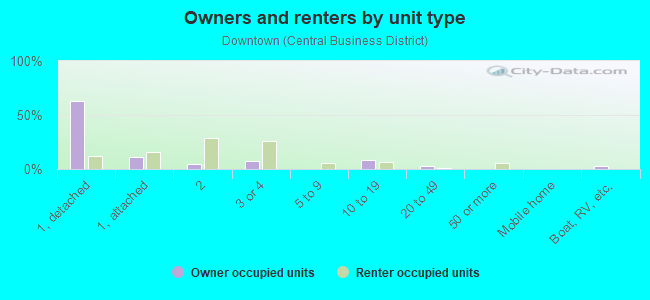
Owner-occupied
Renter-occupied

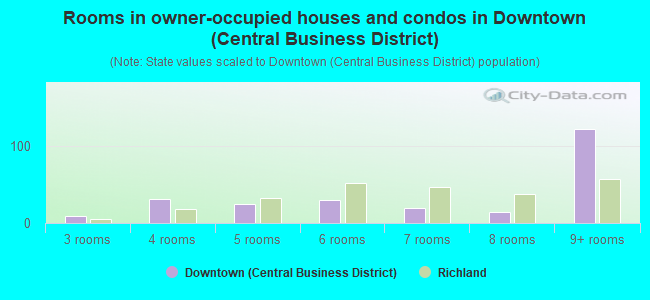
- Rooms in owner-occupied houses and condos in Downtown <
> - 01 room
- 02 rooms
- 93 rooms
- 314 rooms
- 255 rooms
- 306 rooms
- 197 rooms
- 148 rooms
- 1229+ rooms
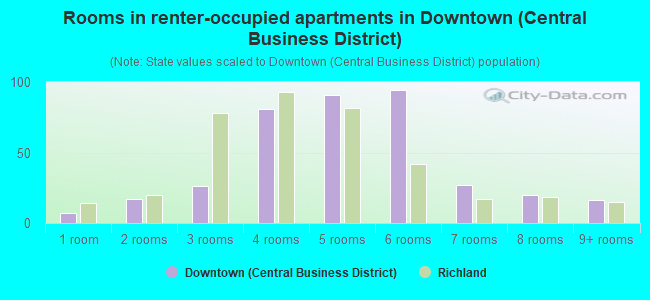
- Rooms in renter-occupied apartments in Downtown <
> - 71 room
- 172 rooms
- 263 rooms
- 814 rooms
- 915 rooms
- 946 rooms
- 277 rooms
- 208 rooms
- 169+ rooms
Owner-occupied
Renter-occupied
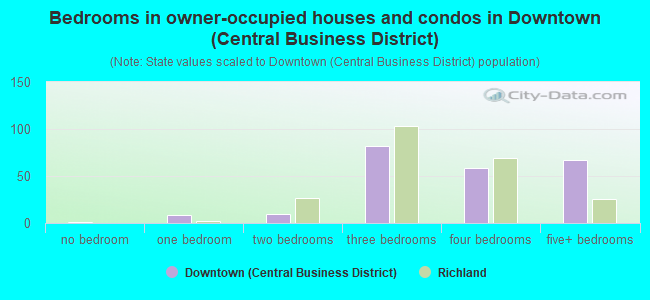
- Bedrooms in owner-occupied houses and condos in Downtown <
> - 1no bedroom
- 91 bedroom
- 102 bedrooms
- 823 bedrooms
- 584 bedrooms
- 675+ bedrooms
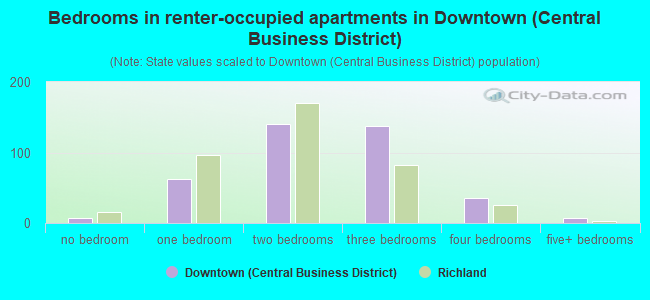
- Bedrooms in renter-occupied apartments in Downtown <
> - 7no bedroom
- 631 bedroom
- 1412 bedrooms
- 1383 bedrooms
- 364 bedrooms
- 75+ bedrooms
Average number of cars or other vehicles available in houses/condos:
Average number of cars or other vehicles available in apartments:
| This neighborhood: | 2.2 |
| Richland: | 2.2 |
Average number of cars or other vehicles available in apartments:
| Here: | 2.0 |
| city: | 1.5 |
Percentage of units with a mortgage:
| Downtown (Central Business District): | 64.7% |
| Richland: | 62.9% |
Housing prices:
- Average estimated value of detached houses in 2022 (40.4% of all units):
Downtown (Central Business District): $323,953 Washington: $734,307
- Average estimated value of townhouses or other attached units in 2022 (20.6% of all units):
This neighborhood: $346,054 Washington: $657,697
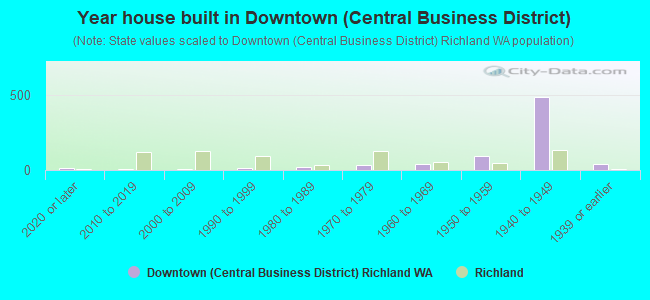
- Year house built in Downtown <
> - 152020 or later
- 82010 to 2019
- 92000 to 2009
- 151990 to 1999
- 171980 to 1989
- 331970 to 1979
- 381960 to 1969
- 931950 to 1959
- 4831940 to 1949
- 371939 or earlier
City-data.com crime index for city in 2020 (higher means more crime):
| City: | 223.6 |
| U.S. average: | 219.5 |
Travel time to work (commute)
![Travel time to work (commute)]()
- 14Less than 5 minutes
- 305 to 9 minutes
- 7310 to 14 minutes
- 6915 to 19 minutes
- 5320 to 24 minutes
- 1225 to 29 minutes
- 2030 to 34 minutes
- 1335 to 39 minutes
- 440 to 44 minutes
- 4645 to 59 minutes
- 1260 to 89 minutes
- 190 or more minutes

Means of transportation to work
![Means of transportation to work]()
- 70.8%573Drove a car alone
- 11.0%89Carpooled
- 2.1%17Bus
- 1.0%8Bicycle
- 3.3%27Walked
- 0.1%1Other means
- 15.2%123Worked at home

Time leaving home to go to work
![Time leaving home to go to work]()
- 3112:00 a.m. to 4:59 a.m.
- 295:00 a.m. to 5:29 a.m.
- 205:30 a.m. to 5:59 a.m.
- 106:00 a.m. to 6:29 a.m.
- 286:30 a.m. to 6:59 a.m.
- 507:00 a.m. to 7:29 a.m.
- 367:30 a.m. to 7:59 a.m.
- 328:00 a.m. to 8:29 a.m.
- 198:30 a.m. to 8:59 a.m.
- 189:00 a.m. to 9:59 a.m.
- 710:00 a.m. to 10:59 a.m.
- 411:00 a.m. to 11:59 a.m.
- 1912:00 p.m. to 3:59 p.m.
- 214:00 p.m. to 11:59 p.m.

Occupations of males:
- Percentage of males in management occupations (except farmers):
Here: 6.1% city: 12.7%
- Percentage of males in business and financial operations occupations:
Here: 3.0% city: 5.3%
- Percentage of males in computer and mathematical occupations:
Here: 15.0% city: 7.0%
- Percentage of males in architecture and engineering occupations:
Here: 6.4% city: 10.2%
- Percentage of males in life, physical, and social science occupations:
Here: 3.1% city: 8.1%
- Percentage of males in education, training, and library occupations:
Here: 3.9% city: 3.6%
- Percentage of males in arts, design, entertainment, sports, and media occupations:
Here: 1.4% city: 1.3%
- Percentage of males in healthcare practitioners and technical occupations:
Here: 1.2% city: 5.0%
- Percentage of males in service occupations:
Here: 16.2% city: 8.5%
- Percentage of males in sales and office occupations:
Here: 13.8% city: 9.2%
- Percentage of males in farming, fishing, and forestry occupations:
Here: 1.8% city: 0.2%
- Percentage of males in construction, extraction, and maintenance occupations:
Here: 13.4% city: 7.1%
- Percentage of males in production occupations:
Here: 3.2% city: 4.5%
- Percentage of males in transportation occupations:
Here: 3.3% city: 5.3%
- Percentage of males in material moving occupations:
Here: 5.4% city: 5.5%
Occupations of females:
- Percentage of females in management occupations (except farmers):
Here: 15.7% city: 11.4%
- Percentage of females in business and financial operations occupations:
Here: 5.2% city: 7.6%
- Percentage of females in architecture and engineering occupations:
Here: 2.2% city: 1.2%
- Percentage of females in life, physical, and social science occupations:
Here: 1.1% city: 3.9%
- Percentage of females in education, training, and library occupations:
Here: 8.0% city: 12.0%
- Percentage of females in arts, design, entertainment, sports, and media occupations:
Here: 1.1% city: 1.8%
- Percentage of females in healthcare practitioners and technical occupations:
Here: 3.0% city: 9.5%
- Percentage of females in service occupations:
Here: 28.9% city: 17.4%
- Percentage of females in sales and office occupations:
Here: 32.2% city: 23.3%
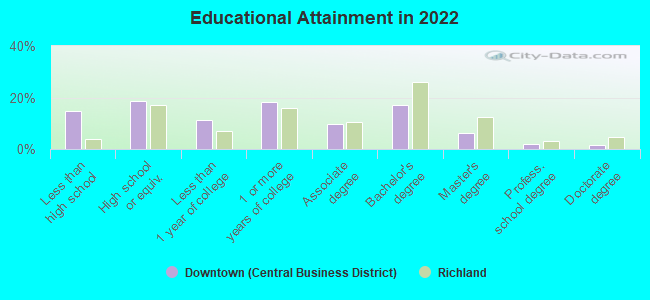
Education in this neighborhood (subdivision or community):
- Percentage of people 3 years and older in K-12 schools:
Downtown (Central Business District): 24.1% Richland: 18.9%
- Percentage of people 3 years and older in undergraduate colleges:
Downtown (Central Business District): 4.5% Richland: 3.9%
- Percentage of people 3 years and older in grad. or professional schools:
Downtown (Central Business District): 2.3% Richland: 1.5%
- Percentage of students K-12 enrolled in private schools:
Downtown (Central Business District): 17.1% Richland: 7.9%
Percentage of population below poverty level:
| Downtown (Central Business District): | 9.0% |
| Richland: | 7.5% |
Median year owner moved in (as recorded in 2022):
Median year renter moved in (as recorded in 2022):
| Downtown (Central Business District): | 2006 |
| Richland: | 2011 |
Median year renter moved in (as recorded in 2022):
| Downtown (Central Business District): | 2016 |
| Richland: | 2018 |
Percentage of married-couple families with both working:
| Downtown (Central Business District): | 87.0% |
| Richland: | 69.6% |
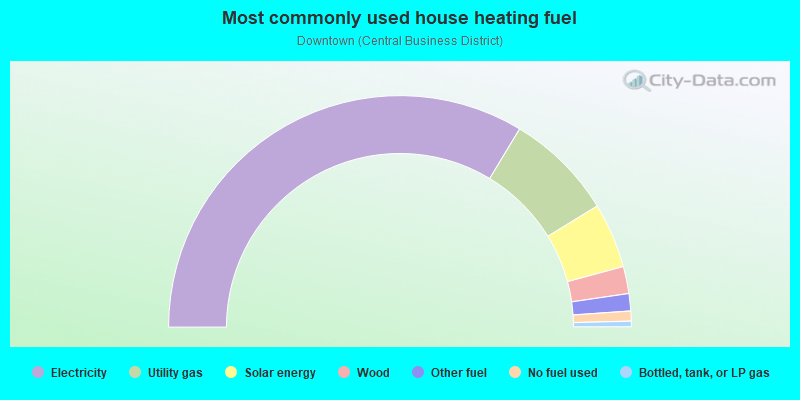
- 67.3%Electricity
- 15.2%Utility gas
- 9.1%Solar energy
- 3.8%Wood
- 2.4%Other fuel
- 1.4%No fuel used
- 0.8%Bottled, tank, or LP gas
Roads and streets:
Jadwin Ave
Length: 0.91 miles
Directions: N-S, SE-NW
Address range: 600 to 1299
Directions: N-S, SE-NW
Address range: 600 to 1299
George Washington Way
Length: 0.70 miles
Directions: N-S, SE-NW
Address range: 600 to 1199
Directions: N-S, SE-NW
Address range: 600 to 1199
Goethals Dr
Length: 0.67 miles
Direction: N-S
Address range: 700 to 1199
Direction: N-S
Address range: 700 to 1199
Swift Blvd
Length: 0.65 miles
Direction: E-W
Address range: 1 to 899
Direction: E-W
Address range: 1 to 899
Lee Blvd
Length: 0.56 miles
Direction: E-W
Address range: 100 to 1323
Direction: E-W
Address range: 100 to 1323
Knight St
Length: 0.56 miles
Direction: E-W
Address range: 100 to 1399
Direction: E-W
Address range: 100 to 1399
Mansfield St
Length: 0.49 miles
Direction: E-W
Address range: 600 to 1399
Direction: E-W
Address range: 600 to 1399
Stevens Dr
Length: 0.40 miles
Directions: N-S, SE-NW
Address range: 700 to 999
Directions: N-S, SE-NW
Address range: 700 to 999
Gilmore St (Gilmore Ave)
Length: 0.39 miles
Directions: E-W, N-S, SE-NW
Address range: 1000 to 1199
Directions: E-W, N-S, SE-NW
Address range: 1000 to 1199
Harding St
Length: 0.26 miles
Directions: E-W, N-S, SE-NW
Directions: E-W, N-S, SE-NW
Northgate Dr
Length: 0.26 miles
Direction: N-S
Address range: 800 to 1099
Direction: N-S
Address range: 800 to 1099
The Parkway
Length: 0.25 miles
Directions: E-W, N-S
Address range: 600 to 799
Directions: E-W, N-S
Address range: 600 to 799
Cullum Ave
Length: 0.13 miles
Direction: SW-NE
Address range: 616 to 699
Direction: SW-NE
Address range: 616 to 699
Gribble Ave
Length: 0.11 miles
Directions: E-W, SE-NW
Address range: 1000 to 1199
Directions: E-W, SE-NW
Address range: 1000 to 1199
McKenzie St
Length: 0.10 miles
Direction: E-W
Address range: 100 to 599
Direction: E-W
Address range: 100 to 599
Newton St
Length: 0.10 miles
Direction: E-W
Address range: 101 to 599
Direction: E-W
Address range: 101 to 599
Carondelet Dr
Length: 0.06 miles
Direction: E-W
Direction: E-W