Downtown neighborhood in Park Forest, Illinois (IL), 60466 detailed profile
Settings
X


Business Search - 14 Million verified businesses
Area: 0.130 square miles
Population: 574
Population density:
| Downtown: | 4,422 people per square mile |
| Park Forest: | 4,272 people per square mile |

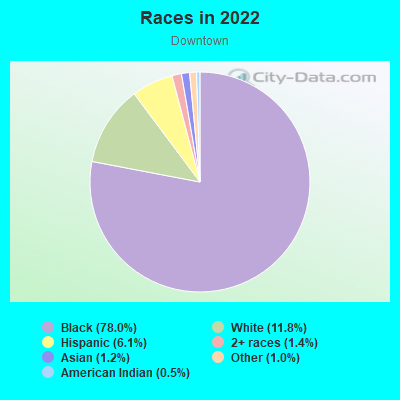
- 46278.0%Black
- 7011.8%White
- 366.1%Hispanic or Latino
- 81.4%Two or more races
- 71.2%Asian
- 61.0%Some other race
- 30.5%American Indian
Median household income in 2022:
| Downtown: | $64,191 |
| Park Forest: | $58,907 |
Distribution of median household income
![Distribution of median household income]()
- 20Less than $10,000
- 74$10,000 to $19,999
- 47$20,000 to $29,999
- 78$30,000 to $39,999
- 18$40,000 to $49,999
- 33$50,000 to $59,999
- 16$60,000 to $74,999
- 55$75,000 to $99,999
- 27$100,000 to $124,999
- 23$125,000 to $149,999
- 8$150,000 to $199,999
- 3$200,000 or more

Distribution of owner-occupied house/condo value
![Distribution of owner-occupied house/condo value]()
- 117Less than $50,000
- 70$50,000 to $99,999
- 23$100,000 to $149,999
- 19$150,000 to $199,999
- 5$200,000 to $249,999
- 9$250,000 to $299,999
- 2$500,000 to $749,999
- 6$750,000 to $999,999
- 2$1,000,000 or more

Distribution of rent paid by renters
![Distribution of rent paid by renters]()
- 75Less than $100
- 6$200 to $299
- 15$300 to $399
- 1$400 to $499
- 7$500 to $599
- 15$600 to $699
- 10$700 to $799
- 6$800 to $899
- 11$900 to $999
- 27$1,000 to $1,249
- 59$1,250 to $1,499
- 14$1,500 to $1,999

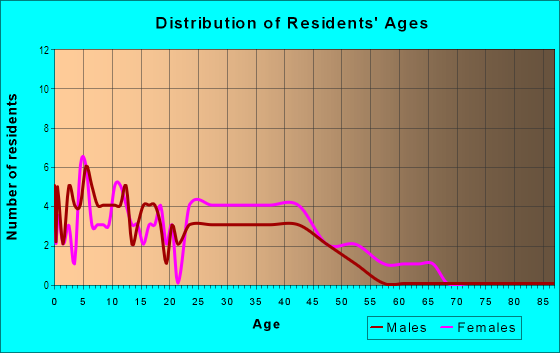
| Males: | 275 |
| Females: | 298 |
Males:
| This neighborhood: | 30.2 years |
| Whole city: | 33.0 years |
| This neighborhood: | 43.8 years |
| Whole city: | 40.4 years |
Average household size:
| Downtown: | 2.3 people |
| Park Forest: | 2.6 people |
Percentage of family households:
| Downtown: | 42.5% |
| Park Forest: | 44.8% |
| Here: | 18.7% |
| Park Forest: | 31.7% |
Percentage of married-couple families with children (among all households):
| Downtown: | 9.2% |
| Park Forest: | 21.3% |
Percentage of single-mother households (among all households):
| Downtown: | 15.0% |
| Park Forest: | 11.7% |
Percentage of never married males 15 years old and over:
Percentage of never married females 15 years old and over:
| Downtown: | 38.3% |
| Park Forest: | 23.2% |
Percentage of never married females 15 years old and over:
| Downtown: | 14.5% |
| village: | 21.4% |
Percentage of people that speak English not well or not at all:
| Downtown: | 2.0% |
| Park Forest: | 1.5% |
Percentage of people born in this state:
Percentage of people born in another U.S. state:
Percentage of native residents but born outside the U.S.:
Percentage of foreign born residents:
| Here: | 78.6% |
| Park Forest: | 79.3% |
Percentage of people born in another U.S. state:
| Downtown: | 18.2% |
| Park Forest: | 15.2% |
Percentage of native residents but born outside the U.S.:
| Here: | 0.7% |
| village: | 0.7% |
Percentage of foreign born residents:
| Here: | 3.1% |
| Park Forest: | 4.7% |
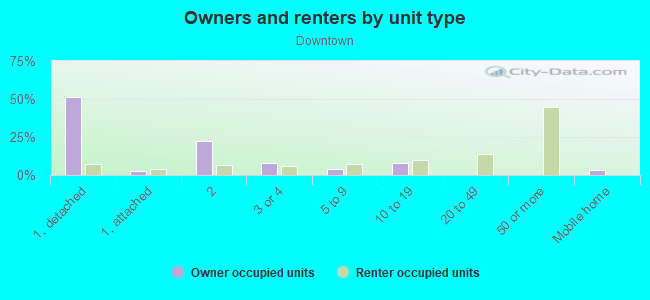
Owner-occupied
Renter-occupied

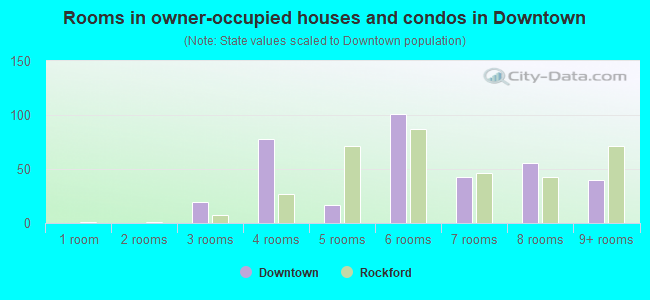
- Rooms in owner-occupied houses and condos in Downtown
- 11 room
- 02 rooms
- 03 rooms
- 454 rooms
- 555 rooms
- 216 rooms
- 77 rooms
- 248 rooms
- 79+ rooms
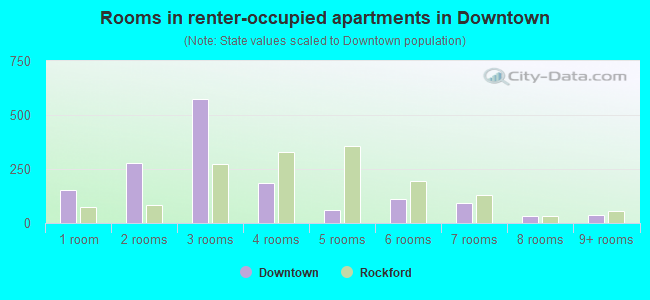
- Rooms in renter-occupied apartments in Downtown
- 121 room
- 52 rooms
- 323 rooms
- 94 rooms
- 525 rooms
- 186 rooms
- 657 rooms
- 58 rooms
- 39+ rooms
Owner-occupied
Renter-occupied
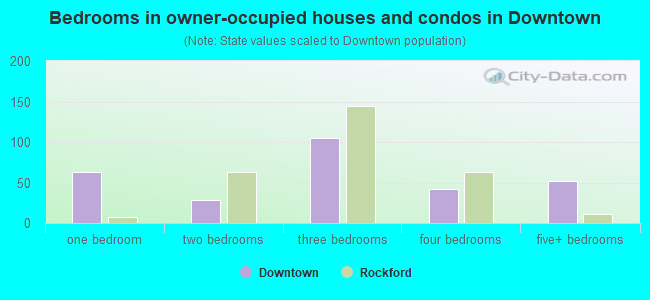
- Bedrooms in owner-occupied houses and condos in Downtown
- 1no bedroom
- 151 bedroom
- 852 bedrooms
- 253 bedrooms
- 234 bedrooms
- 85+ bedrooms
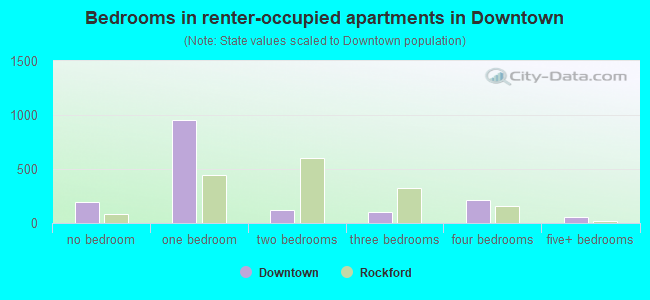
- Bedrooms in renter-occupied apartments in Downtown
- 12no bedroom
- 361 bedroom
- 562 bedrooms
- 233 bedrooms
- 694 bedrooms
- 05+ bedrooms
Average number of cars or other vehicles available in houses/condos:
Average number of cars or other vehicles available in apartments:
| This neighborhood: | 1.5 |
| Park Forest: | 1.6 |
Average number of cars or other vehicles available in apartments:
| Here: | 1.0 |
| village: | 1.5 |
Percentage of units with a mortgage:
| Downtown: | 44.1% |
| Park Forest: | 47.7% |
Average estimated value of detached houses in 2022 (42.8% of all units):
| Downtown: | $113,431 |
| Illinois: | $310,164 |
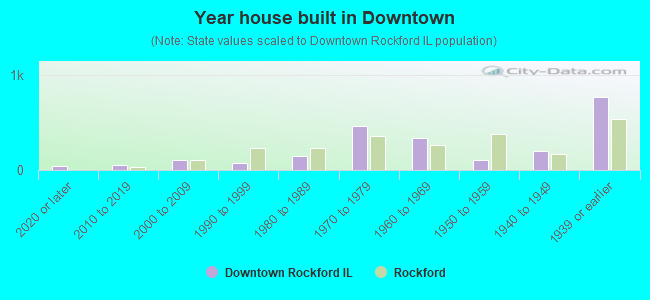
- Year house built in Downtown
- 02020 or later
- 02010 to 2019
- 82000 to 2009
- 261990 to 1999
- 141980 to 1989
- 391970 to 1979
- 771960 to 1969
- 751950 to 1959
- 271940 to 1949
- 461939 or earlier
City-data.com crime index for village in 2020 (higher means more crime):
| City: | 151.1 |
| U.S. average: | 219.5 |
Travel time to work (commute)
![Travel time to work (commute)]()
- 2Less than 5 minutes
- 65 to 9 minutes
- 4410 to 14 minutes
- 1215 to 19 minutes
- 2120 to 24 minutes
- 1225 to 29 minutes
- 1530 to 34 minutes
- 935 to 39 minutes
- 340 to 44 minutes
- 1345 to 59 minutes
- 1760 to 89 minutes
- 3090 or more minutes

Means of transportation to work
![Means of transportation to work]()
- 83.7%200Drove a car alone
- 7.5%18Carpooled
- 7.5%18Bus
- 4.2%10Subway or elevated rail
- 3.8%9Other means
- 5.4%13Worked at home

Time leaving home to go to work
![Time leaving home to go to work]()
- 112:00 a.m. to 4:59 a.m.
- 45:00 a.m. to 5:29 a.m.
- 145:30 a.m. to 5:59 a.m.
- 196:00 a.m. to 6:29 a.m.
- 396:30 a.m. to 6:59 a.m.
- 527:00 a.m. to 7:29 a.m.
- 167:30 a.m. to 7:59 a.m.
- 148:00 a.m. to 8:29 a.m.
- 28:30 a.m. to 8:59 a.m.
- 89:00 a.m. to 9:59 a.m.
- 610:00 a.m. to 10:59 a.m.
- 211:00 a.m. to 11:59 a.m.
- 1112:00 p.m. to 3:59 p.m.
- 104:00 p.m. to 11:59 p.m.

Occupations of males:
- Percentage of males in education, training, and library occupations:
Here: 1.0% village: 1.7%
- Percentage of males in sales and office occupations:
Here: 43.8% village: 22.6%
- Percentage of males in production occupations:
Here: 13.8% village: 10.9%
- Percentage of males in material moving occupations:
Here: 40.9% village: 10.5%
Occupations of females:
- Percentage of females in management occupations (except farmers):
Here: 10.4% village: 6.7%
- Percentage of females in business and financial operations occupations:
Here: 10.4% village: 5.0%
- Percentage of females in community and social services occupations:
Here: 3.1% village: 4.4%
- Percentage of females in education, training, and library occupations:
Here: 30.8% village: 10.7%
- Percentage of females in arts, design, entertainment, sports, and media occupations:
Here: 1.2% village: 0.9%
- Percentage of females in healthcare practitioners and technical occupations:
Here: 13.5% village: 12.8%
- Percentage of females in service occupations:
Here: 16.2% village: 20.3%
- Percentage of females in sales and office occupations:
Here: 6.8% village: 25.9%
- Percentage of females in production occupations:
Here: 8.4% village: 2.8%
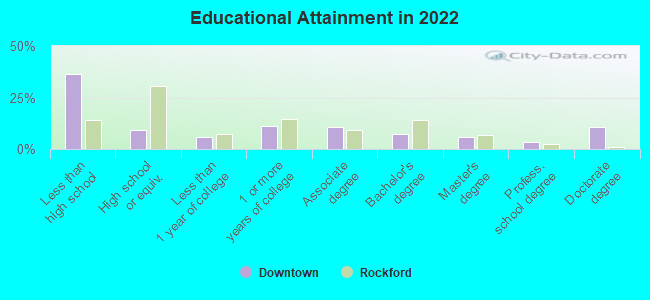
Education in this neighborhood (subdivision or community):
- Percentage of people 3 years and older in K-12 schools:
Downtown: 38.1% Park Forest: 21.1%
- Percentage of people 3 years and older in undergraduate colleges:
Downtown: 4.7% Park Forest: 4.1%
- Percentage of people 3 years and older in grad. or professional schools:
Downtown: 2.5% Park Forest: 1.6%
- Percentage of students K-12 enrolled in private schools:
Downtown: 1.4% Park Forest: 7.2%
Percentage of population below poverty level:
| Downtown: | 13.6% |
| Park Forest: | 17.3% |
Median year owner moved in (as recorded in 2022):
Median year renter moved in (as recorded in 2022):
| Downtown: | 2003 |
| Park Forest: | 2007 |
Median year renter moved in (as recorded in 2022):
| Downtown: | 2016 |
| Park Forest: | 2015 |
Percentage of married-couple families with both working:
| Downtown: | 111.5% |
| Park Forest: | 71.1% |
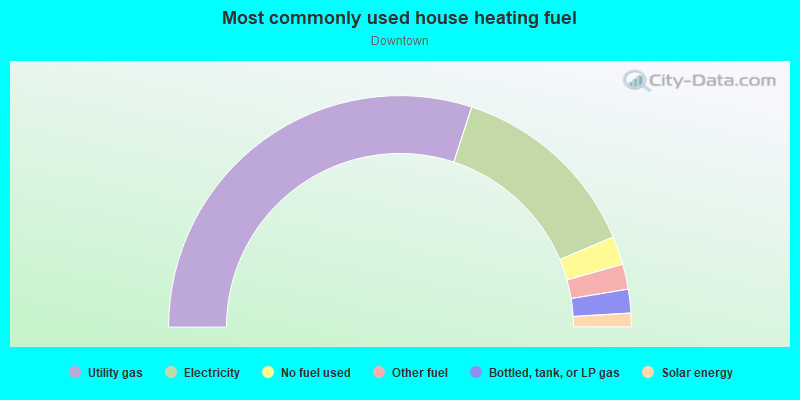
- 87.0%Utility gas
- 8.6%Electricity
- 3.0%Bottled, tank, or LP gas
- 1.5%No fuel used
Roads and streets:
Victory Dr
Length: 0.60 miles
Directions: E-W, SE-NW, SW-NE
Directions: E-W, SE-NW, SW-NE
Lakewood Blvd
Length: 0.45 miles
Direction: E-W
Address range: 400 to 412
Direction: E-W
Address range: 400 to 412
Main St
Length: 0.37 miles
Direction: E-W
Address range: 200 to 399
Direction: E-W
Address range: 200 to 399
S Orchard Dr
Length: 0.33 miles
Directions: N-S, SE-NW
Address range: 1 to 199
Directions: N-S, SE-NW
Address range: 1 to 199
Indianwood Blvd
Length: 0.31 miles
Direction: E-W
Address range: 101 to 199
Direction: E-W
Address range: 101 to 199
Liberty Dr
Length: 0.30 miles
Direction: E-W
Address range: 298 to 347
Direction: E-W
Address range: 298 to 347
Forest Blvd
Length: 0.24 miles
Directions: N-S, SE-NW
Address range: 300 to 399
Directions: N-S, SE-NW
Address range: 300 to 399
Lester Rd
Length: 0.15 miles
Directions: N-S, SE-NW
Directions: N-S, SE-NW
Cunningham Dr
Length: 0.11 miles
Directions: E-W, N-S, SE-NW
Address range: 200 to 299
Directions: E-W, N-S, SE-NW
Address range: 200 to 299
Victoria Cir
Length: 0.08 miles
Directions: E-W, N-S, SE-NW
Directions: E-W, N-S, SE-NW
Western Ave
Length: 0.07 miles
Direction: N-S
Address range: 3009 to 3164
Direction: N-S
Address range: 3009 to 3164
Founders Way
Length: 0.04 miles
Direction: N-S
Address range: 200 to 399
Direction: N-S
Address range: 200 to 399