Deza Estates neighborhood in Denver, Colorado (CO), 80260 detailed profile
Settings
X


Business Search - 14 Million verified businesses
Area: 0.095 square miles
Population: 352
Population density:
| Deza Estates: | 3,717 people per square mile |
| Denver: | 4,651 people per square mile |

- 15238.6%White
- 13233.5%Hispanic or Latino
- 4711.9%Black
- 348.6%Two or more races
- 184.6%Some other race
- 82.0%Asian
- 30.8%American Indian

Median household income in 2022:
| Deza Estates: | $69,546 |
| Denver: | $88,213 |
Distribution of median household income
![Distribution of median household income]()
- 2Less than $10,000
- 15$10,000 to $19,999
- 15$20,000 to $29,999
- 24$30,000 to $39,999
- 12$40,000 to $49,999
- 10$50,000 to $59,999
- 32$60,000 to $74,999
- 19$75,000 to $99,999
- 25$100,000 to $124,999
- 14$125,000 to $149,999
- 4$150,000 to $199,999
- 23$200,000 or more

Distribution of owner-occupied house/condo value
![Distribution of owner-occupied house/condo value]()
- 49Less than $50,000
- 90$50,000 to $99,999
- 22$100,000 to $149,999
- 4$150,000 to $199,999
- 5$200,000 to $249,999
- 8$250,000 to $299,999
- 27$300,000 to $399,999
- 35$400,000 to $499,999
- 4$500,000 to $749,999
- 6$750,000 to $999,999

Distribution of rent paid by renters
![Distribution of rent paid by renters]()
- 1$200 to $299
- 11$600 to $699
- 4$800 to $899
- 14$900 to $999
- 3$1,000 to $1,249
- 14$1,250 to $1,499
- 17$1,500 to $1,999
- 7$2,000 or more

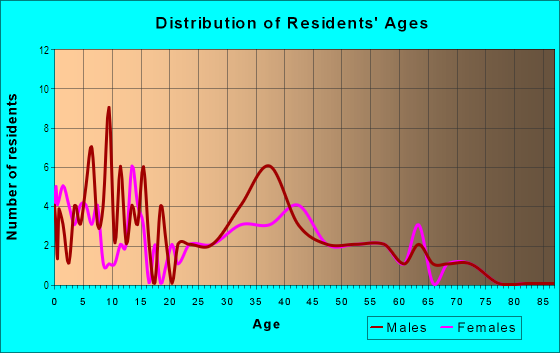
| Males: | 192 |
| Females: | 159 |
Males:
| This neighborhood: | 39.5 years |
| Whole city: | 35.2 years |
| This neighborhood: | 38.1 years |
| Whole city: | 35.1 years |
Average household size:
| Deza Estates: | 2.9 people |
| Denver: | 28.0 people |
Percentage of family households:
| Deza Estates: | 48.6% |
| Denver: | 35.1% |
| Here: | 46.7% |
| Denver: | 32.5% |
Percentage of married-couple families with children (among all households):
| Deza Estates: | 27.1% |
| Denver: | 32.4% |
Percentage of single-mother households (among all households):
| Deza Estates: | 6.8% |
| Denver: | 10.3% |
Percentage of never married males 15 years old and over:
Percentage of never married females 15 years old and over:
| Deza Estates: | 29.9% |
| Denver: | 25.0% |
Percentage of never married females 15 years old and over:
| Deza Estates: | 17.2% |
| city: | 20.8% |
Percentage of people that speak English not well or not at all:
| Deza Estates: | 9.0% |
| Denver: | 3.9% |
Percentage of people born in this state:
Percentage of people born in another U.S. state:
Percentage of native residents but born outside the U.S.:
Percentage of foreign born residents:
| Here: | 53.7% |
| Denver: | 38.5% |
Percentage of people born in another U.S. state:
| Deza Estates: | 23.7% |
| Denver: | 46.1% |
Percentage of native residents but born outside the U.S.:
| Here: | 1.0% |
| city: | 1.7% |
Percentage of foreign born residents:
| Here: | 21.6% |
| Denver: | 13.8% |

Owner-occupied
Renter-occupied


- Rooms in owner-occupied houses and condos in Deza Estates
- 41 room
- 02 rooms
- 113 rooms
- 154 rooms
- 415 rooms
- 96 rooms
- 257 rooms
- 158 rooms
- 149+ rooms

- Rooms in renter-occupied apartments in Deza Estates
- 01 room
- 42 rooms
- 173 rooms
- 104 rooms
- 65 rooms
- 166 rooms
- 47 rooms
- 18 rooms
- 139+ rooms
Owner-occupied
Renter-occupied

- Bedrooms in owner-occupied houses and condos in Deza Estates
- 4no bedroom
- 01 bedroom
- 382 bedrooms
- 483 bedrooms
- 234 bedrooms
- 65+ bedrooms

- Bedrooms in renter-occupied apartments in Deza Estates
- 0no bedroom
- 121 bedroom
- 182 bedrooms
- 153 bedrooms
- 74 bedrooms
- 135+ bedrooms
Average number of cars or other vehicles available in houses/condos:
Average number of cars or other vehicles available in apartments:
| This neighborhood: | 4.1 |
| Denver: | 1.9 |
Average number of cars or other vehicles available in apartments:
| Here: | 2.1 |
| city: | 1.3 |
Percentage of units with a mortgage:
| Deza Estates: | 51.1% |
| Denver: | 75.6% |
Average estimated value of detached houses in 2022 (62.2% of all units):
| Deza Estates: | $336,399 |
| Colorado: | $676,667 |

- Year house built in Deza Estates
- 02020 or later
- 182010 to 2019
- 12000 to 2009
- 471990 to 1999
- 361980 to 1989
- 271970 to 1979
- 251960 to 1969
- 291950 to 1959
- 61940 to 1949
- 01939 or earlier

City-data.com crime index for city in 2020 (higher means more crime):
| City: | 519.0 |
| U.S. average: | 219.5 |
Travel time to work (commute)
![Travel time to work (commute)]()
- 6Less than 5 minutes
- 85 to 9 minutes
- 3610 to 14 minutes
- 3015 to 19 minutes
- 3620 to 24 minutes
- 1025 to 29 minutes
- 3530 to 34 minutes
- 335 to 39 minutes
- 640 to 44 minutes
- 2545 to 59 minutes
- 1260 to 89 minutes
- 890 or more minutes

Means of transportation to work
![Means of transportation to work]()
- 82.6%163Drove a car alone
- 13.7%27Carpooled
- 3.5%7Bus
- 1.5%3Bicycle
- 0.5%1Other means
- 2.5%5Worked at home

Time leaving home to go to work
![Time leaving home to go to work]()
- 1212:00 a.m. to 4:59 a.m.
- 135:00 a.m. to 5:29 a.m.
- 135:30 a.m. to 5:59 a.m.
- 336:00 a.m. to 6:29 a.m.
- 276:30 a.m. to 6:59 a.m.
- 337:00 a.m. to 7:29 a.m.
- 147:30 a.m. to 7:59 a.m.
- 158:00 a.m. to 8:29 a.m.
- 108:30 a.m. to 8:59 a.m.
- 119:00 a.m. to 9:59 a.m.
- 810:00 a.m. to 10:59 a.m.
- 511:00 a.m. to 11:59 a.m.
- 1612:00 p.m. to 3:59 p.m.
- 114:00 p.m. to 11:59 p.m.

Occupations of males:
- Percentage of males in management occupations (except farmers):
Here: 2.2% city: 15.4%
- Percentage of males in business and financial operations occupations:
Here: 1.8% city: 8.3%
- Percentage of males in computer and mathematical occupations:
Here: 3.5% city: 7.4%
- Percentage of males in education, training, and library occupations:
Here: 4.3% city: 3.1%
- Percentage of males in healthcare practitioners and technical occupations:
Here: 4.7% city: 3.5%
- Percentage of males in service occupations:
Here: 11.4% city: 11.9%
- Percentage of males in sales and office occupations:
Here: 1.7% city: 15.4%
- Percentage of males in construction, extraction, and maintenance occupations:
Here: 18.6% city: 8.0%
- Percentage of males in production occupations:
Here: 12.1% city: 3.2%
- Percentage of males in transportation occupations:
Here: 13.4% city: 4.2%
- Percentage of males in material moving occupations:
Here: 6.6% city: 3.5%
Occupations of females:
- Percentage of females in management occupations (except farmers):
Here: 6.4% city: 14.0%
- Percentage of females in business and financial operations occupations:
Here: 11.2% city: 10.0%
- Percentage of females in computer and mathematical occupations:
Here: 1.4% city: 2.9%
- Percentage of females in life, physical, and social science occupations:
Here: 4.5% city: 1.5%
- Percentage of females in education, training, and library occupations:
Here: 6.3% city: 7.9%
- Percentage of females in healthcare practitioners and technical occupations:
Here: 9.9% city: 10.2%
- Percentage of females in service occupations:
Here: 24.1% city: 16.2%
- Percentage of females in sales and office occupations:
Here: 48.5% city: 21.4%
- Percentage of females in production occupations:
Here: 4.0% city: 1.7%
- Percentage of females in material moving occupations:
Here: 5.8% city: 1.4%
Education in this neighborhood (subdivision or community):
- Percentage of people 3 years and older in K-12 schools:
Deza Estates: 19.9% Denver: 12.7%
- Percentage of people 3 years and older in undergraduate colleges:
Deza Estates: 6.5% Denver: 4.1%
- Percentage of people 3 years and older in grad. or professional schools:
Deza Estates: 0.3% Denver: 2.2%
- Percentage of students K-12 enrolled in private schools:
Deza Estates: 14.3% Denver: 11.0%
Percentage of population below poverty level:
| Deza Estates: | 9.0% |
| Denver: | 11.8% |
Median year owner moved in (as recorded in 2022):
| Deza Estates: | 2012 |
| Denver: | 2014 |
Percentage of married-couple families with both working:
| Deza Estates: | 76.6% |
| Denver: | 74.1% |

- 56.7%Utility gas
- 42.3%Electricity
- 1.0%Bottled, tank, or LP gas
Roads and streets:
W 96th Pl
Length: 0.33 miles
Direction: E-W
Address range: 886 to 1205
Direction: E-W
Address range: 886 to 1205
W 98th Ave
Length: 0.18 miles
Direction: E-W
Address range: 900 to 1151
Direction: E-W
Address range: 900 to 1151
W 96th Ave
Length: 0.07 miles
Direction: E-W
Address range: 800 to 1023
Direction: E-W
Address range: 800 to 1023
Lunceford St
Length: 0.05 miles
Direction: N-S
Direction: N-S