Deer Creek Crossing neighborhood in New Port Richey, Florida (FL), 34653 detailed profile
Settings
X


Business Search - 14 Million verified businesses
Area: 0.355 square miles
Population: 665
Population density:
| Deer Creek Crossing: | 1,871 people per square mile |
| New Port Richey: | 3,712 people per square mile |

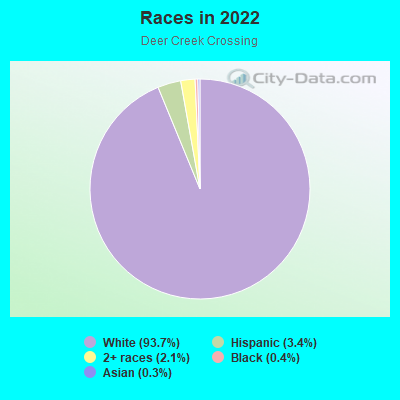
- 62593.7%White
- 233.4%Hispanic or Latino
- 142.1%Two or more races
- 30.4%Black
- 20.3%Asian
Median household income in 2022:
| Deer Creek Crossing: | $65,962 |
| New Port Richey: | $42,254 |
Distribution of median household income
![Distribution of median household income]()
- 5Less than $10,000
- 15$10,000 to $19,999
- 34$20,000 to $29,999
- 41$30,000 to $39,999
- 22$40,000 to $49,999
- 5$50,000 to $59,999
- 24$60,000 to $74,999
- 30$75,000 to $99,999
- 30$100,000 to $124,999
- 25$125,000 to $149,999
- 14$150,000 to $199,999
- 12$200,000 or more

Distribution of owner-occupied house/condo value
![Distribution of owner-occupied house/condo value]()
- 6$50,000 to $99,999
- 27$100,000 to $149,999
- 31$150,000 to $199,999
- 55$200,000 to $249,999
- 58$250,000 to $299,999
- 27$300,000 to $399,999
- 8$400,000 to $499,999
- 2$500,000 to $749,999

Distribution of rent paid by renters
![Distribution of rent paid by renters]()
- 3$800 to $899
- 4$900 to $999
- 20$1,250 to $1,499
- 10$1,500 to $1,999
- 1$2,000 or more

Median rent in 2022:
| Deer Creek Crossing: | $1,397 |
| New Port Richey: | $907 |
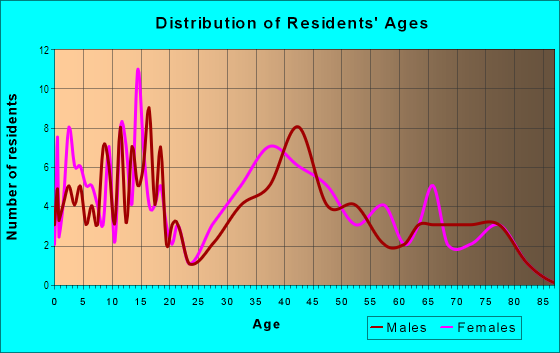
| Males: | 375 |
| Females: | 289 |
Males:
| This neighborhood: | 33.1 years |
| Whole city: | 52.9 years |
| This neighborhood: | 43.6 years |
| Whole city: | 54.8 years |
Average household size:
| Deer Creek Crossing: | 2.6 people |
| New Port Richey: | 29.0 people |
Percentage of family households:
| Deer Creek Crossing: | 58.4% |
| New Port Richey: | 35.5% |
| Here: | 59.5% |
| New Port Richey: | 32.7% |
Percentage of married-couple families with children (among all households):
| Deer Creek Crossing: | 25.4% |
| New Port Richey: | 26.1% |
Percentage of single-mother households (among all households):
| Deer Creek Crossing: | 10.0% |
| New Port Richey: | 13.9% |
Percentage of never married males 15 years old and over:
Percentage of never married females 15 years old and over:
| Deer Creek Crossing: | 11.8% |
| New Port Richey: | 14.7% |
Percentage of never married females 15 years old and over:
| Deer Creek Crossing: | 9.5% |
| city: | 13.6% |
Percentage of people that speak English not well or not at all:
| Deer Creek Crossing: | 1.1% |
| New Port Richey: | 2.6% |
Percentage of people born in this state:
Percentage of people born in another U.S. state:
Percentage of native residents but born outside the U.S.:
Percentage of foreign born residents:
| Here: | 35.0% |
| New Port Richey: | 30.0% |
Percentage of people born in another U.S. state:
| Deer Creek Crossing: | 53.5% |
| New Port Richey: | 57.9% |
Percentage of native residents but born outside the U.S.:
| Here: | 1.9% |
| city: | 3.3% |
Percentage of foreign born residents:
| Here: | 9.7% |
| New Port Richey: | 8.8% |
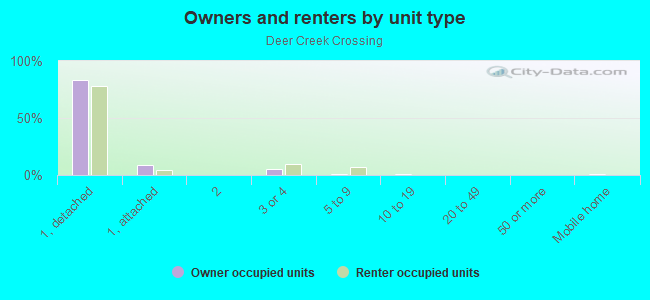
Owner-occupied
Renter-occupied

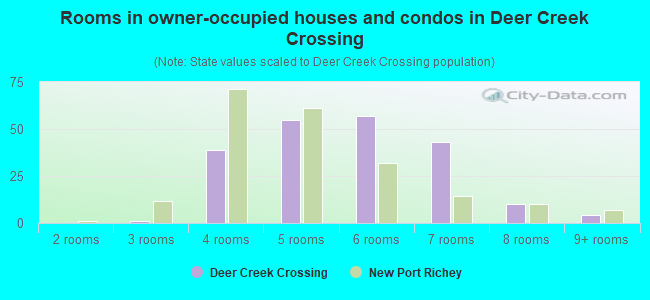
- Rooms in owner-occupied houses and condos in Deer Creek Crossing
- 01 room
- 02 rooms
- 13 rooms
- 394 rooms
- 555 rooms
- 576 rooms
- 437 rooms
- 108 rooms
- 49+ rooms
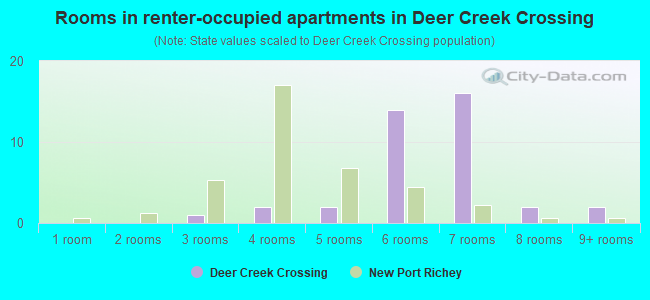
- Rooms in renter-occupied apartments in Deer Creek Crossing
- 01 room
- 02 rooms
- 13 rooms
- 24 rooms
- 25 rooms
- 146 rooms
- 167 rooms
- 28 rooms
- 29+ rooms
Owner-occupied
Renter-occupied
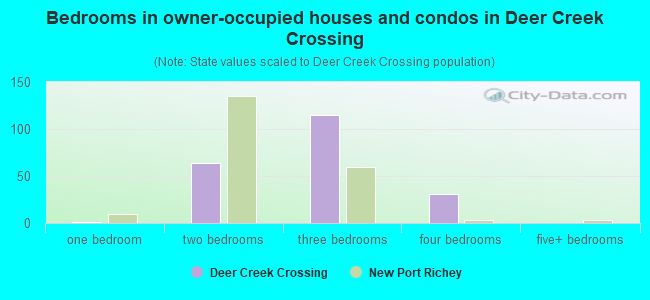
- Bedrooms in owner-occupied houses and condos in Deer Creek Crossing
- 0no bedroom
- 11 bedroom
- 642 bedrooms
- 1153 bedrooms
- 314 bedrooms
- 05+ bedrooms
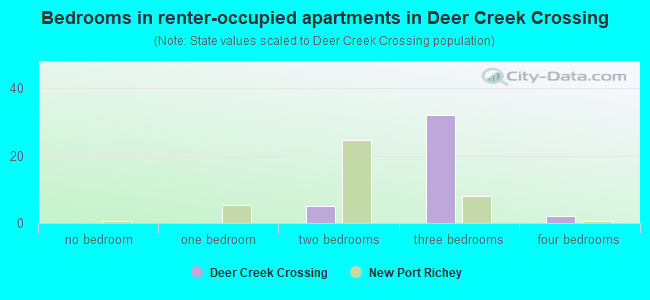
- Bedrooms in renter-occupied apartments in Deer Creek Crossing
- 0no bedroom
- 01 bedroom
- 52 bedrooms
- 323 bedrooms
- 24 bedrooms
- 05+ bedrooms
Average number of cars or other vehicles available in houses/condos:
Average number of cars or other vehicles available in apartments:
| This neighborhood: | 1.9 |
| New Port Richey: | 1.6 |
Average number of cars or other vehicles available in apartments:
| Here: | 2.1 |
| city: | 1.2 |
Percentage of units with a mortgage:
| Deer Creek Crossing: | 57.0% |
| New Port Richey: | 46.1% |

- Year house built in Deer Creek Crossing
- 02020 or later
- 12010 to 2019
- 402000 to 2009
- 731990 to 1999
- 1451980 to 1989
- 171970 to 1979
- 11960 to 1969
- 21950 to 1959
- 01940 to 1949
- 01939 or earlier
City-data.com crime index for city in 2020 (higher means more crime):
| City: | 346.6 |
| U.S. average: | 219.5 |
Travel time to work (commute)
![Travel time to work (commute)]()
- 1Less than 5 minutes
- 245 to 9 minutes
- 3110 to 14 minutes
- 3215 to 19 minutes
- 4220 to 24 minutes
- 925 to 29 minutes
- 3830 to 34 minutes
- 935 to 39 minutes
- 840 to 44 minutes
- 4745 to 59 minutes
- 1760 to 89 minutes
- 890 or more minutes

Means of transportation to work
![Means of transportation to work]()
- 82.0%240Drove a car alone
- 5.5%16Carpooled
- 1.0%3Motorcycle
- 0.7%2Bicycle
- 1.4%4Walked
- 8.2%24Worked at home

Time leaving home to go to work
![Time leaving home to go to work]()
- 512:00 a.m. to 4:59 a.m.
- 85:00 a.m. to 5:29 a.m.
- 175:30 a.m. to 5:59 a.m.
- 266:00 a.m. to 6:29 a.m.
- 266:30 a.m. to 6:59 a.m.
- 257:00 a.m. to 7:29 a.m.
- 217:30 a.m. to 7:59 a.m.
- 558:00 a.m. to 8:29 a.m.
- 88:30 a.m. to 8:59 a.m.
- 199:00 a.m. to 9:59 a.m.
- 710:00 a.m. to 10:59 a.m.
- 411:00 a.m. to 11:59 a.m.
- 2212:00 p.m. to 3:59 p.m.
- 144:00 p.m. to 11:59 p.m.

Occupations of males:
- Percentage of males in management occupations (except farmers):
Here: 12.0% city: 7.5%
- Percentage of males in business and financial operations occupations:
Here: 4.4% city: 3.7%
- Percentage of males in computer and mathematical occupations:
Here: 1.3% city: 3.5%
- Percentage of males in community and social services occupations:
Here: 1.5% city: 0.8%
- Percentage of males in education, training, and library occupations:
Here: 2.2% city: 1.8%
- Percentage of males in healthcare practitioners and technical occupations:
Here: 3.4% city: 1.5%
- Percentage of males in service occupations:
Here: 14.7% city: 23.3%
- Percentage of males in sales and office occupations:
Here: 36.6% city: 16.7%
- Percentage of males in construction, extraction, and maintenance occupations:
Here: 7.5% city: 12.7%
- Percentage of males in production occupations:
Here: 5.8% city: 3.3%
- Percentage of males in transportation occupations:
Here: 4.4% city: 6.1%
- Percentage of males in material moving occupations:
Here: 1.0% city: 6.4%
Occupations of females:
- Percentage of females in management occupations (except farmers):
Here: 15.0% city: 6.8%
- Percentage of females in business and financial operations occupations:
Here: 4.0% city: 4.8%
- Percentage of females in life, physical, and social science occupations:
Here: 1.2% city: 0.0%
- Percentage of females in education, training, and library occupations:
Here: 3.5% city: 6.5%
- Percentage of females in healthcare practitioners and technical occupations:
Here: 7.6% city: 12.5%
- Percentage of females in service occupations:
Here: 13.0% city: 23.3%
- Percentage of females in sales and office occupations:
Here: 53.3% city: 30.9%
- Percentage of females in production occupations:
Here: 1.5% city: 2.4%
- Percentage of females in transportation occupations:
Here: 1.1% city: 3.7%
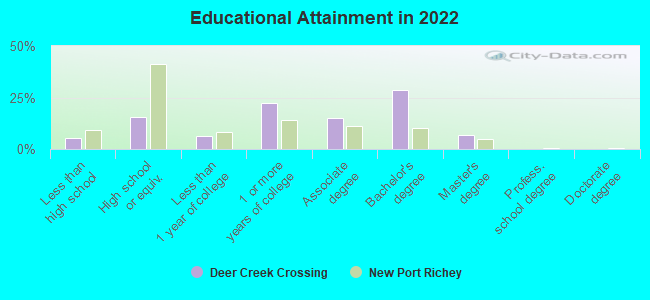
Education in this neighborhood (subdivision or community):
- Percentage of people 3 years and older in K-12 schools:
Deer Creek Crossing: 19.8% New Port Richey: 8.6%
- Percentage of people 3 years and older in undergraduate colleges:
Deer Creek Crossing: 7.8% New Port Richey: 2.9%
- Percentage of people 3 years and older in grad. or professional schools:
Deer Creek Crossing: 0.9% New Port Richey: 0.7%
- Percentage of students K-12 enrolled in private schools:
Deer Creek Crossing: 11.9% New Port Richey: 11.9%
Percentage of population below poverty level:
| Deer Creek Crossing: | 4.7% |
| New Port Richey: | 13.3% |
Median year owner moved in (as recorded in 2022):
Median year renter moved in (as recorded in 2022):
| Deer Creek Crossing: | 2012 |
| New Port Richey: | 2012 |
Median year renter moved in (as recorded in 2022):
| Deer Creek Crossing: | 2011 |
| New Port Richey: | 2017 |
Percentage of married-couple families with both working:
| Deer Creek Crossing: | 38.8% |
| New Port Richey: | 54.1% |
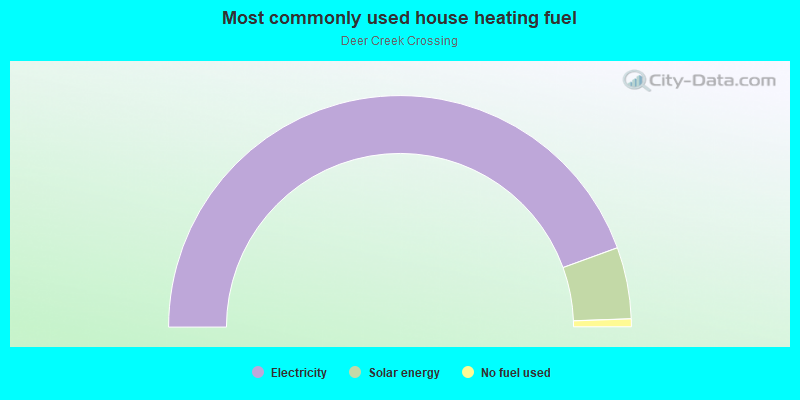
- 88.9%Electricity
- 10.0%Solar energy
- 1.1%No fuel used
Roads and streets:
Cecelia Dr
Length: 0.84 miles
Directions: E-W, N-S, SW-NE
Directions: E-W, N-S, SW-NE
Royal Hart Dr
Length: 0.62 miles
Direction: E-W
Address range: 8000 to 8599
Direction: E-W
Address range: 8000 to 8599
Matthew Dr
Length: 0.37 miles
Directions: E-W, N-S, SE-NW, SW-NE
Address range: 8100 to 8399
Directions: E-W, N-S, SE-NW, SW-NE
Address range: 8100 to 8399
Yearling Ln
Length: 0.33 miles
Directions: E-W, N-S, SE-NW, SW-NE
Address range: 8300 to 8599
Directions: E-W, N-S, SE-NW, SW-NE
Address range: 8300 to 8599
Setters Point Dr
Length: 0.31 miles
Directions: E-W, N-S, SE-NW, SW-NE
Address range: 8100 to 8299
Directions: E-W, N-S, SE-NW, SW-NE
Address range: 8100 to 8299
Spike Horn Dr
Length: 0.29 miles
Directions: N-S, SW-NE
Address range: 5001 to 5299
Directions: N-S, SW-NE
Address range: 5001 to 5299
Farnsworth Ln
Length: 0.17 miles
Directions: N-S, SE-NW
Address range: 5000 to 5199
Directions: N-S, SE-NW
Address range: 5000 to 5199
Drury Ct
Length: 0.14 miles
Directions: N-S, SE-NW, SW-NE
Address range: 5100 to 5299
Directions: N-S, SE-NW, SW-NE
Address range: 5100 to 5299
Deer Foot Dr
Length: 0.10 miles
Directions: E-W, SE-NW
Address range: 8000 to 8099
Directions: E-W, SE-NW
Address range: 8000 to 8099
Stag Ln
Length: 0.09 miles
Direction: E-W
Address range: 8000 to 8199
Direction: E-W
Address range: 8000 to 8199
Red Roe Dr
Length: 0.07 miles
Directions: E-W, SE-NW
Address range: 8400 to 8499
Directions: E-W, SE-NW
Address range: 8400 to 8499
Circus Ln
Length: 0.07 miles
Directions: E-W, N-S
Address range: 5000 to 5199
Directions: E-W, N-S
Address range: 5000 to 5199
Picnic Ct
Length: 0.04 miles
Directions: E-W, SE-NW, SW-NE
Directions: E-W, SE-NW, SW-NE
Worth Ct
Length: 0.04 miles
Directions: E-W, SE-NW
Address range: 5100 to 5199
Directions: E-W, SE-NW
Address range: 5100 to 5199
Powerlines:
Power Line
Length: 0.17 miles
Direction: N-S
Direction: N-S