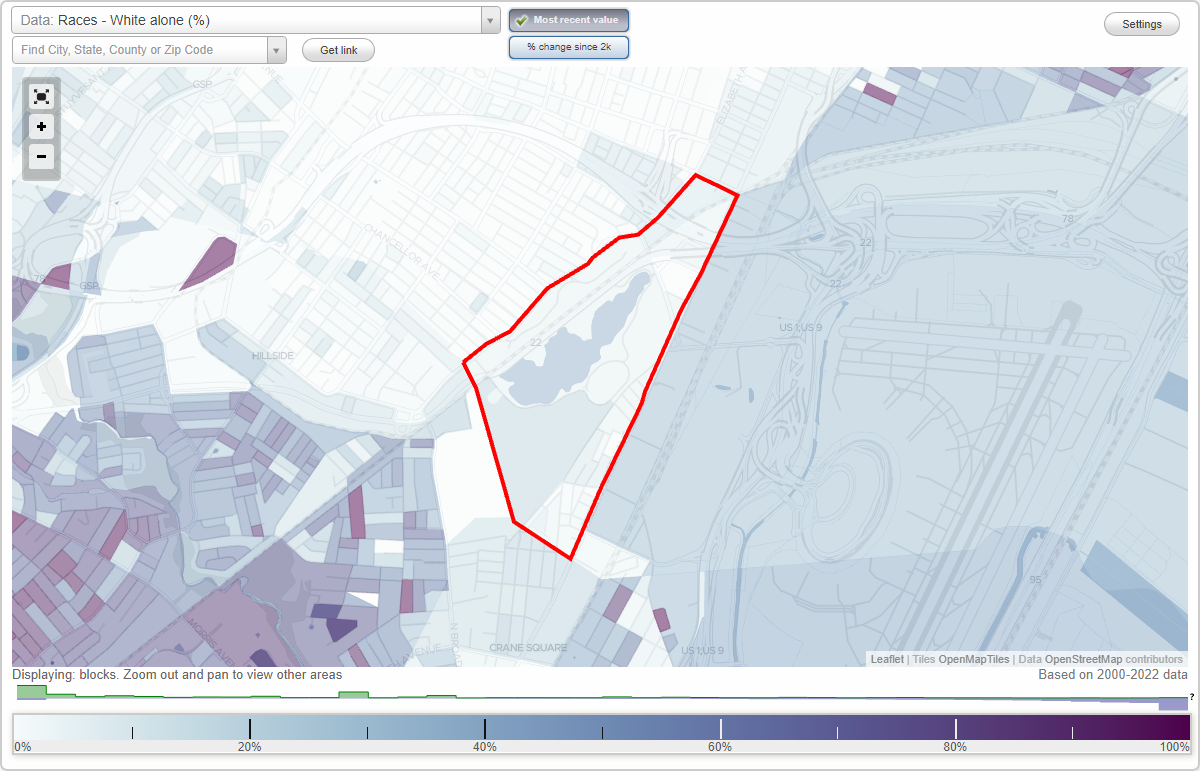
Dayton neighborhood in Newark, New Jersey (NJ), 07114, 07112 detailed profile
Settings
X

Business Search - 14 Million verified businesses
Area: 0.893 square miles
Population: 19,586
Population density:
| Dayton: | 21,924 people per square mile |
| Newark: | 12,831 people per square mile |

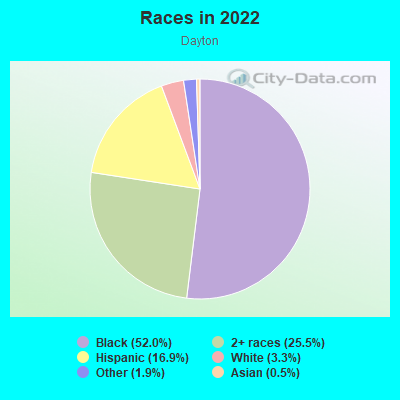
- 13,37052.0%Black
- 6,56825.5%Two or more races
- 4,33416.9%Hispanic or Latino
- 8383.3%White
- 4931.9%Some other race
- 1170.5%Asian
Distribution of median household income
![Distribution of median household income]()
- 1,000Less than $10,000
- 3,326$10,000 to $19,999
- 942$20,000 to $29,999
- 1,292$30,000 to $39,999
- 1,655$40,000 to $49,999
- 426$50,000 to $59,999
- 374$60,000 to $74,999
- 620$75,000 to $99,999
- 958$100,000 to $124,999
- 571$125,000 to $149,999
- 1,530$150,000 to $199,999
- 1,164$200,000 or more

Distribution of owner-occupied house/condo value
![Distribution of owner-occupied house/condo value]()
- 583Less than $50,000
- 1,236$50,000 to $99,999
- 370$100,000 to $149,999
- 1,081$150,000 to $199,999
- 359$200,000 to $249,999
- 2,297$250,000 to $299,999
- 222$300,000 to $399,999
- 229$400,000 to $499,999
- 1,607$500,000 to $749,999
- 368$750,000 to $999,999

Distribution of rent paid by renters
![Distribution of rent paid by renters]()
- 168Less than $100
- 1,813$100 to $199
- 2,363$200 to $299
- 1,270$300 to $399
- 707$400 to $499
- 871$500 to $599
- 963$600 to $699
- 1,482$700 to $799
- 160$800 to $899
- 401$900 to $999
- 756$1,000 to $1,249
- 93$1,250 to $1,499
- 2,303$1,500 to $1,999
- 1,955$2,000 or more

Median rent in 2022:
| Dayton: | $398 |
| Newark: | $1,126 |
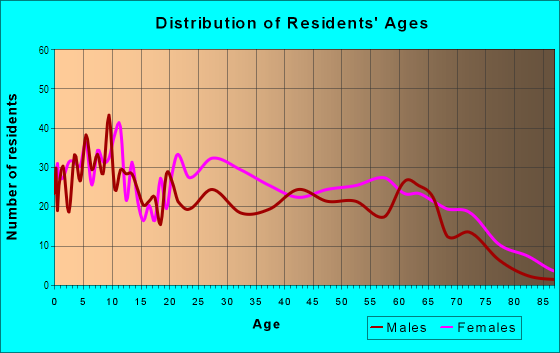
| Males: | 12,468 |
| Females: | 7,118 |
Males:
| This neighborhood: | 37.9 years |
| Whole city: | 33.9 years |
| This neighborhood: | 39.4 years |
| Whole city: | 36.0 years |
Average household size:
| Dayton: | 5.7 people |
| Newark: | 2.6 people |
Percentage of family households:
| Dayton: | 26.9% |
| Newark: | 47.4% |
| Here: | 13.3% |
| Newark: | 30.2% |
Percentage of married-couple families with children (among all households):
| Dayton: | 27.3% |
| Newark: | 18.2% |
Percentage of single-mother households (among all households):
| Dayton: | 15.9% |
| Newark: | 14.8% |
Percentage of never married males 15 years old and over:
Percentage of never married females 15 years old and over:
| Dayton: | 45.9% |
| Newark: | 24.8% |
Percentage of never married females 15 years old and over:
| Dayton: | 16.9% |
| city: | 25.2% |
Percentage of people that speak English not well or not at all:
| Dayton: | 5.3% |
| Newark: | 15.2% |
Percentage of people born in this state:
Percentage of people born in another U.S. state:
Percentage of native residents but born outside the U.S.:
Percentage of foreign born residents:
| Here: | 66.3% |
| Newark: | 47.9% |
Percentage of people born in another U.S. state:
| Dayton: | 16.2% |
| Newark: | 11.7% |
Percentage of native residents but born outside the U.S.:
| Here: | 3.2% |
| city: | 5.5% |
Percentage of foreign born residents:
| Here: | 14.3% |
| Newark: | 34.9% |
Owner-occupied
Renter-occupied

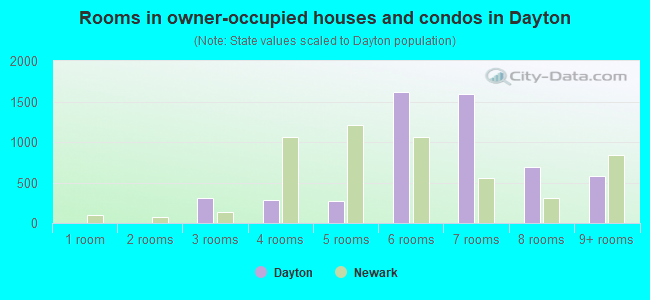
- Rooms in owner-occupied houses and condos in Dayton
- 01 room
- 02 rooms
- 3113 rooms
- 2864 rooms
- 2675 rooms
- 1,6146 rooms
- 1,5957 rooms
- 6908 rooms
- 5759+ rooms
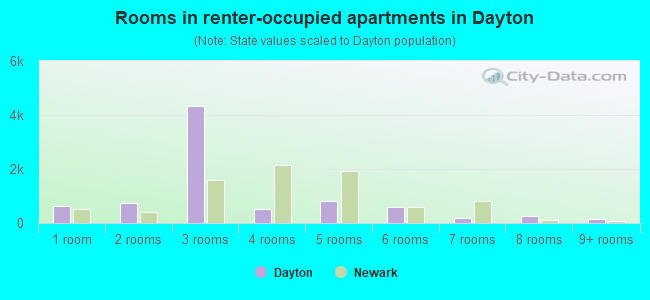
- Rooms in renter-occupied apartments in Dayton
- 6271 room
- 7232 rooms
- 4,3443 rooms
- 5134 rooms
- 8125 rooms
- 5756 rooms
- 1727 rooms
- 2558 rooms
- 1419+ rooms
Owner-occupied
Renter-occupied
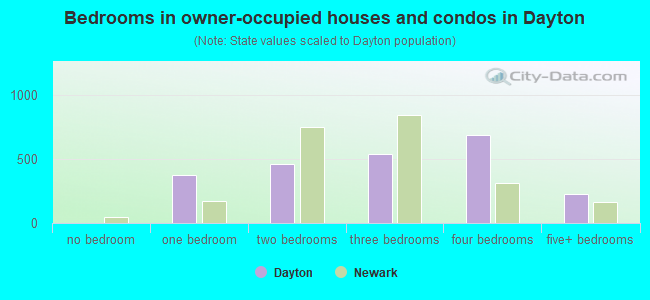
- Bedrooms in owner-occupied houses and condos in Dayton
- 0no bedroom
- 3731 bedroom
- 4612 bedrooms
- 5363 bedrooms
- 6864 bedrooms
- 2275+ bedrooms
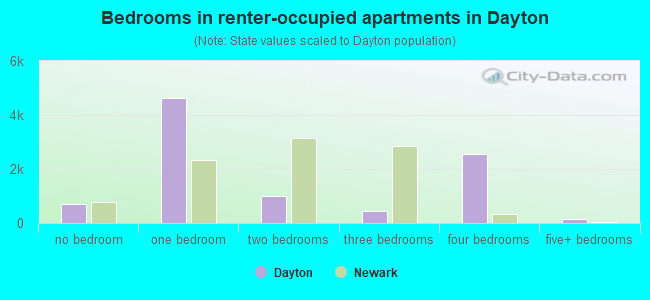
- Bedrooms in renter-occupied apartments in Dayton
- 715no bedroom
- 4,6361 bedroom
- 9952 bedrooms
- 4473 bedrooms
- 2,5614 bedrooms
- 1415+ bedrooms
Average number of cars or other vehicles available in houses/condos:
Average number of cars or other vehicles available in apartments:
| This neighborhood: | |
| Newark: |
Average number of cars or other vehicles available in apartments:
| Here: | 0.5 |
| city: | 0.8 |
Percentage of units with a mortgage:
| Dayton: | 63.3% |
| Newark: | 65.4% |
Average estimated value of detached houses in 2022 (38.4% of all units):
| Dayton: | $261,782 |
| Newark: | $412,982 |
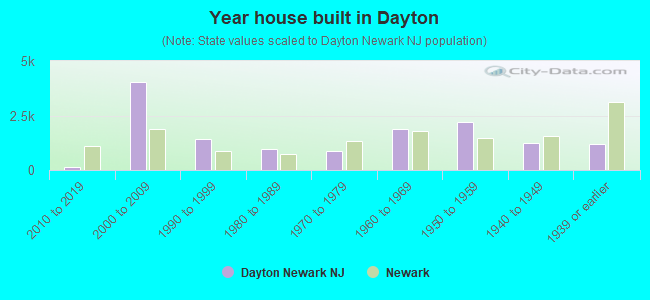
- Year house built in Dayton
- 02020 or later
- 1482010 to 2019
- 4,0502000 to 2009
- 1,4411990 to 1999
- 9441980 to 1989
- 8781970 to 1979
- 1,8701960 to 1969
- 2,1901950 to 1959
- 1,2171940 to 1949
- 1,1791939 or earlier
City-data.com crime index for city in 2020 (higher means more crime):
| City: | 273.7 |
| U.S. average: | 219.5 |
Travel time to work (commute)
![Travel time to work (commute)]()
- 279Less than 5 minutes
- 1335 to 9 minutes
- 8410 to 14 minutes
- 78815 to 19 minutes
- 34020 to 24 minutes
- 9525 to 29 minutes
- 18130 to 34 minutes
- 2935 to 39 minutes
- 15340 to 44 minutes
- 37545 to 59 minutes
- 14860 to 89 minutes
- 6590 or more minutes

Means of transportation to work
![Means of transportation to work]()
- 51.6%2,010Drove a car alone
- 9.4%366Carpooled
- 27.8%1,084Bus
- 23.5%915Subway or elevated rail
- 52.5%2,044Long-distance train or commuter rail
- 8.1%317Taxi
- 4.5%176Motorcycle
- 6.1%238Walked
- 3.6%141Other means
- 56.2%2,187Worked at home

Time leaving home to go to work
![Time leaving home to go to work]()
- 4712:00 a.m. to 4:59 a.m.
- 595:00 a.m. to 5:29 a.m.
- 345:30 a.m. to 5:59 a.m.
- 4646:00 a.m. to 6:29 a.m.
- 1596:30 a.m. to 6:59 a.m.
- 2577:00 a.m. to 7:29 a.m.
- 837:30 a.m. to 7:59 a.m.
- 808:00 a.m. to 8:29 a.m.
- 418:30 a.m. to 8:59 a.m.
- 369:00 a.m. to 9:59 a.m.
- 19210:00 a.m. to 10:59 a.m.
- 22611:00 a.m. to 11:59 a.m.
- 17812:00 p.m. to 3:59 p.m.
- 1704:00 p.m. to 11:59 p.m.

Occupations of males:
- Percentage of males in management occupations (except farmers):
Here: 20.4% city: 4.7%
- Percentage of males in business and financial operations occupations:
Here: 3.0% city: 3.2%
- Percentage of males in education, training, and library occupations:
Here: 4.8% city: 2.0%
- Percentage of males in service occupations:
Here: 7.3% city: 18.4%
- Percentage of males in sales and office occupations:
Here: 22.2% city: 13.2%
- Percentage of males in construction, extraction, and maintenance occupations:
Here: 6.5% city: 18.9%
- Percentage of males in production occupations:
Here: 9.1% city: 6.5%
- Percentage of males in transportation occupations:
Here: 1.9% city: 12.5%
- Percentage of males in material moving occupations:
Here: 8.7% city: 7.0%
Occupations of females:
- Percentage of females in management occupations (except farmers):
Here: 1.2% city: 7.3%
- Percentage of females in business and financial operations occupations:
Here: 12.2% city: 3.9%
- Percentage of females in life, physical, and social science occupations:
Here: 1.6% city: 0.7%
- Percentage of females in education, training, and library occupations:
Here: 2.4% city: 7.1%
- Percentage of females in service occupations:
Here: 29.9% city: 30.4%
- Percentage of females in sales and office occupations:
Here: 48.5% city: 27.3%
- Percentage of females in production occupations:
Here: 4.5% city: 5.2%
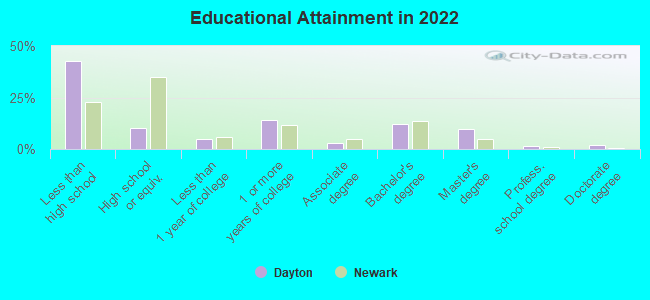
Education in this neighborhood (subdivision or community):
- Percentage of people 3 years and older in K-12 schools:
Dayton: 35.7% Newark: 17.5%
- Percentage of people 3 years and older in undergraduate colleges:
Dayton: 3.9% Newark: 6.3%
- Percentage of people 3 years and older in grad. or professional schools:
Dayton: 9.1% Newark: 1.5%
- Percentage of students K-12 enrolled in private schools:
Dayton: 59.0% Newark: 6.6%
Percentage of population below poverty level:
| Dayton: | 34.0% |
| Newark: | 24.0% |
Median year renter moved in (as recorded in 2022):
| Dayton: | 2014 |
| Newark: | 2017 |
Percentage of married-couple families with both working:
| Dayton: | 339.8% |
| Newark: | 57.9% |
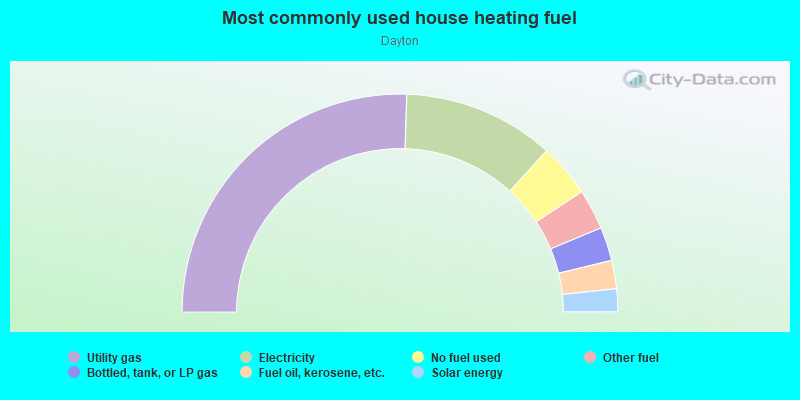
- 51.0%Utility gas
- 22.5%Electricity
- 7.9%No fuel used
- 6.0%Other fuel
- 5.0%Bottled, tank, or LP gas
- 4.2%Fuel oil, kerosene, etc.
- 3.4%Solar energy
Limited-access highways (interstate or state) in this neighborhood:
I- 78
Length: 0.24 miles
Directions: E-W, SE-NW
Directions: E-W, SE-NW
Highways in this neighborhood:
US Hwy 22
Length: 1.46 miles
Directions: E-W, SW-NE
Directions: E-W, SW-NE
Frelinghuysen Ave (State Rte 27)
Length: 0.45 miles
Direction: SW-NE
Address range: 269 to 697
Direction: SW-NE
Address range: 269 to 697
Roads and streets:
Weequahic Park Dr
Length: 2.75 miles
Directions: E-W, N-S, SE-NW, SW-NE
Directions: E-W, N-S, SE-NW, SW-NE
Dayton St
Length: 1.09 miles
Direction: SW-NE
Address range: 18 to 397
Direction: SW-NE
Address range: 18 to 397
Elizabeth Ave
Length: 0.55 miles
Directions: E-W, SW-NE
Directions: E-W, SW-NE
Empire St
Length: 0.39 miles
Directions: E-W, SW-NE
Address range: 1 to 126
Directions: E-W, SW-NE
Address range: 1 to 126
Meeker Ave
Length: 0.39 miles
Directions: N-S, SE-NW
Directions: N-S, SE-NW
Hanford St
Length: 0.33 miles
Directions: N-S, SW-NE
Address range: 1 to 132
Directions: N-S, SW-NE
Address range: 1 to 132
Ross St
Length: 0.30 miles
Direction: SW-NE
Address range: 1 to 112
Direction: SW-NE
Address range: 1 to 112
Ludlow St
Length: 0.30 miles
Direction: N-S
Address range: 1 to 126
Direction: N-S
Address range: 1 to 126
Victoria St
Length: 0.19 miles
Direction: E-W
Address range: 1 to 99
Direction: E-W
Address range: 1 to 99
Church Ter
Length: 0.19 miles
Directions: E-W, SW-NE
Address range: 101 to 123
Directions: E-W, SW-NE
Address range: 101 to 123
Evergreen Ave
Length: 0.13 miles
Direction: E-W
Address range: 1 to 38
Direction: E-W
Address range: 1 to 38
Foster St
Length: 0.13 miles
Direction: SE-NW
Address range: 1 to 42
Direction: SE-NW
Address range: 1 to 42
Seth Boyden Ter
Length: 0.13 miles
Direction: SW-NE
Direction: SW-NE
Whittier Pl
Length: 0.12 miles
Direction: SE-NW
Address range: 1 to 73
Direction: SE-NW
Address range: 1 to 73
Emerson Pl
Length: 0.11 miles
Direction: SE-NW
Address range: 1 to 43
Direction: SE-NW
Address range: 1 to 43
Dayton Ter
Length: 0.09 miles
Direction: E-W
Direction: E-W
Wharton St
Length: 0.07 miles
Direction: E-W
Address range: 33 to 60
Direction: E-W
Address range: 33 to 60
Van Vechten St
Length: 0.07 miles
Direction: E-W
Address range: 1 to 27
Direction: E-W
Address range: 1 to 27
Railroad features:
Conrail RR
Length: 2.09 miles
Directions: E-W, SW-NE
Directions: E-W, SW-NE
Roads and streets:
Sherman Ave
Length: 0.00 miles
Direction: N-S
Direction: N-S