Conway neighborhood in Orlando, Florida (FL), 32812 detailed profile
Settings
X


Business Search - 14 Million verified businesses
Area: 0.352 square miles
Population: 942
Population density:
| Conway: | 2,678 people per square mile |
| Orlando: | 3,381 people per square mile |

- 52354.1%White
- 22823.6%Hispanic or Latino
- 687.0%Black
- 646.6%Two or more races
- 505.2%Some other race
- 343.5%Asian

Median household income in 2022:
| Conway: | $76,462 |
| Orlando: | $65,354 |
Distribution of median household income
![Distribution of median household income]()
- 23Less than $10,000
- 26$10,000 to $19,999
- 34$20,000 to $29,999
- 11$30,000 to $39,999
- 40$40,000 to $49,999
- 21$50,000 to $59,999
- 138$60,000 to $74,999
- 53$75,000 to $99,999
- 51$100,000 to $124,999
- 28$125,000 to $149,999
- 72$150,000 to $199,999
- 31$200,000 or more

Distribution of owner-occupied house/condo value
![Distribution of owner-occupied house/condo value]()
- 64Less than $50,000
- 115$50,000 to $99,999
- 14$100,000 to $149,999
- 22$150,000 to $199,999
- 31$200,000 to $249,999
- 58$250,000 to $299,999
- 150$300,000 to $399,999
- 60$400,000 to $499,999
- 10$500,000 to $749,999
- 9$750,000 to $999,999
- 11$1,000,000 or more

Distribution of rent paid by renters
![Distribution of rent paid by renters]()
- 7Less than $100
- 88$100 to $199
- 39$400 to $499
- 5$500 to $599
- 26$700 to $799
- 57$800 to $899
- 58$900 to $999
- 94$1,000 to $1,249
- 27$1,250 to $1,499
- 31$1,500 to $1,999
- 109$2,000 or more

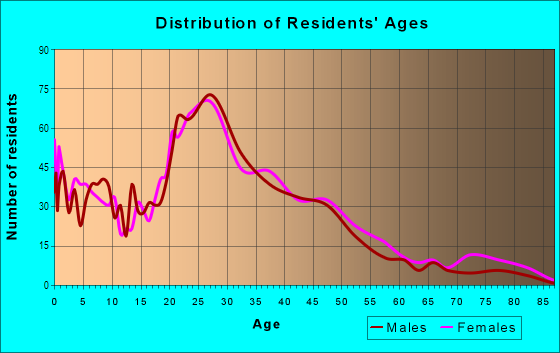
| Males: | 450 |
| Females: | 492 |
Males:
| This neighborhood: | 39.5 years |
| Whole city: | 34.1 years |
| This neighborhood: | 48.2 years |
| Whole city: | 37.3 years |
Average household size:
| Conway: | 2.3 people |
| Orlando: | 2.3 people |
Percentage of family households:
| Conway: | 45.4% |
| Orlando: | 43.6% |
| Here: | 41.2% |
| Orlando: | 35.3% |
Percentage of married-couple families with children (among all households):
| Conway: | 16.6% |
| Orlando: | 25.1% |
Percentage of single-mother households (among all households):
| Conway: | 7.5% |
| Orlando: | 15.2% |
Percentage of never married males 15 years old and over:
Percentage of never married females 15 years old and over:
| Conway: | 19.0% |
| Orlando: | 21.6% |
Percentage of never married females 15 years old and over:
| Conway: | 18.9% |
| city: | 19.5% |
Percentage of people that speak English not well or not at all:
| Conway: | 0.3% |
| Orlando: | 8.8% |
Percentage of people born in this state:
Percentage of people born in another U.S. state:
Percentage of native residents but born outside the U.S.:
Percentage of foreign born residents:
| Here: | 38.0% |
| Orlando: | 34.9% |
Percentage of people born in another U.S. state:
| Conway: | 32.1% |
| Orlando: | 33.1% |
Percentage of native residents but born outside the U.S.:
| Here: | 17.1% |
| city: | 8.5% |
Percentage of foreign born residents:
| Here: | 12.7% |
| Orlando: | 23.6% |

Owner-occupied
Renter-occupied


- Rooms in owner-occupied houses and condos in Conway
- 01 room
- 42 rooms
- 83 rooms
- 314 rooms
- 405 rooms
- 856 rooms
- 927 rooms
- 368 rooms
- 409+ rooms

- Rooms in renter-occupied apartments in Conway
- 361 room
- 32 rooms
- 43 rooms
- 494 rooms
- 705 rooms
- 186 rooms
- 267 rooms
- 48 rooms
- 149+ rooms
Owner-occupied
Renter-occupied

- Bedrooms in owner-occupied houses and condos in Conway
- 0no bedroom
- 41 bedroom
- 592 bedrooms
- 1453 bedrooms
- 604 bedrooms
- 35+ bedrooms

- Bedrooms in renter-occupied apartments in Conway
- 36no bedroom
- 41 bedroom
- 1192 bedrooms
- 203 bedrooms
- 254 bedrooms
- 05+ bedrooms
Average number of cars or other vehicles available in houses/condos:
Average number of cars or other vehicles available in apartments:
| This neighborhood: | 3.3 |
| Orlando: | 1.9 |
Average number of cars or other vehicles available in apartments:
| Here: | 3.0 |
| city: | 1.3 |
Percentage of units with a mortgage:
| Conway: | 72.8% |
| Orlando: | 71.0% |
Housing prices:
- Average estimated value of detached houses in 2022 (69.2% of all units):
Conway: $362,651 Orlando: $408,856
- Average estimated '22 value of housing units in 5-or-more-unit structures (1.9% of all units):
Conway: $149,553 Orlando: $235,330

- Year house built in Conway
- 22020 or later
- 52010 to 2019
- 422000 to 2009
- 291990 to 1999
- 731980 to 1989
- 1051970 to 1979
- 771960 to 1969
- 1261950 to 1959
- 21940 to 1949
- 51939 or earlier

City-data.com crime index for city in 2020 (higher means more crime):
| City: | 423.0 |
| U.S. average: | 219.5 |
Travel time to work (commute)
![Travel time to work (commute)]()
- 15Less than 5 minutes
- 325 to 9 minutes
- 11110 to 14 minutes
- 26815 to 19 minutes
- 23520 to 24 minutes
- 8325 to 29 minutes
- 32430 to 34 minutes
- 5535 to 39 minutes
- 4940 to 44 minutes
- 645 to 59 minutes
- 2660 to 89 minutes
- 2090 or more minutes

Means of transportation to work
![Means of transportation to work]()
- 80.0%407Drove a car alone
- 7.1%36Carpooled
- 3.1%16Bus
- 5.9%30Taxi
- 0.6%3Bicycle
- 1.4%7Walked
- 3.5%18Other means
- 8.9%45Worked at home

Time leaving home to go to work
![Time leaving home to go to work]()
- 5712:00 a.m. to 4:59 a.m.
- 435:00 a.m. to 5:29 a.m.
- 235:30 a.m. to 5:59 a.m.
- 1076:00 a.m. to 6:29 a.m.
- 606:30 a.m. to 6:59 a.m.
- 1287:00 a.m. to 7:29 a.m.
- 1527:30 a.m. to 7:59 a.m.
- 1718:00 a.m. to 8:29 a.m.
- 938:30 a.m. to 8:59 a.m.
- 979:00 a.m. to 9:59 a.m.
- 6310:00 a.m. to 10:59 a.m.
- 611:00 a.m. to 11:59 a.m.
- 8712:00 p.m. to 3:59 p.m.
- 1314:00 p.m. to 11:59 p.m.

Occupations of males:
- Percentage of males in management occupations (except farmers):
Here: 11.4% city: 13.1%
- Percentage of males in business and financial operations occupations:
Here: 9.0% city: 6.3%
- Percentage of males in computer and mathematical occupations:
Here: 6.5% city: 4.7%
- Percentage of males in architecture and engineering occupations:
Here: 3.5% city: 3.3%
- Percentage of males in life, physical, and social science occupations:
Here: 2.5% city: 0.6%
- Percentage of males in community and social services occupations:
Here: 1.0% city: 0.5%
- Percentage of males in legal occupations:
Here: 1.1% city: 1.5%
- Percentage of males in arts, design, entertainment, sports, and media occupations:
Here: 1.8% city: 3.3%
- Percentage of males in service occupations:
Here: 17.8% city: 15.4%
- Percentage of males in sales and office occupations:
Here: 19.5% city: 18.7%
- Percentage of males in construction, extraction, and maintenance occupations:
Here: 5.6% city: 7.6%
- Percentage of males in production occupations:
Here: 4.0% city: 2.7%
- Percentage of males in transportation occupations:
Here: 6.5% city: 7.4%
- Percentage of males in material moving occupations:
Here: 5.8% city: 4.9%
Occupations of females:
- Percentage of females in management occupations (except farmers):
Here: 12.2% city: 10.7%
- Percentage of females in business and financial operations occupations:
Here: 3.6% city: 7.6%
- Percentage of females in computer and mathematical occupations:
Here: 2.6% city: 1.8%
- Percentage of females in community and social services occupations:
Here: 1.3% city: 2.0%
- Percentage of females in legal occupations:
Here: 2.9% city: 2.0%
- Percentage of females in education, training, and library occupations:
Here: 10.2% city: 6.5%
- Percentage of females in arts, design, entertainment, sports, and media occupations:
Here: 1.1% city: 2.5%
- Percentage of females in healthcare practitioners and technical occupations:
Here: 9.2% city: 8.2%
- Percentage of females in service occupations:
Here: 25.9% city: 20.2%
- Percentage of females in sales and office occupations:
Here: 29.2% city: 28.3%
- Percentage of females in transportation occupations:
Here: 6.0% city: 2.9%
Percentage of people 16-64 in Armed Forces:
| Conway: | 0.0% |
| Orlando: | 0.8% |
Education in this neighborhood (subdivision or community):
- Percentage of people 3 years and older in K-12 schools:
Conway: 17.2% Orlando: 14.9%
- Percentage of people 3 years and older in undergraduate colleges:
Conway: 4.6% Orlando: 5.5%
- Percentage of people 3 years and older in grad. or professional schools:
Conway: 5.3% Orlando: 1.6%
- Percentage of students K-12 enrolled in private schools:
Conway: 48.1% Orlando: 13.8%
Percentage of population below poverty level:
| Conway: | 20.9% |
| Orlando: | 14.2% |
Median year owner moved in (as recorded in 2022):
| Conway: | 2009 |
| Orlando: | 2015 |
Percentage of married-couple families with both working:
| Conway: | 125.7% |
| Orlando: | 64.1% |

- 89.7%Electricity
- 3.0%Solar energy
- 2.3%Fuel oil, kerosene, etc.
- 1.9%No fuel used
- 1.7%Bottled, tank, or LP gas
- 1.5%Utility gas
Highways in this neighborhood:
State Hwy 15 (S Conway Rd)
Length: 1.06 miles
Direction: N-S
Address range: 1627 to 2999
Direction: N-S
Address range: 1627 to 2999
Roads and streets:
Benedictine Cir
Length: 0.24 miles
Directions: E-W, N-S, SE-NW, SW-NE
Address range: 4200 to 4399
Directions: E-W, N-S, SE-NW, SW-NE
Address range: 4200 to 4399
Edmundshire Rd
Length: 0.22 miles
Directions: E-W, N-S, SW-NE
Address range: 1609 to 1899
Directions: E-W, N-S, SW-NE
Address range: 1609 to 1899
Thomassa Ct
Length: 0.15 miles
Directions: E-W, N-S, SE-NW, SW-NE
Address range: 4026 to 4399
Directions: E-W, N-S, SE-NW, SW-NE
Address range: 4026 to 4399
Lake Tennessee Dr
Length: 0.14 miles
Directions: E-W, N-S, SE-NW, SW-NE
Address range: 4200 to 4422
Directions: E-W, N-S, SE-NW, SW-NE
Address range: 4200 to 4422
E Michigan St
Length: 0.13 miles
Direction: E-W
Address range: 4001 to 4499
Direction: E-W
Address range: 4001 to 4499
Watauga Ave
Length: 0.12 miles
Direction: N-S
Address range: 1640 to 1795
Direction: N-S
Address range: 1640 to 1795
Devonshire Ln
Length: 0.11 miles
Direction: E-W
Address range: 4200 to 4328
Direction: E-W
Address range: 4200 to 4328
Lancashire Ln
Length: 0.11 miles
Direction: E-W
Address range: 4195 to 4332
Direction: E-W
Address range: 4195 to 4332
Yorkshire Ln
Length: 0.11 miles
Direction: E-W
Address range: 4198 to 4332
Direction: E-W
Address range: 4198 to 4332
Derbyshire Ln
Length: 0.11 miles
Direction: E-W
Address range: 4196 to 4331
Direction: E-W
Address range: 4196 to 4331
Bolder Ln
Length: 0.08 miles
Direction: N-S
Address range: 2700 to 2799
Direction: N-S
Address range: 2700 to 2799
Graceland Ct
Length: 0.04 miles
Direction: N-S
Address range: 3000 to 3199
Direction: N-S
Address range: 3000 to 3199
Baga Ct
Length: 0.02 miles
Direction: N-S
Address range: 2700 to 2799
Direction: N-S
Address range: 2700 to 2799