Civic Center (Cultural District) neighborhood in Bellingham, Washington (WA), 98225 detailed profile
Settings
X


Business Search - 14 Million verified businesses
Area: 0.090 square miles
Population: 424
Population density:
| Civic Center (Cultural District): | 4,697 people per square mile |
| Bellingham: | 3,662 people per square mile |

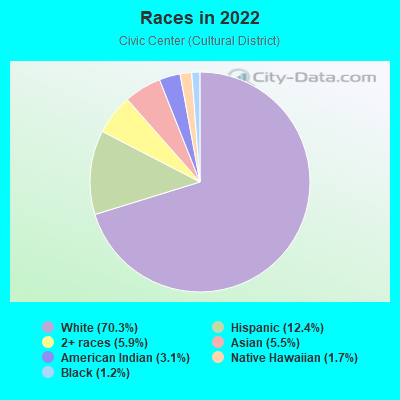
- 29670.3%White
- 5212.4%Hispanic or Latino
- 255.9%Two or more races
- 235.5%Asian
- 133.1%American Indian
- 71.7%Native Hawaiian and Other
Pacific Islander - 51.2%Black
Median household income in 2022:
| Civic Center (Cultural District): | $28,384 |
| Bellingham: | $64,748 |
Distribution of median household income
![Distribution of median household income]()
- 51Less than $10,000
- 50$10,000 to $19,999
- 37$20,000 to $29,999
- 19$30,000 to $39,999
- 17$40,000 to $49,999
- 28$50,000 to $59,999
- 27$60,000 to $74,999
- 25$75,000 to $99,999
- 6$100,000 to $124,999
- 2$125,000 to $149,999
- 2$200,000 or more

Distribution of owner-occupied house/condo value
![Distribution of owner-occupied house/condo value]()
- 2$250,000 to $299,999
- 9$300,000 to $399,999
- 3$400,000 to $499,999
- 1$500,000 to $749,999

Distribution of rent paid by renters
![Distribution of rent paid by renters]()
- 15$200 to $299
- 1$300 to $399
- 7$400 to $499
- 2$500 to $599
- 22$600 to $699
- 15$700 to $799
- 12$800 to $899
- 18$900 to $999
- 77$1,000 to $1,249
- 36$1,250 to $1,499
- 34$1,500 to $1,999
- 5$2,000 or more

Median rent in 2022:
| Civic Center (Cultural District): | $1,099 |
| Bellingham: | $1,372 |
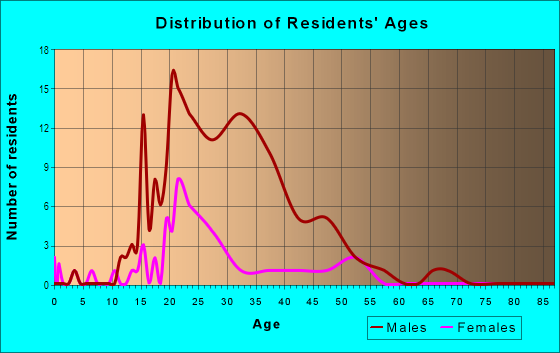
| Males: | 260 |
| Females: | 163 |
Males:
| This neighborhood: | 30.1 years |
| Whole city: | 35.5 years |
| This neighborhood: | 28.6 years |
| Whole city: | 33.5 years |
Average household size:
| Civic Center (Cultural District): | 1.4 people |
| Bellingham: | 2.1 people |
Percentage of family households:
| Civic Center (Cultural District): | 13.8% |
| Bellingham: | 30.7% |
| Here: | 6.4% |
| Bellingham: | 34.3% |
Percentage of married-couple families with children (among all households):
| Civic Center (Cultural District): | 0.0% |
| Bellingham: | 29.6% |
Percentage of single-mother households (among all households):
| Civic Center (Cultural District): | 50.8% |
| Bellingham: | 11.1% |
Percentage of never married males 15 years old and over:
Percentage of never married females 15 years old and over:
| Civic Center (Cultural District): | 45.1% |
| Bellingham: | 22.3% |
Percentage of never married females 15 years old and over:
| Civic Center (Cultural District): | 21.8% |
| city: | 23.0% |
Percentage of people that speak English not well or not at all:
| Civic Center (Cultural District): | 0.6% |
| Bellingham: | 1.4% |
Percentage of people born in this state:
Percentage of people born in another U.S. state:
Percentage of native residents but born outside the U.S.:
Percentage of foreign born residents:
| Here: | 43.1% |
| Bellingham: | 46.3% |
Percentage of people born in another U.S. state:
| Civic Center (Cultural District): | 43.1% |
| Bellingham: | 40.0% |
Percentage of native residents but born outside the U.S.:
| Here: | 3.6% |
| city: | 2.9% |
Percentage of foreign born residents:
| Here: | 10.1% |
| Bellingham: | 10.8% |
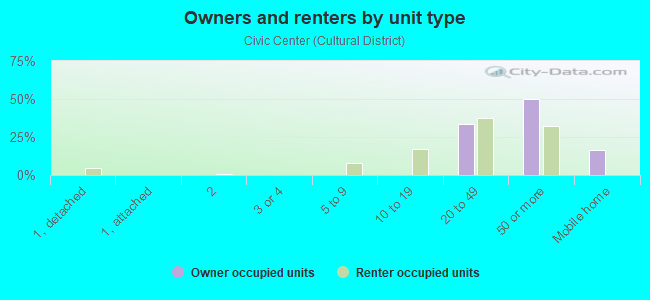
Owner-occupied
Renter-occupied

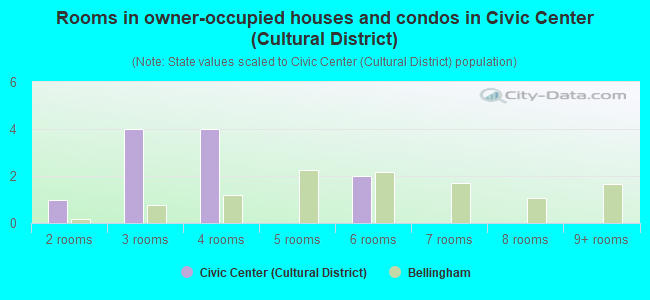
- Rooms in owner-occupied houses and condos in Civic Center <
> - 01 room
- 12 rooms
- 43 rooms
- 44 rooms
- 05 rooms
- 26 rooms
- 07 rooms
- 08 rooms
- 09+ rooms
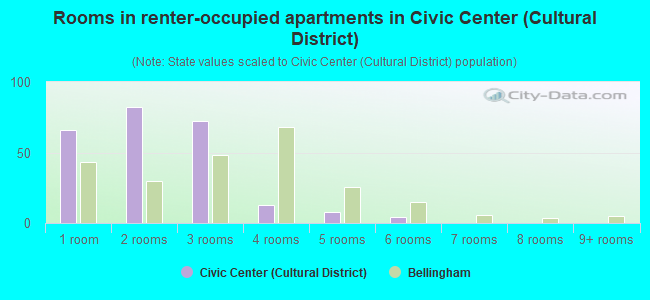
- Rooms in renter-occupied apartments in Civic Center <
> - 661 room
- 822 rooms
- 723 rooms
- 134 rooms
- 85 rooms
- 46 rooms
- 07 rooms
- 08 rooms
- 09+ rooms
Owner-occupied
Renter-occupied
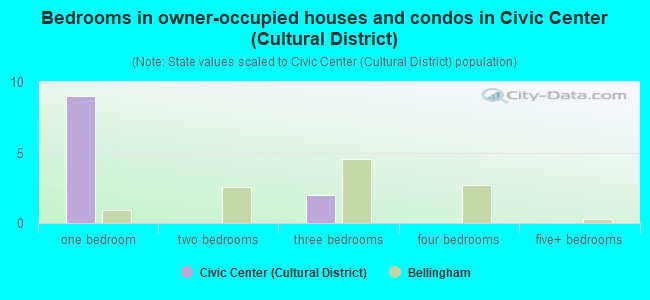
- Bedrooms in owner-occupied houses and condos in Civic Center <
> - 0no bedroom
- 91 bedroom
- 02 bedrooms
- 23 bedrooms
- 04 bedrooms
- 05+ bedrooms
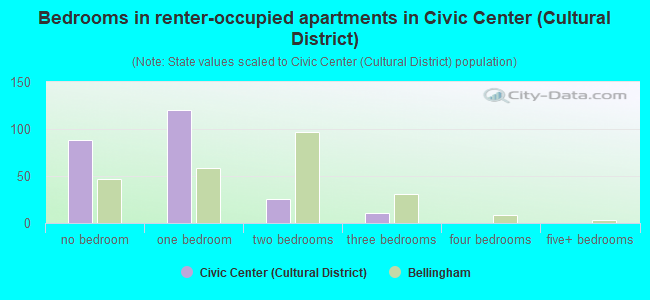
- Bedrooms in renter-occupied apartments in Civic Center <
> - 88no bedroom
- 1201 bedroom
- 262 bedrooms
- 113 bedrooms
- 04 bedrooms
- 05+ bedrooms
Average number of cars or other vehicles available in houses/condos:
Average number of cars or other vehicles available in apartments:
| This neighborhood: | 0.5 |
| Bellingham: | 2.0 |
Average number of cars or other vehicles available in apartments:
| Here: | 1.0 |
| city: | 1.5 |
Percentage of units with a mortgage:
| Civic Center (Cultural District): | 59.1% |
| Bellingham: | 61.8% |
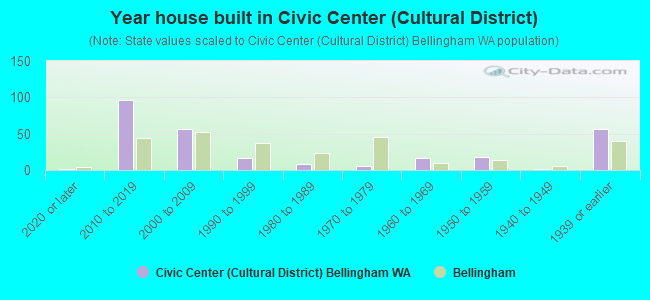
- Year house built in Civic Center <
> - 22020 or later
- 972010 to 2019
- 562000 to 2009
- 171990 to 1999
- 81980 to 1989
- 51970 to 1979
- 161960 to 1969
- 181950 to 1959
- 11940 to 1949
- 561939 or earlier
City-data.com crime index for city in 2020 (higher means more crime):
| City: | 298.0 |
| U.S. average: | 219.5 |
Travel time to work (commute)
![Travel time to work (commute)]()
- 4Less than 5 minutes
- 445 to 9 minutes
- 2910 to 14 minutes
- 4015 to 19 minutes
- 1820 to 24 minutes
- 730 to 34 minutes
- 240 to 44 minutes
- 245 to 59 minutes
- 760 to 89 minutes
- 790 or more minutes

Means of transportation to work
![Means of transportation to work]()
- 50.5%92Drove a car alone
- 4.4%8Carpooled
- 9.3%17Bus
- 0.5%1Motorcycle
- 1.1%2Bicycle
- 22.0%40Walked
- 1.1%2Other means
- 9.3%17Worked at home

Time leaving home to go to work
![Time leaving home to go to work]()
- 112:00 a.m. to 4:59 a.m.
- 15:30 a.m. to 5:59 a.m.
- 96:00 a.m. to 6:29 a.m.
- 66:30 a.m. to 6:59 a.m.
- 67:00 a.m. to 7:29 a.m.
- 217:30 a.m. to 7:59 a.m.
- 218:00 a.m. to 8:29 a.m.
- 218:30 a.m. to 8:59 a.m.
- 89:00 a.m. to 9:59 a.m.
- 1310:00 a.m. to 10:59 a.m.
- 211:00 a.m. to 11:59 a.m.
- 3612:00 p.m. to 3:59 p.m.
- 134:00 p.m. to 11:59 p.m.

Occupations of males:
- Percentage of males in management occupations (except farmers):
Here: 5.5% city: 13.7%
- Percentage of males in business and financial operations occupations:
Here: 5.4% city: 4.6%
- Percentage of males in computer and mathematical occupations:
Here: 13.1% city: 4.2%
- Percentage of males in architecture and engineering occupations:
Here: 2.2% city: 4.5%
- Percentage of males in life, physical, and social science occupations:
Here: 1.8% city: 1.6%
- Percentage of males in community and social services occupations:
Here: 2.6% city: 1.6%
- Percentage of males in education, training, and library occupations:
Here: 6.1% city: 4.5%
- Percentage of males in arts, design, entertainment, sports, and media occupations:
Here: 4.4% city: 2.3%
- Percentage of males in healthcare practitioners and technical occupations:
Here: 1.1% city: 4.0%
- Percentage of males in service occupations:
Here: 21.4% city: 17.8%
- Percentage of males in sales and office occupations:
Here: 19.0% city: 13.8%
- Percentage of males in production occupations:
Here: 7.2% city: 6.9%
- Percentage of males in material moving occupations:
Here: 8.1% city: 5.0%
Occupations of females:
- Percentage of females in management occupations (except farmers):
Here: 6.8% city: 8.2%
- Percentage of females in business and financial operations occupations:
Here: 3.8% city: 5.9%
- Percentage of females in life, physical, and social science occupations:
Here: 2.6% city: 1.0%
- Percentage of females in community and social services occupations:
Here: 1.8% city: 3.8%
- Percentage of females in education, training, and library occupations:
Here: 26.9% city: 11.2%
- Percentage of females in service occupations:
Here: 24.9% city: 26.0%
- Percentage of females in sales and office occupations:
Here: 24.1% city: 22.8%
- Percentage of females in production occupations:
Here: 6.8% city: 3.1%
- Percentage of females in material moving occupations:
Here: 2.2% city: 1.6%
Percentage of people 16-64 in Armed Forces:
| Civic Center (Cultural District): | 1.2% |
| Bellingham: | 0.3% |
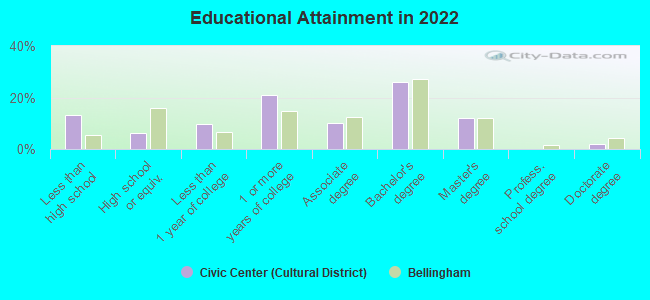
Education in this neighborhood (subdivision or community):
- Percentage of people 3 years and older in K-12 schools:
Civic Center (Cultural District): 7.1% Bellingham: 12.3%
- Percentage of people 3 years and older in undergraduate colleges:
Civic Center (Cultural District): 19.6% Bellingham: 15.0%
- Percentage of people 3 years and older in grad. or professional schools:
Civic Center (Cultural District): 2.4% Bellingham: 1.7%
- Percentage of students K-12 enrolled in private schools:
Civic Center (Cultural District): 0.0% Bellingham: 28.6%
Percentage of population below poverty level:
| Civic Center (Cultural District): | 39.5% |
| Bellingham: | 14.3% |
Median year owner moved in (as recorded in 2022):
Median year renter moved in (as recorded in 2022):
| Civic Center (Cultural District): | 2015 |
| Bellingham: | 2012 |
Median year renter moved in (as recorded in 2022):
| Civic Center (Cultural District): | 2019 |
| Bellingham: | 2020 |
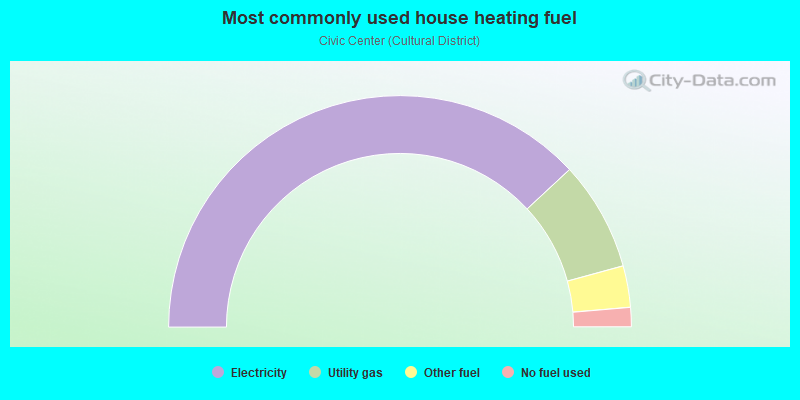
- 76.2%Electricity
- 15.3%Utility gas
- 5.8%Other fuel
- 2.7%No fuel used
Roads and streets:
Grand Ave (Grand St)
Length: 0.38 miles
Directions: N-S, SW-NE
Address range: 100 to 599
Directions: N-S, SW-NE
Address range: 100 to 599
Central Ave
Length: 0.33 miles
Direction: E-W
Address range: 100 to 399
Direction: E-W
Address range: 100 to 399
Lottie St
Length: 0.31 miles
Direction: E-W
Address range: 200 to 399
Direction: E-W
Address range: 200 to 399
Flora St
Length: 0.30 miles
Direction: E-W
Address range: 100 to 399
Direction: E-W
Address range: 100 to 399
W Champion St
Length: 0.30 miles
Direction: E-W
Address range: 100 to 399
Direction: E-W
Address range: 100 to 399
N Commercial St
Length: 0.28 miles
Directions: N-S, SW-NE
Address range: 100 to 499
Directions: N-S, SW-NE
Address range: 100 to 499
Prospect St
Length: 0.21 miles
Direction: N-S
Address range: 100 to 399
Direction: N-S
Address range: 100 to 399
C St
Length: 0.19 miles
Direction: SW-NE
Address range: 1700 to 1999
Direction: SW-NE
Address range: 1700 to 1999
Girard St
Length: 0.18 miles
Directions: N-S, SE-NW
Address range: 400 to 699
Directions: N-S, SE-NW
Address range: 400 to 699
Unity St
Length: 0.15 miles
Directions: E-W, N-S, SE-NW
Address range: 100 to 415
Directions: E-W, N-S, SE-NW
Address range: 100 to 415
Dupont St
Length: 0.11 miles
Directions: N-S, SE-NW
Address range: 400 to 699
Directions: N-S, SE-NW
Address range: 400 to 699
Young St
Length: 0.05 miles
Directions: E-W, SW-NE
Address range: 2000 to 2023
Directions: E-W, SW-NE
Address range: 2000 to 2023
Other features:
Whatcom Crk
Length: 0.42 miles
Directions: E-W, N-S, SE-NW, SW-NE
Directions: E-W, N-S, SE-NW, SW-NE