Chestnut Hill Historic District neighborhood in Chestnut Hill, Massachusetts (MA), 02467 detailed profile
Settings
X


Area: 0.163 square miles
Population: 576
Population density: 3,545 people per square mile

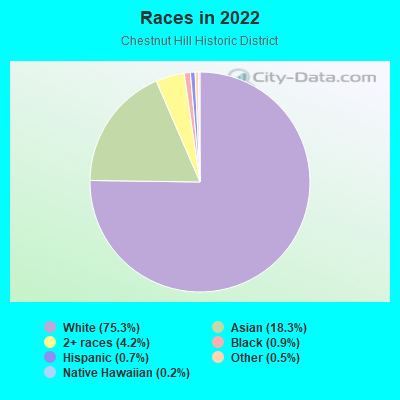
- 43575.3%White
- 10618.3%Asian
- 244.2%Two or more races
- 50.9%Black
- 40.7%Hispanic or Latino
- 30.5%Some other race
- 10.2%Native Hawaiian and Other
Pacific Islander
Median household income in 2022:
| Chestnut Hill Historic District: | $250,001 |
| Massachusetts: | $94,488 |
Distribution of median household income
![Distribution of median household income]()
- 7Less than $10,000
- 3$10,000 to $19,999
- 8$20,000 to $29,999
- 5$30,000 to $39,999
- 5$40,000 to $49,999
- 6$50,000 to $59,999
- 7$60,000 to $74,999
- 4$75,000 to $99,999
- 26$100,000 to $124,999
- 14$125,000 to $149,999
- 19$150,000 to $199,999
- 96$200,000 or more

Distribution of owner-occupied house/condo value
![Distribution of owner-occupied house/condo value]()
- 4$400,000 to $499,999
- 3$500,000 to $749,999
- 1$750,000 to $999,999
- 142$1,000,000 or more

Distribution of rent paid by renters
![Distribution of rent paid by renters]()
- 2Less than $100
- 5$100 to $199
- 2$200 to $299
- 5$500 to $599
- 34$700 to $799
- 4$900 to $999
- 8$1,000 to $1,249
- 4$1,250 to $1,499
- 7$1,500 to $1,999
- 40$2,000 or more

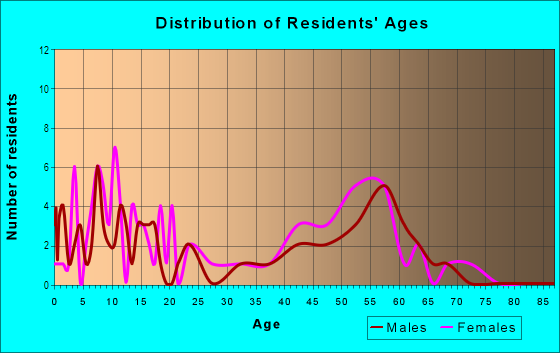
| Males: | 320 |
| Females: | 256 |
| Males: | 36.3 years |
| Females: | 41.5 years |
Average household size:
| Chestnut Hill Historic District: | 3.3 people |
| Massachusetts: | 2.4 people |
Percentage of family households:
| Chestnut Hill Historic District: | 71.4% |
| Massachusetts: | 43.1% |
| Here: | 87.8% |
| Massachusetts: | 45.2% |
Percentage of married-couple families with children (among all households):
| Chestnut Hill Historic District: | 27.3% |
| Massachusetts: | 56.2% |
Percentage of single-mother households (among all households):
| Chestnut Hill Historic District: | 1.8% |
| Massachusetts: | 8.7% |
Percentage of never married males 15 years old and over:
Percentage of never married females 15 years old and over:
| Chestnut Hill Historic District: | 17.6% |
| Massachusetts: | 19.4% |
Percentage of never married females 15 years old and over:
| Chestnut Hill Historic District: | 9.6% |
| Massachusetts: | 18.4% |
Percentage of people that speak English not well or not at all:
| Chestnut Hill Historic District: | 0.0% |
| Massachusetts: | 5.2% |
Percentage of people born in this state:
Percentage of people born in another U.S. state:
Percentage of native residents but born outside the U.S.:
Percentage of foreign born residents:
| Here: | 40.6% |
| Massachusetts: | 58.6% |
Percentage of people born in another U.S. state:
| Chestnut Hill Historic District: | 34.0% |
| Massachusetts: | 20.5% |
Percentage of native residents but born outside the U.S.:
| Here: | 4.1% |
| Massachusetts: | 2.8% |
Percentage of foreign born residents:
| Here: | 21.4% |
| Massachusetts: | 18.0% |
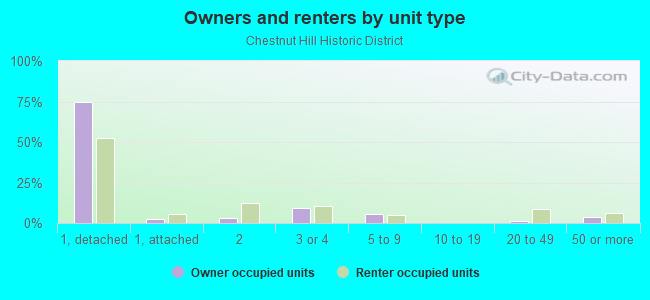
Owner-occupied
Renter-occupied

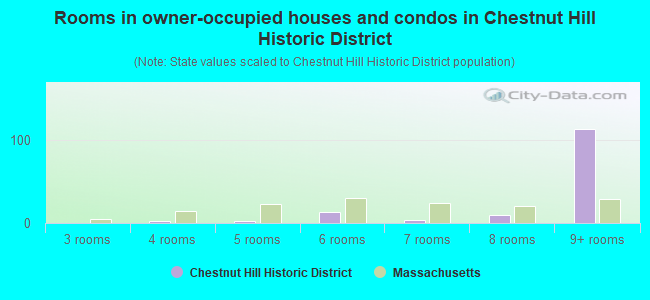
- Rooms in owner-occupied houses and condos in Chestnut Hill Historic District
- 01 room
- 12 rooms
- 03 rooms
- 34 rooms
- 25 rooms
- 136 rooms
- 47 rooms
- 108 rooms
- 1139+ rooms
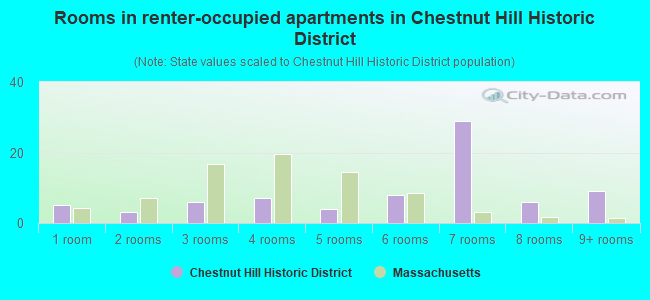
- Rooms in renter-occupied apartments in Chestnut Hill Historic District
- 51 room
- 32 rooms
- 63 rooms
- 74 rooms
- 45 rooms
- 86 rooms
- 297 rooms
- 68 rooms
- 99+ rooms
Owner-occupied
Renter-occupied
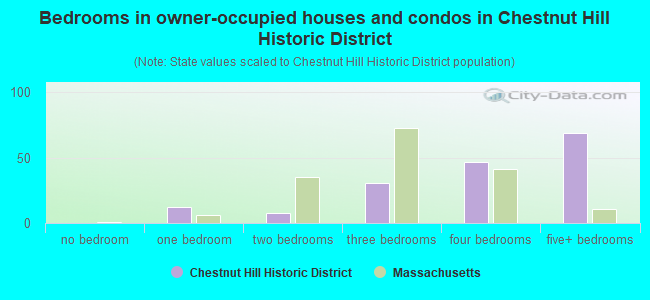
- Bedrooms in owner-occupied houses and condos in Chestnut Hill Historic District
- 0no bedroom
- 121 bedroom
- 82 bedrooms
- 313 bedrooms
- 474 bedrooms
- 695+ bedrooms
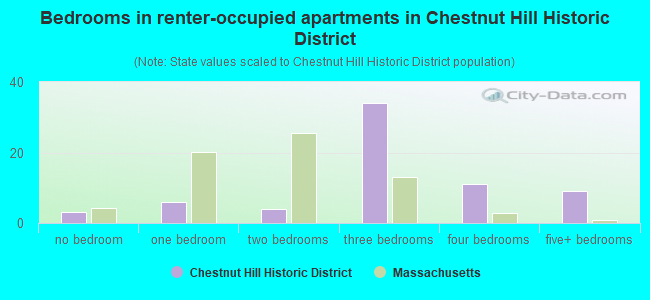
- Bedrooms in renter-occupied apartments in Chestnut Hill Historic District
- 3no bedroom
- 61 bedroom
- 42 bedrooms
- 343 bedrooms
- 114 bedrooms
- 95+ bedrooms
Average number of cars or other vehicles available in houses/condos:
Average number of cars or other vehicles available in apartments:
| This neighborhood: | 1.6 |
| Massachusetts: | 2.0 |
Average number of cars or other vehicles available in apartments:
| Here: | 11.9 |
| Massachusetts: | 1.1 |
Percentage of units with a mortgage:
| Chestnut Hill Historic District: | 54.6% |
| Massachusetts: | 65.5% |
Average estimated value of detached houses in 2022 (90.4% of all units):
| Chestnut Hill Historic District: | $3,141,218 |
| Massachusetts: | $651,570 |
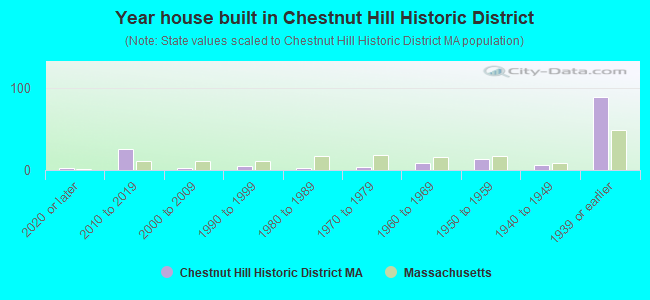
- Year house built in Chestnut Hill Historic District
- 32020 or later
- 262010 to 2019
- 32000 to 2009
- 51990 to 1999
- 31980 to 1989
- 41970 to 1979
- 81960 to 1969
- 141950 to 1959
- 61940 to 1949
- 891939 or earlier
Travel time to work (commute)
![Travel time to work (commute)]()
- 3Less than 5 minutes
- 55 to 9 minutes
- 1410 to 14 minutes
- 2415 to 19 minutes
- 3020 to 24 minutes
- 625 to 29 minutes
- 4530 to 34 minutes
- 535 to 39 minutes
- 1140 to 44 minutes
- 1945 to 59 minutes
- 560 to 89 minutes
- 190 or more minutes

Means of transportation to work
![Means of transportation to work]()
- 46.2%118Drove a car alone
- 4.7%12Carpooled
- 5.1%13Bus
- 6.3%16Subway or elevated rail
- 0.4%1Light rail, streetcar or trolley
- 2.0%5Taxi
- 7.8%20Bicycle
- 3.1%8Walked
- 3.9%10Other means
- 21.5%55Worked at home

Time leaving home to go to work
![Time leaving home to go to work]()
- 812:00 a.m. to 4:59 a.m.
- 25:00 a.m. to 5:29 a.m.
- 45:30 a.m. to 5:59 a.m.
- 36:00 a.m. to 6:29 a.m.
- 116:30 a.m. to 6:59 a.m.
- 347:00 a.m. to 7:29 a.m.
- 277:30 a.m. to 7:59 a.m.
- 328:00 a.m. to 8:29 a.m.
- 138:30 a.m. to 8:59 a.m.
- 189:00 a.m. to 9:59 a.m.
- 810:00 a.m. to 10:59 a.m.
- 111:00 a.m. to 11:59 a.m.
- 512:00 p.m. to 3:59 p.m.
- 14:00 p.m. to 11:59 p.m.

Occupations of males:
- Percentage of males in management occupations (except farmers):
Here: 22.4% Massachusetts: 14.0%
- Percentage of males in business and financial operations occupations:
Here: 9.5% Massachusetts: 6.5%
- Percentage of males in computer and mathematical occupations:
Here: 23.8% Massachusetts: 6.9%
- Percentage of males in life, physical, and social science occupations:
Here: 1.8% Massachusetts: 2.4%
- Percentage of males in legal occupations:
Here: 8.9% Massachusetts: 1.5%
- Percentage of males in education, training, and library occupations:
Here: 6.9% Massachusetts: 4.3%
- Percentage of males in healthcare practitioners and technical occupations:
Here: 4.9% Massachusetts: 3.2%
- Percentage of males in service occupations:
Here: 2.8% Massachusetts: 13.5%
- Percentage of males in sales and office occupations:
Here: 10.2% Massachusetts: 14.0%
- Percentage of males in construction, extraction, and maintenance occupations:
Here: 1.3% Massachusetts: 8.2%
- Percentage of males in production occupations:
Here: 3.4% Massachusetts: 5.1%
- Percentage of males in transportation occupations:
Here: 4.0% Massachusetts: 4.9%
Occupations of females:
- Percentage of females in management occupations (except farmers):
Here: 10.4% Massachusetts: 11.3%
- Percentage of females in business and financial operations occupations:
Here: 11.4% Massachusetts: 7.6%
- Percentage of females in computer and mathematical occupations:
Here: 5.5% Massachusetts: 2.6%
- Percentage of females in legal occupations:
Here: 12.4% Massachusetts: 1.5%
- Percentage of females in education, training, and library occupations:
Here: 8.2% Massachusetts: 10.9%
- Percentage of females in healthcare practitioners and technical occupations:
Here: 22.4% Massachusetts: 10.8%
- Percentage of females in service occupations:
Here: 5.2% Massachusetts: 18.3%
- Percentage of females in sales and office occupations:
Here: 9.6% Massachusetts: 22.6%
- Percentage of females in production occupations:
Here: 8.9% Massachusetts: 2.5%
- Percentage of females in material moving occupations:
Here: 5.5% Massachusetts: 1.3%
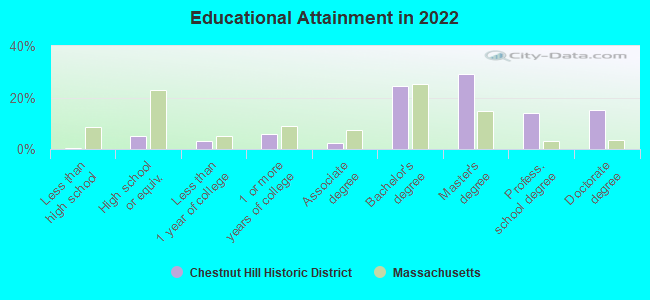
Education in this neighborhood (subdivision or community):
- Percentage of people 3 years and older in K-12 schools:
Chestnut Hill Historic District: 30.6% Massachusetts: 14.7%
- Percentage of people 3 years and older in undergraduate colleges:
Chestnut Hill Historic District: 4.3% Massachusetts: 5.9%
- Percentage of people 3 years and older in grad. or professional schools:
Chestnut Hill Historic District: 2.4% Massachusetts: 2.2%
- Percentage of students K-12 enrolled in private schools:
Chestnut Hill Historic District: 30.7% Massachusetts: 11.0%
Percentage of population below poverty level:
| Chestnut Hill Historic District: | 3.8% |
| Massachusetts: | 10.4% |
Median year owner moved in (as recorded in 2022):
| Chestnut Hill Historic District: | 2010 |
| Massachusetts: | 2009 |
Percentage of married-couple families with both working:
| Chestnut Hill Historic District: | 59.4% |
| Massachusetts: | 78.0% |
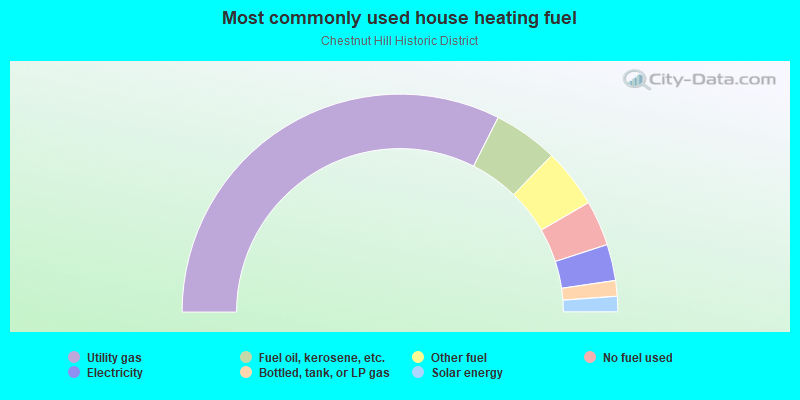
- 64.9%Utility gas
- 9.6%Fuel oil, kerosene, etc.
- 8.8%Other fuel
- 6.7%No fuel used
- 5.4%Electricity
- 2.3%Bottled, tank, or LP gas
- 2.3%Solar energy
Highways in this neighborhood:
State Hwy 9 (Boylston St)
Length: 1.54 miles
Directions: E-W, SW-NE
Directions: E-W, SW-NE
Roads and streets:
Fairway Rd
Length: 0.65 miles
Directions: E-W, SE-NW, SW-NE
Address range: 1 to 199
Directions: E-W, SE-NW, SW-NE
Address range: 1 to 199
Crafts Rd
Length: 0.46 miles
Directions: E-W, SW-NE
Address range: 1 to 164
Directions: E-W, SW-NE
Address range: 1 to 164
Spooner Rd
Length: 0.31 miles
Directions: N-S, SW-NE
Address range: 1 to 199
Directions: N-S, SW-NE
Address range: 1 to 199
Hilltop Rd
Length: 0.26 miles
Directions: E-W, N-S, SE-NW, SW-NE
Address range: 1 to 99
Directions: E-W, N-S, SE-NW, SW-NE
Address range: 1 to 99
Denny Rd
Length: 0.23 miles
Directions: E-W, SW-NE
Address range: 1 to 155
Directions: E-W, SW-NE
Address range: 1 to 155
Valley Rd
Length: 0.19 miles
Directions: N-S, SE-NW
Address range: 1 to 98
Directions: N-S, SE-NW
Address range: 1 to 98
Dunster Rd
Length: 0.16 miles
Direction: SE-NW
Address range: 23 to 59
Direction: SE-NW
Address range: 23 to 59
Devon Rd
Length: 0.16 miles
Directions: E-W, SE-NW
Address range: 11 to 99
Directions: E-W, SE-NW
Address range: 11 to 99
Norfolk Rd
Length: 0.15 miles
Direction: SE-NW
Address range: 16 to 99
Direction: SE-NW
Address range: 16 to 99
Circuit Rd
Length: 0.11 miles
Directions: SE-NW, SW-NE
Address range: 37 to 98
Directions: SE-NW, SW-NE
Address range: 37 to 98
Reservoir Rd
Length: 0.06 miles
Directions: E-W, SE-NW
Address range: 246 to 283
Directions: E-W, SE-NW
Address range: 246 to 283
Portledge Rd
Length: 0.05 miles
Direction: SE-NW
Address range: 29 to 99
Direction: SE-NW
Address range: 29 to 99
Alwyngton Rd
Length: 0.05 miles
Direction: SW-NE
Address range: 1 to 99
Direction: SW-NE
Address range: 1 to 99
Portlege Rd
Length: 0.03 miles
Direction: SE-NW
Address range: 46 to 50
Direction: SE-NW
Address range: 46 to 50