Centennial Center neighborhood in Las Vegas, Nevada (NV), 89130, 89149 detailed profile
Settings
X

Business Search - 14 Million verified businesses
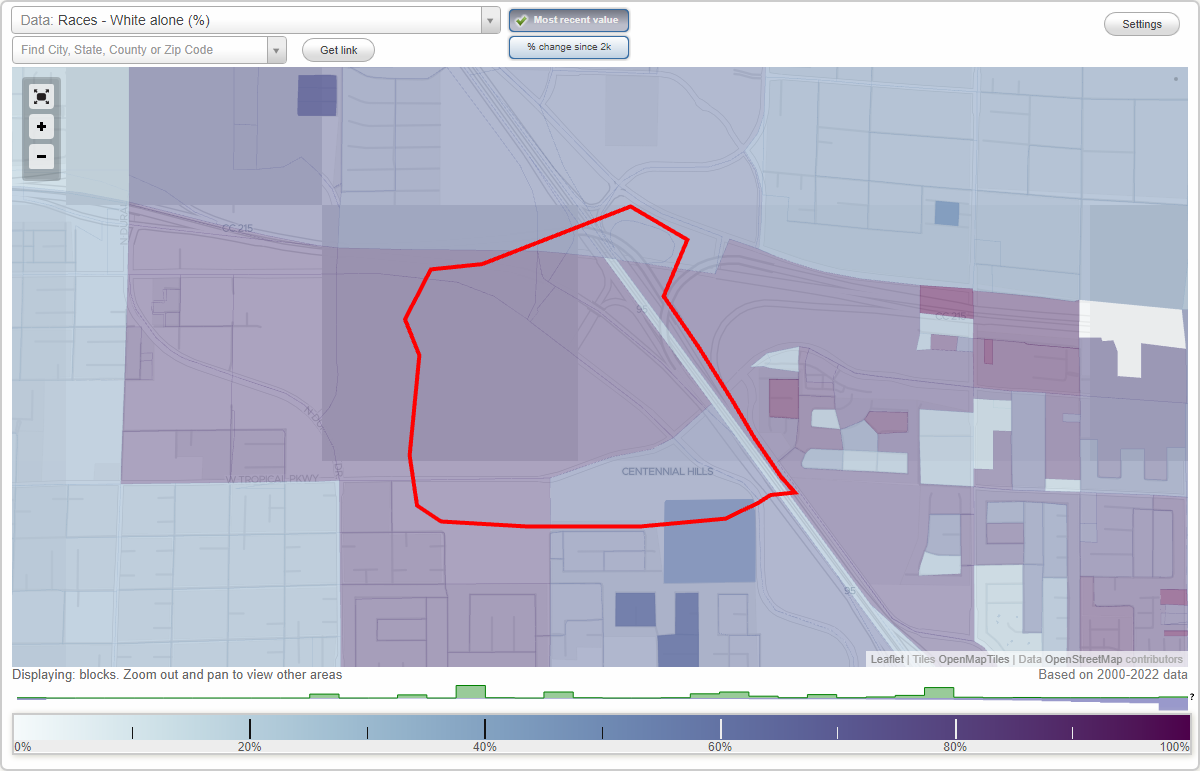
Area: 0.493 square miles
Population: 2,387
Population density:
| Centennial Center: | 4,840 people per square mile |
| Las Vegas: | 5,792 people per square mile |

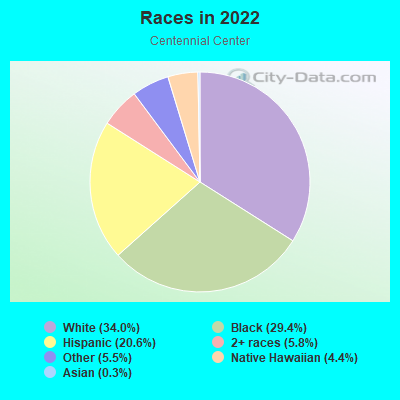
- 81134.0%White
- 70029.4%Black
- 49220.6%Hispanic or Latino
- 1385.8%Two or more races
- 1305.5%Some other race
- 1044.4%Native Hawaiian and Other
Pacific Islander - 80.3%Asian
Median household income in 2022:
| Centennial Center: | $54,362 |
| Las Vegas: | $68,905 |
Distribution of median household income
![Distribution of median household income]()
- 84Less than $10,000
- 58$10,000 to $19,999
- 132$20,000 to $29,999
- 40$30,000 to $39,999
- 92$40,000 to $49,999
- 99$50,000 to $59,999
- 85$60,000 to $74,999
- 103$75,000 to $99,999
- 87$100,000 to $124,999
- 30$125,000 to $149,999
- 55$150,000 to $199,999
- 16$200,000 or more

Distribution of owner-occupied house/condo value
![Distribution of owner-occupied house/condo value]()
- 41Less than $50,000
- 7$150,000 to $199,999
- 35$200,000 to $249,999
- 89$250,000 to $299,999
- 81$300,000 to $399,999
- 110$400,000 to $499,999
- 29$500,000 to $749,999
- 18$750,000 to $999,999

Distribution of rent paid by renters
![Distribution of rent paid by renters]()
- 12$100 to $199
- 5$500 to $599
- 38$900 to $999
- 252$1,000 to $1,249
- 153$1,250 to $1,499
- 157$1,500 to $1,999
- 18$2,000 or more

Median rent in 2022:
| Centennial Center: | $1,272 |
| Las Vegas: | $1,277 |
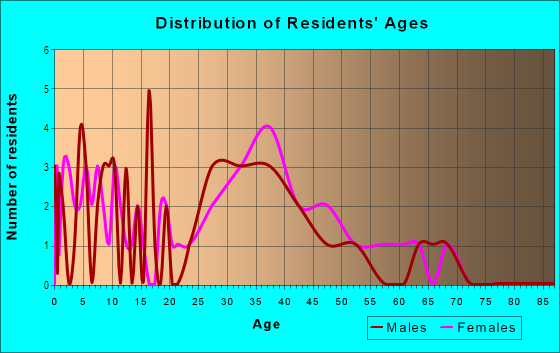
| Males: | 1,262 |
| Females: | 1,125 |
Males:
| This neighborhood: | 26.6 years |
| Whole city: | 38.4 years |
| This neighborhood: | 34.1 years |
| Whole city: | 38.9 years |
Average household size:
| Centennial Center: | 2.7 people |
| Las Vegas: | 2.7 people |
Percentage of family households:
| Centennial Center: | 55.0% |
| Las Vegas: | 45.8% |
| Here: | 33.8% |
| Las Vegas: | 40.9% |
Percentage of married-couple families with children (among all households):
| Centennial Center: | 13.4% |
| Las Vegas: | 23.4% |
Percentage of single-mother households (among all households):
| Centennial Center: | 19.0% |
| Las Vegas: | 10.1% |
Percentage of never married males 15 years old and over:
Percentage of never married females 15 years old and over:
| Centennial Center: | 25.1% |
| Las Vegas: | 19.7% |
Percentage of never married females 15 years old and over:
| Centennial Center: | 20.0% |
| city: | 17.0% |
Percentage of people that speak English not well or not at all:
| Centennial Center: | 2.5% |
| Las Vegas: | 7.0% |
Percentage of people born in this state:
Percentage of people born in another U.S. state:
Percentage of native residents but born outside the U.S.:
Percentage of foreign born residents:
| Here: | 28.5% |
| Las Vegas: | 27.3% |
Percentage of people born in another U.S. state:
| Centennial Center: | 55.0% |
| Las Vegas: | 49.8% |
Percentage of native residents but born outside the U.S.:
| Here: | 3.0% |
| city: | 1.9% |
Percentage of foreign born residents:
| Here: | 13.6% |
| Las Vegas: | 21.0% |
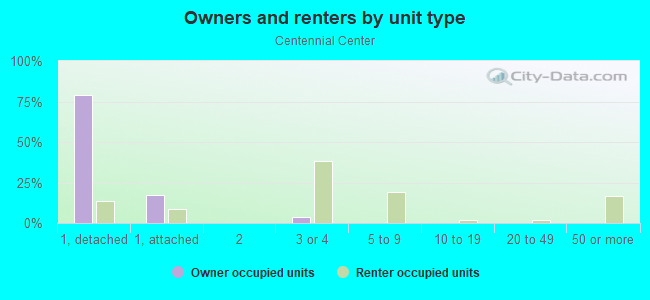
Owner-occupied
Renter-occupied

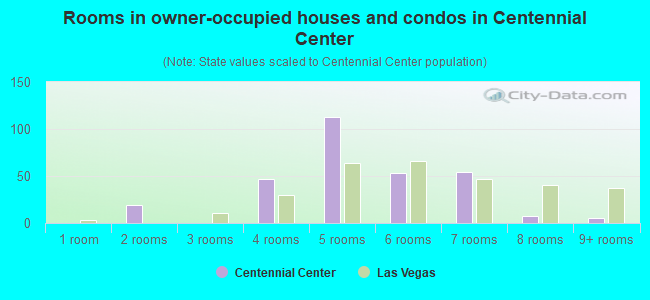
- Rooms in owner-occupied houses and condos in Centennial Center
- 01 room
- 192 rooms
- 03 rooms
- 474 rooms
- 1135 rooms
- 536 rooms
- 547 rooms
- 78 rooms
- 59+ rooms
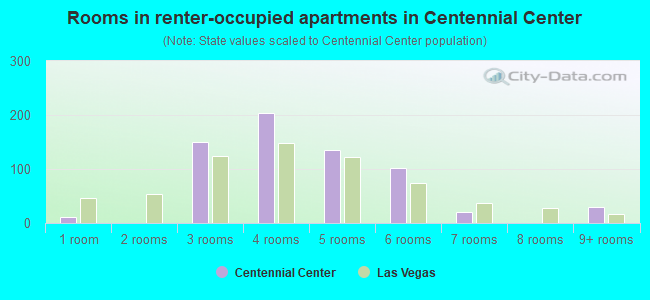
- Rooms in renter-occupied apartments in Centennial Center
- 111 room
- 02 rooms
- 1503 rooms
- 2044 rooms
- 1365 rooms
- 1026 rooms
- 207 rooms
- 08 rooms
- 299+ rooms
Owner-occupied
Renter-occupied
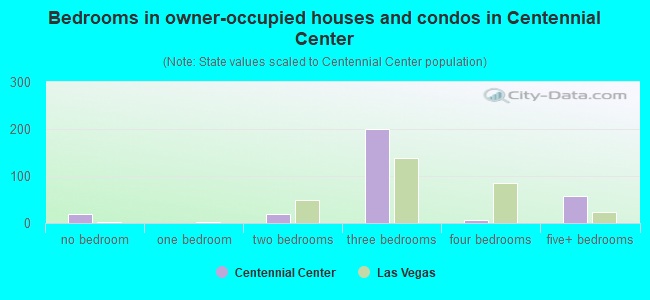
- Bedrooms in owner-occupied houses and condos in Centennial Center
- 19no bedroom
- 01 bedroom
- 192 bedrooms
- 2013 bedrooms
- 64 bedrooms
- 575+ bedrooms
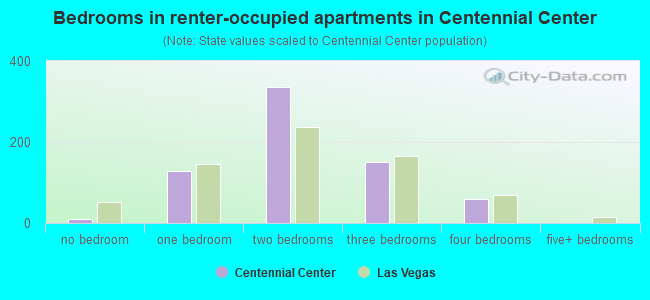
- Bedrooms in renter-occupied apartments in Centennial Center
- 11no bedroom
- 1281 bedroom
- 3362 bedrooms
- 1513 bedrooms
- 604 bedrooms
- 05+ bedrooms
Average number of cars or other vehicles available in houses/condos:
Average number of cars or other vehicles available in apartments:
| This neighborhood: | 2.4 |
| Las Vegas: | 2.0 |
Average number of cars or other vehicles available in apartments:
| Here: | 1.2 |
| city: | 1.3 |
Percentage of units with a mortgage:
| Centennial Center: | 66.9% |
| Las Vegas: | 69.3% |
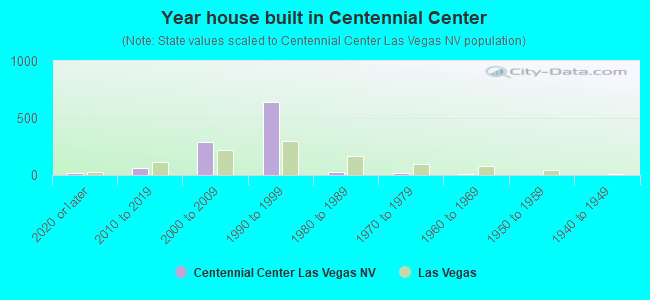
- Year house built in Centennial Center
- 152020 or later
- 582010 to 2019
- 2892000 to 2009
- 6431990 to 1999
- 271980 to 1989
- 161970 to 1979
- 111960 to 1969
- 01950 to 1959
- 01940 to 1949
- 01939 or earlier
City-data.com crime index for city in 2020 (higher means more crime):
| City: | 280.7 |
| U.S. average: | 219.5 |
Travel time to work (commute)
![Travel time to work (commute)]()
- 22Less than 5 minutes
- 415 to 9 minutes
- 15010 to 14 minutes
- 17815 to 19 minutes
- 22720 to 24 minutes
- 15925 to 29 minutes
- 30930 to 34 minutes
- 3135 to 39 minutes
- 6440 to 44 minutes
- 8145 to 59 minutes
- 2860 to 89 minutes
- 2390 or more minutes

Means of transportation to work
![Means of transportation to work]()
- 78.6%953Drove a car alone
- 13.6%165Carpooled
- 2.7%33Bicycle
- 0.3%4Walked
- 1.2%14Other means
- 6.4%77Worked at home

Time leaving home to go to work
![Time leaving home to go to work]()
- 12412:00 a.m. to 4:59 a.m.
- 585:00 a.m. to 5:29 a.m.
- 335:30 a.m. to 5:59 a.m.
- 1166:00 a.m. to 6:29 a.m.
- 826:30 a.m. to 6:59 a.m.
- 2327:00 a.m. to 7:29 a.m.
- 1257:30 a.m. to 7:59 a.m.
- 938:00 a.m. to 8:29 a.m.
- 378:30 a.m. to 8:59 a.m.
- 1579:00 a.m. to 9:59 a.m.
- 3310:00 a.m. to 10:59 a.m.
- 1711:00 a.m. to 11:59 a.m.
- 13112:00 p.m. to 3:59 p.m.
- 544:00 p.m. to 11:59 p.m.

Occupations of males:
- Percentage of males in management occupations (except farmers):
Here: 1.4% city: 9.6%
- Percentage of males in business and financial operations occupations:
Here: 1.6% city: 3.6%
- Percentage of males in architecture and engineering occupations:
Here: 2.8% city: 1.8%
- Percentage of males in education, training, and library occupations:
Here: 3.6% city: 2.5%
- Percentage of males in arts, design, entertainment, sports, and media occupations:
Here: 9.7% city: 2.5%
- Percentage of males in healthcare practitioners and technical occupations:
Here: 1.9% city: 3.3%
- Percentage of males in service occupations:
Here: 17.0% city: 23.3%
- Percentage of males in sales and office occupations:
Here: 8.8% city: 16.6%
- Percentage of males in construction, extraction, and maintenance occupations:
Here: 23.4% city: 10.6%
- Percentage of males in production occupations:
Here: 1.2% city: 3.3%
- Percentage of males in transportation occupations:
Here: 15.3% city: 6.6%
- Percentage of males in material moving occupations:
Here: 12.7% city: 5.4%
Occupations of females:
- Percentage of females in management occupations (except farmers):
Here: 3.9% city: 8.5%
- Percentage of females in business and financial operations occupations:
Here: 3.1% city: 5.7%
- Percentage of females in computer and mathematical occupations:
Here: 1.2% city: 1.1%
- Percentage of females in community and social services occupations:
Here: 1.3% city: 1.9%
- Percentage of females in legal occupations:
Here: 1.1% city: 1.5%
- Percentage of females in education, training, and library occupations:
Here: 1.6% city: 8.0%
- Percentage of females in arts, design, entertainment, sports, and media occupations:
Here: 2.6% city: 1.8%
- Percentage of females in healthcare practitioners and technical occupations:
Here: 2.1% city: 7.4%
- Percentage of females in service occupations:
Here: 49.2% city: 26.5%
- Percentage of females in sales and office occupations:
Here: 30.8% city: 30.5%
- Percentage of females in production occupations:
Here: 5.6% city: 1.8%
- Percentage of females in material moving occupations:
Here: 2.4% city: 2.2%
Percentage of people 16-64 in Armed Forces:
| Centennial Center: | 3.0% |
| Las Vegas: | 1.0% |
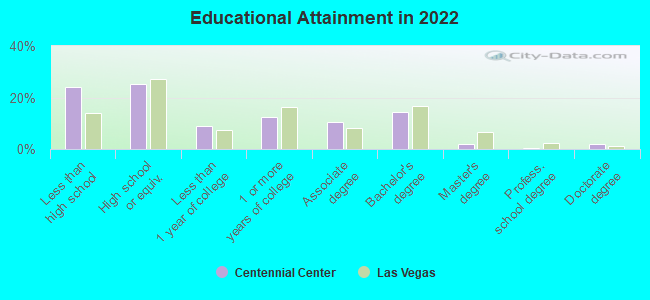
Education in this neighborhood (subdivision or community):
- Percentage of people 3 years and older in K-12 schools:
Centennial Center: 20.4% Las Vegas: 17.4%
- Percentage of people 3 years and older in undergraduate colleges:
Centennial Center: 10.1% Las Vegas: 4.2%
- Percentage of people 3 years and older in grad. or professional schools:
Centennial Center: 0.9% Las Vegas: 1.0%
- Percentage of students K-12 enrolled in private schools:
Centennial Center: 10.5% Las Vegas: 12.9%
Percentage of population below poverty level:
| Centennial Center: | 15.8% |
| Las Vegas: | 14.1% |
Median year owner moved in (as recorded in 2022):
Median year renter moved in (as recorded in 2022):
| Centennial Center: | 2006 |
| Las Vegas: | 2015 |
Median year renter moved in (as recorded in 2022):
| Centennial Center: | 2018 |
| Las Vegas: | 2020 |
Percentage of married-couple families with both working:
| Centennial Center: | 76.9% |
| Las Vegas: | 62.0% |
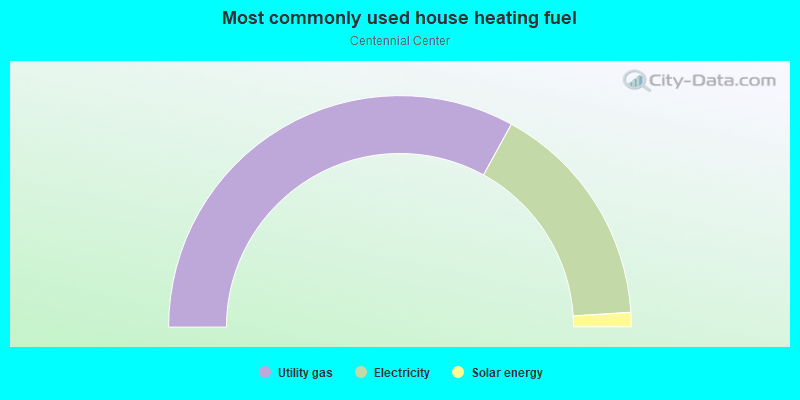
- 66.0%Utility gas
- 32.0%Electricity
- 2.0%Solar energy
Limited-access highways (interstate or state) in this neighborhood:
US Hwy 95
Length: 1.34 miles
Direction: SE-NW
Address range: 6024 to 6094
Direction: SE-NW
Address range: 6024 to 6094
Roads and streets:
Frontage West Rd (050 Blanca Rd, Frontage Rd W)
Length: 0.82 miles
Directions: E-W, N-S, SE-NW
Directions: E-W, N-S, SE-NW
Centennial Center Blvd
Length: 0.77 miles
Directions: E-W, SE-NW
Address range: 5852 to 6519
Directions: E-W, SE-NW
Address range: 5852 to 6519
W Tropical Pkwy
Length: 0.38 miles
Directions: E-W, SW-NE
Address range: 7700 to 7999
Directions: E-W, SW-NE
Address range: 7700 to 7999
W Centennial Pkwy
Length: 0.29 miles
Directions: E-W, SW-NE
Address range: 7900 to 8057
Directions: E-W, SW-NE
Address range: 7900 to 8057
Oso Blanca Rd
Length: 0.17 miles
Directions: N-S, SW-NE
Directions: N-S, SW-NE
Rome Blvd
Length: 0.04 miles
Direction: SE-NW
Address range: 7900 to 7959
Direction: SE-NW
Address range: 7900 to 7959
Frontage West Rd
Length: 0.02 miles
Direction: SE-NW
Direction: SE-NW