Business District neighborhood in Oklahoma City, Oklahoma (OK), 73102 detailed profile
Settings
X

Business Search - 14 Million verified businesses
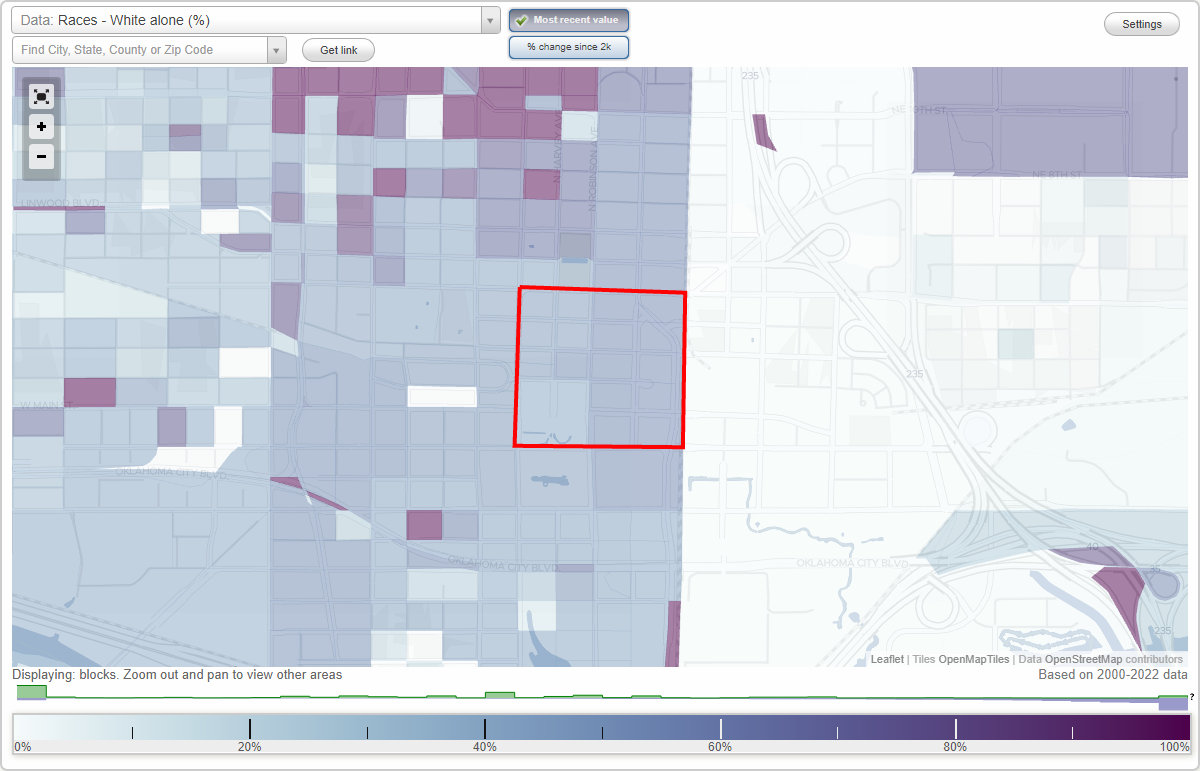
Area: 0.152 square miles
Population: 740
Population density:
| Business District: | 4,855 people per square mile |
| Oklahoma City: | 1,145 people per square mile |

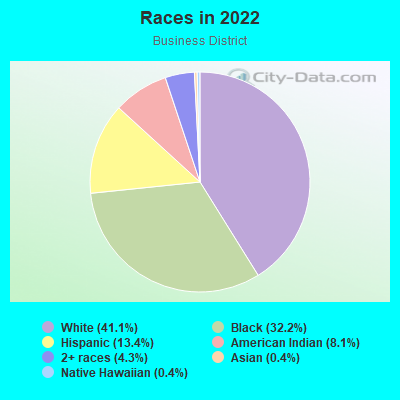
- 30341.1%White
- 23732.2%Black
- 9913.4%Hispanic or Latino
- 608.1%American Indian
- 324.3%Two or more races
- 30.4%Asian
- 30.4%Native Hawaiian and Other
Pacific Islander
Distribution of median household income
![Distribution of median household income]()
- 39Less than $10,000
- 11$10,000 to $19,999
- 18$20,000 to $29,999
- 42$30,000 to $39,999
- 41$40,000 to $49,999
- 28$50,000 to $59,999
- 27$60,000 to $74,999
- 65$75,000 to $99,999
- 12$100,000 to $124,999
- 27$125,000 to $149,999
- 43$150,000 to $199,999
- 25$200,000 or more

Distribution of owner-occupied house/condo value
![Distribution of owner-occupied house/condo value]()
- 6$50,000 to $99,999
- 2$100,000 to $149,999
- 14$150,000 to $199,999
- 3$200,000 to $249,999
- 5$250,000 to $299,999
- 2$500,000 to $749,999
- 6$750,000 to $999,999
- 9$1,000,000 or more

Distribution of rent paid by renters
![Distribution of rent paid by renters]()
- 5$300 to $399
- 9$400 to $499
- 7$500 to $599
- 10$600 to $699
- 19$700 to $799
- 18$800 to $899
- 28$900 to $999
- 74$1,000 to $1,249
- 104$1,250 to $1,499
- 37$1,500 to $1,999
- 20$2,000 or more

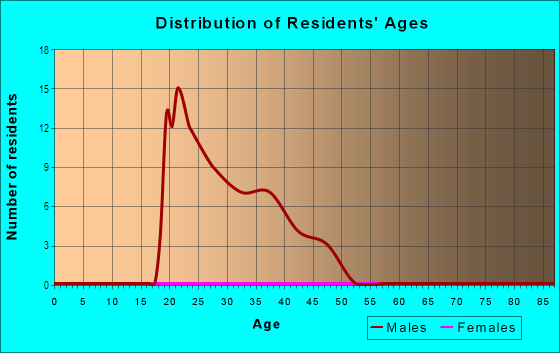
| Males: | 586 |
| Females: | 153 |
Males:
| This neighborhood: | 34.6 years |
| Whole city: | 33.6 years |
| This neighborhood: | 30.6 years |
| Whole city: | 35.8 years |
Percentage of family households:
| Business District: | 20.8% |
| Oklahoma City: | 47.3% |
| Here: | 18.6% |
| Oklahoma City: | 43.0% |
Percentage of married-couple families with children (among all households):
| Business District: | 16.3% |
| Oklahoma City: | 24.7% |
Percentage of single-mother households (among all households):
| Business District: | 10.7% |
| Oklahoma City: | 11.9% |
Percentage of never married males 15 years old and over:
Percentage of never married females 15 years old and over:
| Business District: | 50.7% |
| Oklahoma City: | 17.7% |
Percentage of never married females 15 years old and over:
| Business District: | 13.2% |
| city: | 16.7% |
Percentage of people that speak English not well or not at all:
| Business District: | 0.0% |
| Oklahoma City: | 4.2% |
Percentage of people born in this state:
Percentage of people born in another U.S. state:
Percentage of native residents but born outside the U.S.:
Percentage of foreign born residents:
| Here: | 52.3% |
| Oklahoma City: | 56.0% |
Percentage of people born in another U.S. state:
| Business District: | 37.6% |
| Oklahoma City: | 30.7% |
Percentage of native residents but born outside the U.S.:
| Here: | 1.9% |
| city: | 1.6% |
Percentage of foreign born residents:
| Here: | 8.3% |
| Oklahoma City: | 11.6% |
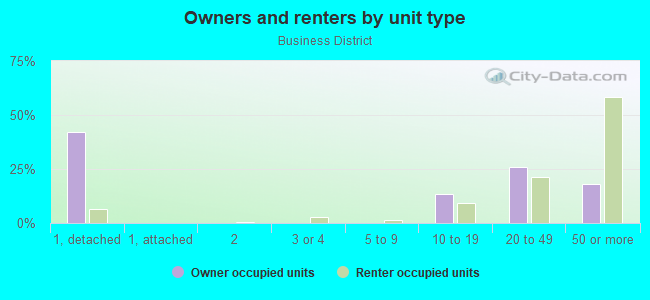
Owner-occupied
Renter-occupied

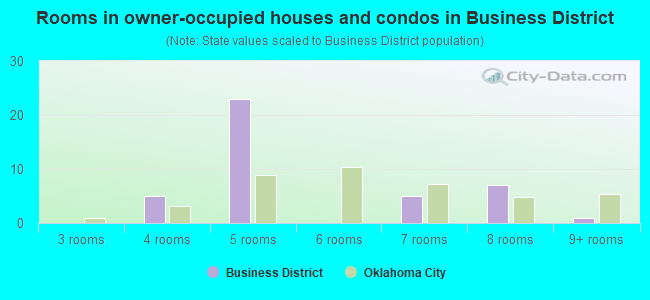
- Rooms in owner-occupied houses and condos in Business District
- 01 room
- 02 rooms
- 03 rooms
- 54 rooms
- 235 rooms
- 06 rooms
- 57 rooms
- 78 rooms
- 19+ rooms
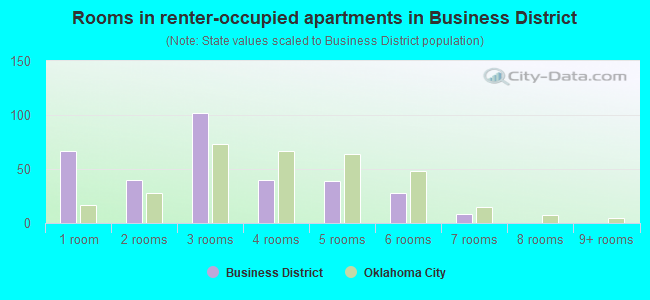
- Rooms in renter-occupied apartments in Business District
- 671 room
- 402 rooms
- 1023 rooms
- 404 rooms
- 395 rooms
- 286 rooms
- 87 rooms
- 08 rooms
- 09+ rooms
Owner-occupied
Renter-occupied
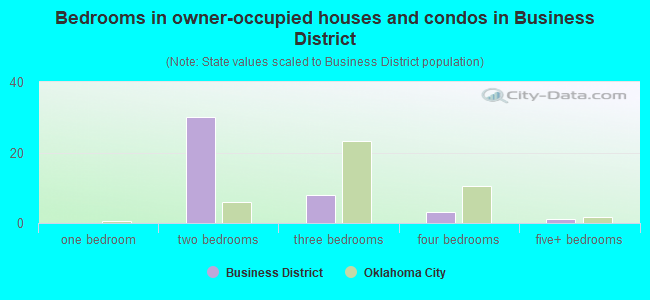
- Bedrooms in owner-occupied houses and condos in Business District
- 0no bedroom
- 01 bedroom
- 302 bedrooms
- 83 bedrooms
- 34 bedrooms
- 15+ bedrooms
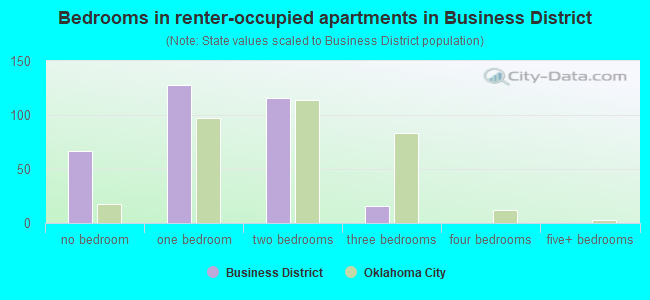
- Bedrooms in renter-occupied apartments in Business District
- 67no bedroom
- 1281 bedroom
- 1162 bedrooms
- 163 bedrooms
- 04 bedrooms
- 05+ bedrooms
Average number of cars or other vehicles available in houses/condos:
Average number of cars or other vehicles available in apartments:
| This neighborhood: | |
| Oklahoma City: |
Average number of cars or other vehicles available in apartments:
| Here: | |
| city: |
Percentage of units with a mortgage:
| Business District: | 32.7% |
| Oklahoma City: | 60.2% |
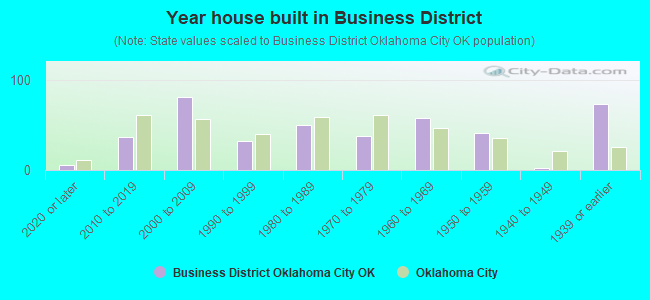
- Year house built in Business District
- 62020 or later
- 372010 to 2019
- 812000 to 2009
- 321990 to 1999
- 501980 to 1989
- 381970 to 1979
- 581960 to 1969
- 411950 to 1959
- 21940 to 1949
- 741939 or earlier
City-data.com crime index for city in 2020 (higher means more crime):
| City: | 430.2 |
| U.S. average: | 219.5 |
Travel time to work (commute)
![Travel time to work (commute)]()
- 29Less than 5 minutes
- 695 to 9 minutes
- 8010 to 14 minutes
- 13915 to 19 minutes
- 4820 to 24 minutes
- 930 to 34 minutes
- 145 to 59 minutes
- 890 or more minutes

Means of transportation to work
![Means of transportation to work]()
- 54.8%226Drove a car alone
- 4.1%17Carpooled
- 0.7%3Bus
- 32.0%132Walked
- 1.2%5Other means
- 6.1%25Worked at home

Time leaving home to go to work
![Time leaving home to go to work]()
- 3612:00 a.m. to 4:59 a.m.
- 85:00 a.m. to 5:29 a.m.
- 55:30 a.m. to 5:59 a.m.
- 166:00 a.m. to 6:29 a.m.
- 356:30 a.m. to 6:59 a.m.
- 537:00 a.m. to 7:29 a.m.
- 617:30 a.m. to 7:59 a.m.
- 418:00 a.m. to 8:29 a.m.
- 178:30 a.m. to 8:59 a.m.
- 289:00 a.m. to 9:59 a.m.
- 211:00 a.m. to 11:59 a.m.
- 2312:00 p.m. to 3:59 p.m.
- 564:00 p.m. to 11:59 p.m.

Occupations of males:
- Percentage of males in management occupations (except farmers):
Here: 9.0% city: 10.4%
- Percentage of males in business and financial operations occupations:
Here: 10.1% city: 4.8%
- Percentage of males in computer and mathematical occupations:
Here: 2.6% city: 4.9%
- Percentage of males in architecture and engineering occupations:
Here: 12.5% city: 3.6%
- Percentage of males in life, physical, and social science occupations:
Here: 3.4% city: 1.0%
- Percentage of males in legal occupations:
Here: 1.7% city: 1.5%
- Percentage of males in education, training, and library occupations:
Here: 4.5% city: 2.7%
- Percentage of males in arts, design, entertainment, sports, and media occupations:
Here: 3.4% city: 2.1%
- Percentage of males in healthcare practitioners and technical occupations:
Here: 4.7% city: 3.9%
- Percentage of males in service occupations:
Here: 25.4% city: 13.2%
- Percentage of males in sales and office occupations:
Here: 7.9% city: 15.7%
- Percentage of males in production occupations:
Here: 4.8% city: 6.3%
- Percentage of males in transportation occupations:
Here: 3.0% city: 5.4%
- Percentage of males in material moving occupations:
Here: 2.2% city: 5.6%
Occupations of females:
- Percentage of females in management occupations (except farmers):
Here: 5.1% city: 8.7%
- Percentage of females in business and financial operations occupations:
Here: 4.5% city: 7.6%
- Percentage of females in architecture and engineering occupations:
Here: 11.3% city: 0.8%
- Percentage of females in life, physical, and social science occupations:
Here: 8.2% city: 0.9%
- Percentage of females in community and social services occupations:
Here: 1.4% city: 2.0%
- Percentage of females in arts, design, entertainment, sports, and media occupations:
Here: 4.5% city: 1.6%
- Percentage of females in healthcare practitioners and technical occupations:
Here: 20.1% city: 10.3%
- Percentage of females in service occupations:
Here: 39.7% city: 21.4%
- Percentage of females in sales and office occupations:
Here: 5.1% city: 27.6%
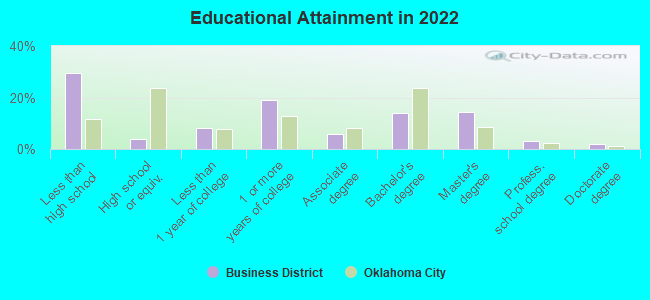
Education in this neighborhood (subdivision or community):
- Percentage of people 3 years and older in K-12 schools:
Business District: 3.5% Oklahoma City: 18.8%
- Percentage of people 3 years and older in undergraduate colleges:
Business District: 4.5% Oklahoma City: 5.0%
- Percentage of people 3 years and older in grad. or professional schools:
Business District: 1.1% Oklahoma City: 1.4%
- Percentage of students K-12 enrolled in private schools:
Business District: 26.9% Oklahoma City: 14.4%
Percentage of population below poverty level:
| Business District: | 17.4% |
| Oklahoma City: | 15.5% |
Percentage of married-couple families with both working:
| Business District: | 100.0% |
| Oklahoma City: | 64.6% |
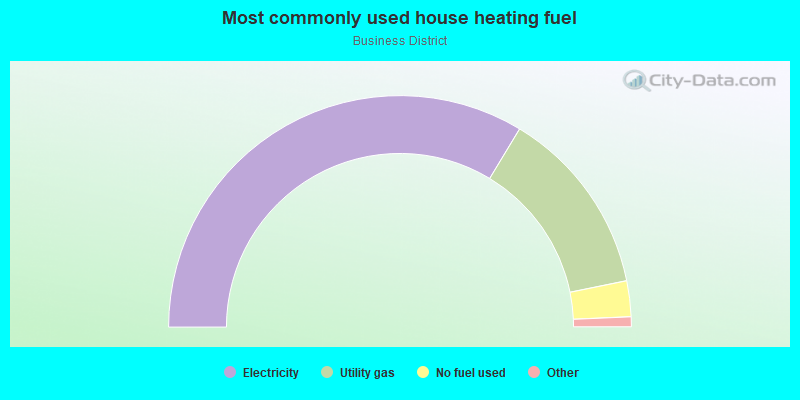
- 67.3%Electricity
- 26.3%Utility gas
- 5.0%No fuel used
- 0.7%Bottled, tank, or LP gas
- 0.7%Fuel oil, kerosene, etc.
Roads and streets:
N Santa Fe Ave (N E K Gaylord Blvd)
Length: 0.40 miles
Directions: N-S, SE-NW
Address range: 1 to 499
Directions: N-S, SE-NW
Address range: 1 to 499
W Sheridan Ave
Length: 0.39 miles
Direction: E-W
Address range: 1 to 299
Direction: E-W
Address range: 1 to 299
Robert S Kerr Ave
Length: 0.39 miles
Direction: E-W
Address range: 1 to 299
Direction: E-W
Address range: 1 to 299
NW 4th St
Length: 0.38 miles
Direction: E-W
Address range: 1 to 299
Direction: E-W
Address range: 1 to 299
N Broadway Ave
Length: 0.37 miles
Directions: N-S, SE-NW
Address range: 1 to 499
Directions: N-S, SE-NW
Address range: 1 to 499
N Robinson Ave
Length: 0.37 miles
Direction: N-S
Address range: 1 to 499
Direction: N-S
Address range: 1 to 499
W Main St
Length: 0.28 miles
Direction: E-W
Address range: 1 to 199
Direction: E-W
Address range: 1 to 199
Dean A McGee Ave
Length: 0.24 miles
Direction: E-W
Address range: 1 to 299
Direction: E-W
Address range: 1 to 299
Park Ave
Length: 0.24 miles
Direction: E-W
Address range: 100 to 299
Direction: E-W
Address range: 100 to 299
N Harvey Ave
Length: 0.22 miles
Direction: N-S
Address range: 200 to 499
Direction: N-S
Address range: 200 to 499
NW 3rd St
Length: 0.14 miles
Direction: E-W
Address range: 1 to 99
Direction: E-W
Address range: 1 to 99
Couch Dr
Length: 0.09 miles
Directions: E-W, SE-NW, SW-NE
Directions: E-W, SE-NW, SW-NE
N Park Ave
Length: 0.05 miles
Direction: E-W
Address range: 1 to 99
Direction: E-W
Address range: 1 to 99
Railroad features:
Union Pacific RR (Burlington Northern Santa Fe Rlwy)
Length: 0.23 miles
Direction: N-S
Direction: N-S