Brookgreen Village neighborhood in Tampa, Florida (FL), 33624 detailed profile
Settings
X


Business Search - 14 Million verified businesses
Area: 0.042 square miles
Population: 222
Population density:
| Brookgreen Village: | 5,306 people per square mile |
| Tampa: | 3,553 people per square mile |

- 12052.6%Hispanic or Latino
- 7633.3%White
- 156.6%Two or more races
- 93.9%Black
- 41.8%American Indian
- 41.8%Asian

Median household income in 2022:
| Brookgreen Village: | $61,335 |
| Tampa: | $71,089 |
Distribution of median household income
![Distribution of median household income]()
- 6Less than $10,000
- 14$10,000 to $19,999
- 8$20,000 to $29,999
- 13$30,000 to $39,999
- 4$40,000 to $49,999
- 5$50,000 to $59,999
- 9$60,000 to $74,999
- 18$75,000 to $99,999
- 15$100,000 to $124,999
- 8$125,000 to $149,999
- 6$150,000 to $199,999
- 9$200,000 or more

Distribution of owner-occupied house/condo value
![Distribution of owner-occupied house/condo value]()
- 4Less than $50,000
- 3$50,000 to $99,999
- 5$100,000 to $149,999
- 12$150,000 to $199,999
- 29$200,000 to $249,999
- 9$250,000 to $299,999
- 19$300,000 to $399,999
- 2$400,000 to $499,999
- 1$500,000 to $749,999
- 2$750,000 to $999,999

Distribution of rent paid by renters
![Distribution of rent paid by renters]()
- 2$600 to $699
- 2$700 to $799
- 8$900 to $999
- 9$1,000 to $1,249
- 14$1,250 to $1,499
- 5$1,500 to $1,999

Median rent in 2022:
| Brookgreen Village: | $1,325 |
| Tampa: | $1,444 |
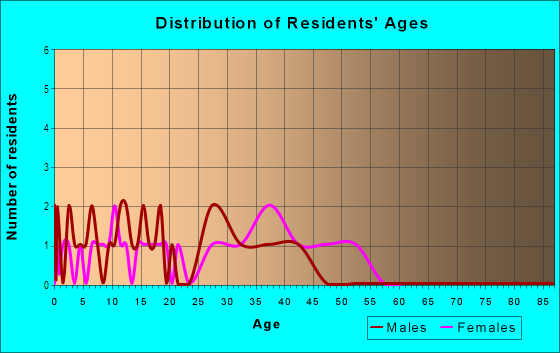
| Males: | 105 |
| Females: | 116 |
Males:
| This neighborhood: | 37.2 years |
| Whole city: | 35.5 years |
| This neighborhood: | 42.5 years |
| Whole city: | 35.1 years |
Average household size:
| Brookgreen Village: | 2.2 people |
| Tampa: | 2.3 people |
Percentage of family households:
| Brookgreen Village: | 46.2% |
| Tampa: | 39.9% |
| Here: | 33.2% |
| Tampa: | 35.4% |
Percentage of married-couple families with children (among all households):
| Brookgreen Village: | 31.4% |
| Tampa: | 25.1% |
Percentage of single-mother households (among all households):
| Brookgreen Village: | 11.8% |
| Tampa: | 12.2% |
Percentage of never married males 15 years old and over:
Percentage of never married females 15 years old and over:
| Brookgreen Village: | 10.9% |
| Tampa: | 23.6% |
Percentage of never married females 15 years old and over:
| Brookgreen Village: | 11.4% |
| city: | 20.9% |
Percentage of people that speak English not well or not at all:
| Brookgreen Village: | 13.7% |
| Tampa: | 6.4% |
Percentage of people born in this state:
Percentage of people born in another U.S. state:
Percentage of native residents but born outside the U.S.:
Percentage of foreign born residents:
| Here: | 46.1% |
| Tampa: | 39.7% |
Percentage of people born in another U.S. state:
| Brookgreen Village: | 24.1% |
| Tampa: | 35.7% |
Percentage of native residents but born outside the U.S.:
| Here: | 8.3% |
| city: | 4.6% |
Percentage of foreign born residents:
| Here: | 21.5% |
| Tampa: | 20.0% |

Owner-occupied
Renter-occupied


- Rooms in owner-occupied houses and condos in Brookgreen Village
- 21 room
- 02 rooms
- 83 rooms
- 104 rooms
- 205 rooms
- 206 rooms
- 57 rooms
- 38 rooms
- 19+ rooms

- Rooms in renter-occupied apartments in Brookgreen Village
- 21 room
- 02 rooms
- 53 rooms
- 94 rooms
- 115 rooms
- 86 rooms
- 77 rooms
- 38 rooms
- 09+ rooms
Owner-occupied
Renter-occupied

- Bedrooms in owner-occupied houses and condos in Brookgreen Village
- 2no bedroom
- 11 bedroom
- 142 bedrooms
- 573 bedrooms
- 24 bedrooms
- 05+ bedrooms

- Bedrooms in renter-occupied apartments in Brookgreen Village
- 2no bedroom
- 61 bedroom
- 22 bedrooms
- 253 bedrooms
- 44 bedrooms
- 05+ bedrooms
Average number of cars or other vehicles available in houses/condos:
Average number of cars or other vehicles available in apartments:
| This neighborhood: | 1.6 |
| Tampa: | 1.9 |
Average number of cars or other vehicles available in apartments:
| Here: | 1.7 |
| city: | 1.3 |
Percentage of units with a mortgage:
| Brookgreen Village: | 87.0% |
| Tampa: | 65.8% |
Housing prices:
- Average estimated value of detached houses in 2022 (74.0% of all units):
Brookgreen Village: $269,728 Tampa: $505,567
- Average estimated value of townhouses or other attached units in 2022 (26.0% of all units):
This neighborhood: $205,364 city: $395,525

- Year house built in Brookgreen Village
- 02020 or later
- 22010 to 2019
- 22000 to 2009
- 121990 to 1999
- 311980 to 1989
- 511970 to 1979
- 11960 to 1969
- 01950 to 1959
- 21940 to 1949
- 01939 or earlier

City-data.com crime index for city in 2020 (higher means more crime):
| City: | 212.7 |
| U.S. average: | 219.5 |
Travel time to work (commute)
![Travel time to work (commute)]()
- 45 to 9 minutes
- 2410 to 14 minutes
- 2615 to 19 minutes
- 2820 to 24 minutes
- 1025 to 29 minutes
- 2230 to 34 minutes
- 135 to 39 minutes
- 1240 to 44 minutes
- 1345 to 59 minutes
- 660 to 89 minutes
- 190 or more minutes

Means of transportation to work
![Means of transportation to work]()
- 80.0%85Drove a car alone
- 6.6%7Carpooled
- 1.9%2Bus
- 0.9%1Taxi
- 7.5%8Other means
- 11.3%12Worked at home

Time leaving home to go to work
![Time leaving home to go to work]()
- 612:00 a.m. to 4:59 a.m.
- 75:00 a.m. to 5:29 a.m.
- 105:30 a.m. to 5:59 a.m.
- 216:00 a.m. to 6:29 a.m.
- 196:30 a.m. to 6:59 a.m.
- 217:00 a.m. to 7:29 a.m.
- 227:30 a.m. to 7:59 a.m.
- 118:00 a.m. to 8:29 a.m.
- 78:30 a.m. to 8:59 a.m.
- 119:00 a.m. to 9:59 a.m.
- 210:00 a.m. to 10:59 a.m.
- 612:00 p.m. to 3:59 p.m.
- 94:00 p.m. to 11:59 p.m.

Occupations of males:
- Percentage of males in management occupations (except farmers):
Here: 8.5% city: 14.3%
- Percentage of males in business and financial operations occupations:
Here: 7.5% city: 7.8%
- Percentage of males in computer and mathematical occupations:
Here: 4.5% city: 6.0%
- Percentage of males in architecture and engineering occupations:
Here: 1.6% city: 2.6%
- Percentage of males in community and social services occupations:
Here: 3.3% city: 0.5%
- Percentage of males in education, training, and library occupations:
Here: 6.4% city: 2.2%
- Percentage of males in healthcare practitioners and technical occupations:
Here: 15.1% city: 4.9%
- Percentage of males in service occupations:
Here: 4.0% city: 13.7%
- Percentage of males in sales and office occupations:
Here: 3.3% city: 16.3%
- Percentage of males in construction, extraction, and maintenance occupations:
Here: 12.2% city: 8.2%
- Percentage of males in production occupations:
Here: 23.8% city: 3.7%
- Percentage of males in transportation occupations:
Here: 15.8% city: 5.8%
- Percentage of males in material moving occupations:
Here: 3.3% city: 3.8%
Occupations of females:
- Percentage of females in management occupations (except farmers):
Here: 8.7% city: 10.9%
- Percentage of females in business and financial operations occupations:
Here: 17.9% city: 8.5%
- Percentage of females in computer and mathematical occupations:
Here: 4.6% city: 2.4%
- Percentage of females in legal occupations:
Here: 6.0% city: 2.7%
- Percentage of females in education, training, and library occupations:
Here: 8.3% city: 7.2%
- Percentage of females in arts, design, entertainment, sports, and media occupations:
Here: 6.7% city: 2.1%
- Percentage of females in healthcare practitioners and technical occupations:
Here: 15.3% city: 10.3%
- Percentage of females in service occupations:
Here: 16.9% city: 19.1%
- Percentage of females in sales and office occupations:
Here: 33.2% city: 27.1%
- Percentage of females in production occupations:
Here: 10.9% city: 2.0%
- Percentage of females in transportation occupations:
Here: 3.3% city: 1.3%
- Percentage of females in material moving occupations:
Here: 3.7% city: 1.4%
Education in this neighborhood (subdivision or community):
- Percentage of people 3 years and older in K-12 schools:
Brookgreen Village: 15.5% Tampa: 14.3%
- Percentage of people 3 years and older in undergraduate colleges:
Brookgreen Village: 18.3% Tampa: 7.8%
- Percentage of people 3 years and older in grad. or professional schools:
Brookgreen Village: 2.7% Tampa: 2.0%
- Percentage of students K-12 enrolled in private schools:
Brookgreen Village: 17.6% Tampa: 12.5%
Percentage of population below poverty level:
| Brookgreen Village: | 7.7% |
| Tampa: | 16.3% |
Median year owner moved in (as recorded in 2022):
Median year renter moved in (as recorded in 2022):
| Brookgreen Village: | 2012 |
| Tampa: | 2013 |
Median year renter moved in (as recorded in 2022):
| Brookgreen Village: | 2014 |
| Tampa: | 2020 |
Percentage of married-couple families with both working:
| Brookgreen Village: | 102.7% |
| Tampa: | 70.4% |

- 89.9%Electricity
- 10.1%Utility gas
Roads and streets:
Bramblebrush St
Length: 0.32 miles
Directions: E-W, SE-NW, SW-NE
Address range: 11100 to 11233
Directions: E-W, SE-NW, SW-NE
Address range: 11100 to 11233
Thicket Ct
Length: 0.17 miles
Directions: E-W, SE-NW, SW-NE
Address range: 11200 to 11299
Directions: E-W, SE-NW, SW-NE
Address range: 11200 to 11299
Lakegreen Way
Length: 0.11 miles
Directions: E-W, N-S, SE-NW, SW-NE
Directions: E-W, N-S, SE-NW, SW-NE
Brook Green Dr
Length: 0.08 miles
Direction: SW-NE
Address range: 11359 to 11385
Direction: SW-NE
Address range: 11359 to 11385
Rambling Rose Pl
Length: 0.05 miles
Direction: SW-NE
Address range: 4900 to 4915
Direction: SW-NE
Address range: 4900 to 4915
Forest Brook Pl
Length: 0.04 miles
Direction: SW-NE
Address range: 4900 to 4999
Direction: SW-NE
Address range: 4900 to 4999