Blue Lake Estates neighborhood in Auburndale, Florida (FL), 33823, 33881 detailed profile
Settings
X


Business Search - 14 Million verified businesses
Area: 0.174 square miles
Population: 504
Population density:
| Blue Lake Estates: | 2,891 people per square mile |
| Auburndale: | 3,148 people per square mile |

- 22243.7%White
- 18636.6%Black
- 7314.4%Hispanic or Latino
- 214.1%Two or more races
- 51.0%Some other race
- 10.2%Asian

Distribution of median household income
![Distribution of median household income]()
- 25Less than $10,000
- 24$10,000 to $19,999
- 28$20,000 to $29,999
- 12$30,000 to $39,999
- 33$40,000 to $49,999
- 15$50,000 to $59,999
- 19$60,000 to $74,999
- 21$75,000 to $99,999
- 12$100,000 to $124,999
- 3$125,000 to $149,999
- 5$150,000 to $199,999
- 3$200,000 or more

Distribution of owner-occupied house/condo value
![Distribution of owner-occupied house/condo value]()
- 65Less than $50,000
- 27$50,000 to $99,999
- 17$100,000 to $149,999
- 25$150,000 to $199,999
- 3$200,000 to $249,999
- 29$250,000 to $299,999
- 7$300,000 to $399,999
- 1$500,000 to $749,999
- 2$750,000 to $999,999
- 1$1,000,000 or more

Distribution of rent paid by renters
![Distribution of rent paid by renters]()
- 2$100 to $199
- 3$200 to $299
- 7$300 to $399
- 31$400 to $499
- 11$500 to $599
- 26$600 to $699
- 8$700 to $799
- 8$800 to $899
- 32$900 to $999
- 14$1,000 to $1,249
- 3$1,250 to $1,499
- 1$2,000 or more

Median rent in 2022:
| Blue Lake Estates: | $704 |
| Auburndale: | $816 |
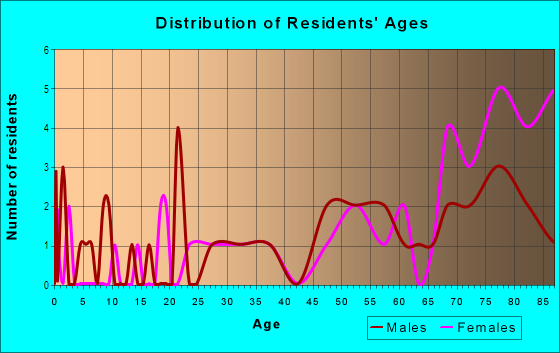
| Males: | 242 |
| Females: | 261 |
Males:
| This neighborhood: | 31.5 years |
| Whole city: | 39.3 years |
| This neighborhood: | 37.3 years |
| Whole city: | 39.2 years |
Average household size:
| Blue Lake Estates: | 19.4 people |
| Auburndale: | 2.9 people |
Percentage of family households:
| Blue Lake Estates: | 65.4% |
| Auburndale: | 48.0% |
| Here: | 40.5% |
| Auburndale: | 49.6% |
Percentage of married-couple families with children (among all households):
| Blue Lake Estates: | 14.8% |
| Auburndale: | 21.6% |
Percentage of single-mother households (among all households):
| Blue Lake Estates: | 15.8% |
| Auburndale: | 8.6% |
Percentage of never married males 15 years old and over:
Percentage of never married females 15 years old and over:
| Blue Lake Estates: | 17.6% |
| Auburndale: | 16.3% |
Percentage of never married females 15 years old and over:
| Blue Lake Estates: | 21.1% |
| city: | 13.5% |
Percentage of people that speak English not well or not at all:
| Blue Lake Estates: | 8.1% |
| Auburndale: | 3.4% |
Percentage of people born in this state:
Percentage of people born in another U.S. state:
Percentage of native residents but born outside the U.S.:
Percentage of foreign born residents:
| Here: | 51.3% |
| Auburndale: | 48.4% |
Percentage of people born in another U.S. state:
| Blue Lake Estates: | 22.3% |
| Auburndale: | 35.3% |
Percentage of native residents but born outside the U.S.:
| Here: | 7.8% |
| city: | 7.0% |
Percentage of foreign born residents:
| Here: | 18.6% |
| Auburndale: | 9.3% |

Owner-occupied
Renter-occupied


- Rooms in owner-occupied houses and condos in Blue Lake Estates
- 01 room
- 32 rooms
- 133 rooms
- 234 rooms
- 125 rooms
- 116 rooms
- 137 rooms
- 28 rooms
- 99+ rooms

- Rooms in renter-occupied apartments in Blue Lake Estates
- 21 room
- 02 rooms
- 33 rooms
- 324 rooms
- 385 rooms
- 126 rooms
- 67 rooms
- 28 rooms
- 09+ rooms
Owner-occupied
Renter-occupied

- Bedrooms in owner-occupied houses and condos in Blue Lake Estates
- 0no bedroom
- 81 bedroom
- 342 bedrooms
- 263 bedrooms
- 84 bedrooms
- 115+ bedrooms

- Bedrooms in renter-occupied apartments in Blue Lake Estates
- 2no bedroom
- 61 bedroom
- 542 bedrooms
- 263 bedrooms
- 64 bedrooms
- 05+ bedrooms
Average number of cars or other vehicles available in houses/condos:
Average number of cars or other vehicles available in apartments:
| This neighborhood: | 1.9 |
| Auburndale: | 2.0 |
Average number of cars or other vehicles available in apartments:
| Here: | 1.4 |
| city: | 1.3 |
Percentage of units with a mortgage:
| Blue Lake Estates: | 32.8% |
| Auburndale: | 57.3% |
Average estimated value of detached houses in 2022 (38.2% of all units):
| Blue Lake Estates: | $61,186 |
| Florida: | $500,941 |

- Year house built in Blue Lake Estates
- 02020 or later
- 22010 to 2019
- 112000 to 2009
- 181990 to 1999
- 641980 to 1989
- 311970 to 1979
- 401960 to 1969
- 381950 to 1959
- 71940 to 1949
- 61939 or earlier

City-data.com crime index for city in 2020 (higher means more crime):
| City: | 220.4 |
| U.S. average: | 219.5 |
Travel time to work (commute)
![Travel time to work (commute)]()
- 4Less than 5 minutes
- 205 to 9 minutes
- 1810 to 14 minutes
- 3415 to 19 minutes
- 2420 to 24 minutes
- 425 to 29 minutes
- 1630 to 34 minutes
- 435 to 39 minutes
- 540 to 44 minutes
- 445 to 59 minutes
- 1660 to 89 minutes
- 690 or more minutes

Means of transportation to work
![Means of transportation to work]()
- 87.5%140Drove a car alone
- 9.4%15Carpooled
- 2.5%4Bicycle
- 1.3%2Walked
- 2.5%4Other means
- 1.3%2Worked at home

Time leaving home to go to work
![Time leaving home to go to work]()
- 1112:00 a.m. to 4:59 a.m.
- 65:00 a.m. to 5:29 a.m.
- 65:30 a.m. to 5:59 a.m.
- 346:00 a.m. to 6:29 a.m.
- 76:30 a.m. to 6:59 a.m.
- 207:00 a.m. to 7:29 a.m.
- 187:30 a.m. to 7:59 a.m.
- 78:00 a.m. to 8:29 a.m.
- 68:30 a.m. to 8:59 a.m.
- 49:00 a.m. to 9:59 a.m.
- 310:00 a.m. to 10:59 a.m.
- 111:00 a.m. to 11:59 a.m.
- 1512:00 p.m. to 3:59 p.m.
- 164:00 p.m. to 11:59 p.m.

Occupations of males:
- Percentage of males in management occupations (except farmers):
Here: 4.9% city: 18.0%
- Percentage of males in business and financial operations occupations:
Here: 1.2% city: 2.5%
- Percentage of males in life, physical, and social science occupations:
Here: 3.1% city: 0.9%
- Percentage of males in community and social services occupations:
Here: 1.2% city: 1.2%
- Percentage of males in education, training, and library occupations:
Here: 6.4% city: 2.6%
- Percentage of males in arts, design, entertainment, sports, and media occupations:
Here: 4.6% city: 4.6%
- Percentage of males in healthcare practitioners and technical occupations:
Here: 2.0% city: 2.6%
- Percentage of males in service occupations:
Here: 10.8% city: 14.3%
- Percentage of males in sales and office occupations:
Here: 10.6% city: 13.2%
- Percentage of males in farming, fishing, and forestry occupations:
Here: 5.8% city: 2.0%
- Percentage of males in construction, extraction, and maintenance occupations:
Here: 5.6% city: 10.1%
- Percentage of males in production occupations:
Here: 21.1% city: 3.2%
- Percentage of males in transportation occupations:
Here: 15.0% city: 7.3%
- Percentage of males in material moving occupations:
Here: 9.0% city: 4.1%
Occupations of females:
- Percentage of females in management occupations (except farmers):
Here: 2.4% city: 12.7%
- Percentage of females in business and financial operations occupations:
Here: 2.7% city: 5.6%
- Percentage of females in education, training, and library occupations:
Here: 8.2% city: 8.5%
- Percentage of females in healthcare practitioners and technical occupations:
Here: 3.2% city: 7.5%
- Percentage of females in service occupations:
Here: 32.2% city: 20.8%
- Percentage of females in sales and office occupations:
Here: 37.6% city: 34.7%
- Percentage of females in transportation occupations:
Here: 1.7% city: 0.3%
- Percentage of females in material moving occupations:
Here: 9.5% city: 2.2%
Education in this neighborhood (subdivision or community):
- Percentage of people 3 years and older in K-12 schools:
Blue Lake Estates: 26.3% Auburndale: 18.2%
- Percentage of people 3 years and older in undergraduate colleges:
Blue Lake Estates: 4.3% Auburndale: 3.0%
- Percentage of people 3 years and older in grad. or professional schools:
Blue Lake Estates: 0.6% Auburndale: 0.3%
- Percentage of students K-12 enrolled in private schools:
Blue Lake Estates: 20.2% Auburndale: 10.1%
Percentage of population below poverty level:
| Blue Lake Estates: | 27.0% |
| Auburndale: | 11.0% |
Median year owner moved in (as recorded in 2022):
Median year renter moved in (as recorded in 2022):
| Blue Lake Estates: | 2007 |
| Auburndale: | 2011 |
Median year renter moved in (as recorded in 2022):
| Blue Lake Estates: | 2016 |
| Auburndale: | 2016 |
Percentage of married-couple families with both working:
| Blue Lake Estates: | 72.3% |
| Auburndale: | 75.3% |

- 85.4%Electricity
- 6.5%No fuel used
- 3.2%Solar energy
- 2.2%Bottled, tank, or LP gas
- 1.4%Utility gas
- 1.4%Wood
Highways in this neighborhood:
State Hwy 544 (Havendale Blvd)
Length: 0.38 miles
Directions: E-W, SE-NW
Address range: 1094 to 1371
Directions: E-W, SE-NW
Address range: 1094 to 1371
Roads and streets:
Florida Ct
Length: 0.22 miles
Directions: E-W, SW-NE
Address range: 53 to 99
Directions: E-W, SW-NE
Address range: 53 to 99
Jersey Rd
Length: 0.21 miles
Direction: N-S
Address range: 1088 to 2790
Direction: N-S
Address range: 1088 to 2790
Indiana Ct
Length: 0.17 miles
Directions: E-W, N-S, SE-NW
Address range: 38 to 58
Directions: E-W, N-S, SE-NW
Address range: 38 to 58
Dixie Ct
Length: 0.17 miles
Directions: E-W, N-S
Directions: E-W, N-S
Morton Rd
Length: 0.14 miles
Direction: E-W
Address range: 1 to 99
Direction: E-W
Address range: 1 to 99
Pinehurst Ave (E Derby Ave)
Length: 0.13 miles
Direction: E-W
Address range: 90 to 1099
Direction: E-W
Address range: 90 to 1099
Rose St
Length: 0.10 miles
Direction: N-S
Direction: N-S
Old Winter Haven Rd
Length: 0.06 miles
Direction: E-W
Address range: 900 to 999
Direction: E-W
Address range: 900 to 999
Poinsetta Rd
Length: 0.06 miles
Directions: N-S, SW-NE
Address range: 300 to 413
Directions: N-S, SW-NE
Address range: 300 to 413
Roller Ln
Length: 0.03 miles
Direction: N-S
Address range: 600 to 699
Direction: N-S
Address range: 600 to 699