Belmar Shore neighborhood in Tampa, Florida (FL), 33629 detailed profile
Settings
X


Business Search - 14 Million verified businesses
Area: 0.088 square miles
Population: 87
Population density:
| Belmar Shore: | 992 people per square mile |
| Tampa: | 3,553 people per square mile |

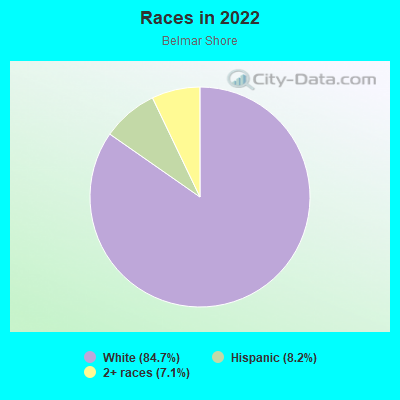
- 7284.7%White
- 78.2%Hispanic or Latino
- 67.1%Two or more races
Median household income in 2022:
| Belmar Shore: | $171,094 |
| Tampa: | $71,089 |
Distribution of median household income
![Distribution of median household income]()
- 1Less than $10,000
- 1$10,000 to $19,999
- 2$20,000 to $29,999
- 1$30,000 to $39,999
- 2$40,000 to $49,999
- 3$50,000 to $59,999
- 1$60,000 to $74,999
- 7$75,000 to $99,999
- 3$100,000 to $124,999
- 1$125,000 to $149,999
- 5$150,000 to $199,999
- 14$200,000 or more

Distribution of owner-occupied house/condo value
![Distribution of owner-occupied house/condo value]()
- 2Less than $50,000
- 1$150,000 to $199,999
- 1$250,000 to $299,999
- 3$300,000 to $399,999
- 7$400,000 to $499,999
- 6$500,000 to $749,999
- 9$750,000 to $999,999
- 7$1,000,000 or more

Distribution of rent paid by renters
![Distribution of rent paid by renters]()
- 1$1,250 to $1,499
- 2$1,500 to $1,999
- 2$2,000 or more

Median rent in 2022:
| Belmar Shore: | $1,953 |
| Tampa: | $1,444 |
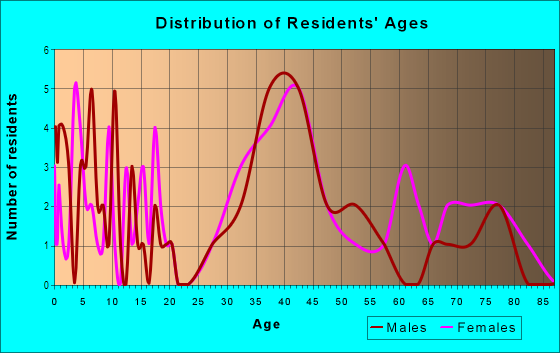
| Males: | 47 |
| Females: | 39 |
Males:
| This neighborhood: | 36.1 years |
| Whole city: | 35.5 years |
| This neighborhood: | 36.8 years |
| Whole city: | 35.1 years |
Average household size:
| Belmar Shore: | 2.7 people |
| Tampa: | 2.3 people |
Percentage of family households:
| Belmar Shore: | 66.2% |
| Tampa: | 39.9% |
| Here: | 68.9% |
| Tampa: | 35.4% |
Percentage of married-couple families with children (among all households):
| Belmar Shore: | 31.8% |
| Tampa: | 25.1% |
Percentage of single-mother households (among all households):
| Belmar Shore: | 2.6% |
| Tampa: | 12.2% |
Percentage of never married males 15 years old and over:
Percentage of never married females 15 years old and over:
| Belmar Shore: | 17.7% |
| Tampa: | 23.6% |
Percentage of never married females 15 years old and over:
| Belmar Shore: | 4.4% |
| city: | 20.9% |
Percentage of people that speak English not well or not at all:
| Belmar Shore: | 0.0% |
| Tampa: | 6.4% |
Percentage of people born in this state:
Percentage of people born in another U.S. state:
Percentage of native residents but born outside the U.S.:
Percentage of foreign born residents:
| Here: | 53.6% |
| Tampa: | 39.7% |
Percentage of people born in another U.S. state:
| Belmar Shore: | 39.1% |
| Tampa: | 35.7% |
Percentage of native residents but born outside the U.S.:
| Here: | 1.2% |
| city: | 4.6% |
Percentage of foreign born residents:
| Here: | 6.0% |
| Tampa: | 20.0% |
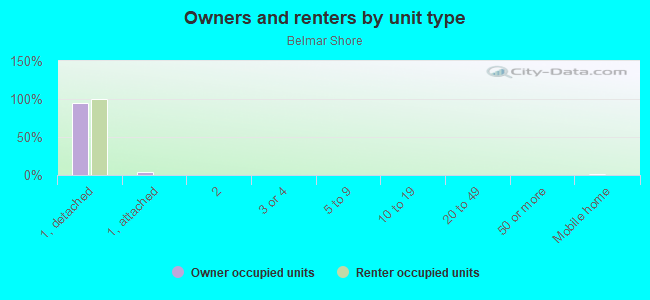
Owner-occupied
Renter-occupied

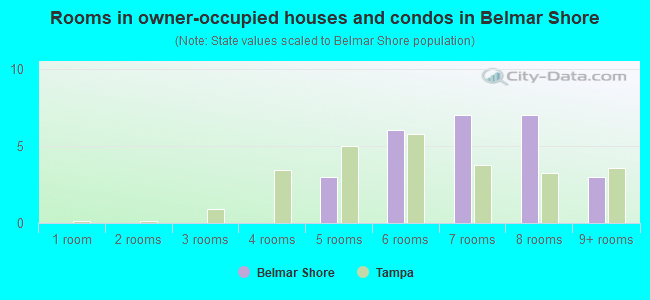
- Rooms in owner-occupied houses and condos in Belmar Shore
- 01 room
- 02 rooms
- 03 rooms
- 04 rooms
- 35 rooms
- 66 rooms
- 77 rooms
- 78 rooms
- 39+ rooms
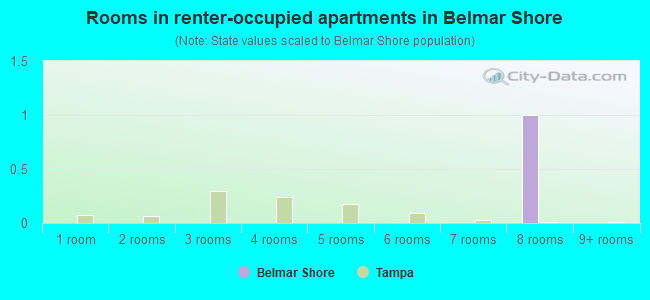
- Rooms in renter-occupied apartments in Belmar Shore
- 01 room
- 02 rooms
- 03 rooms
- 04 rooms
- 05 rooms
- 06 rooms
- 07 rooms
- 18 rooms
- 09+ rooms
Owner-occupied
Renter-occupied
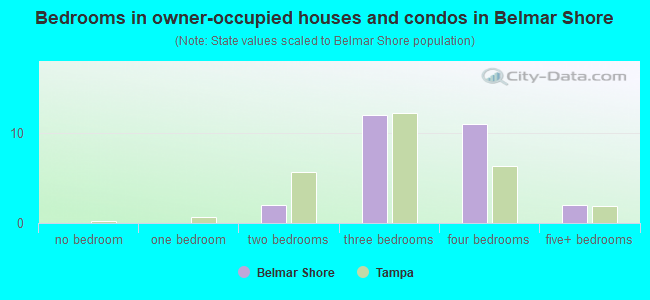
- Bedrooms in owner-occupied houses and condos in Belmar Shore
- 0no bedroom
- 01 bedroom
- 22 bedrooms
- 123 bedrooms
- 114 bedrooms
- 25+ bedrooms
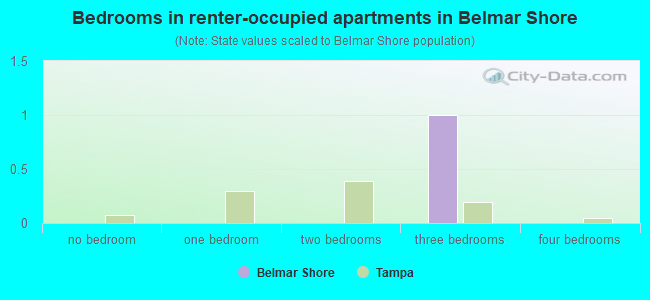
- Bedrooms in renter-occupied apartments in Belmar Shore
- 0no bedroom
- 01 bedroom
- 02 bedrooms
- 13 bedrooms
- 04 bedrooms
- 05+ bedrooms
Average number of cars or other vehicles available in houses/condos:
Average number of cars or other vehicles available in apartments:
| This neighborhood: | 1.9 |
| Tampa: | 1.9 |
Average number of cars or other vehicles available in apartments:
| Here: | 2.6 |
| city: | 1.3 |
Percentage of units with a mortgage:
| Belmar Shore: | 56.6% |
| Tampa: | 65.8% |
Housing prices:
- Average estimated value of detached houses in 2022 (100.0% of all units):
Belmar Shore: $987,887 Tampa: $505,567
- Average estimated value of townhouses or other attached units in 2022 (3.0% of all units):
This neighborhood: $523,837 city: $395,525
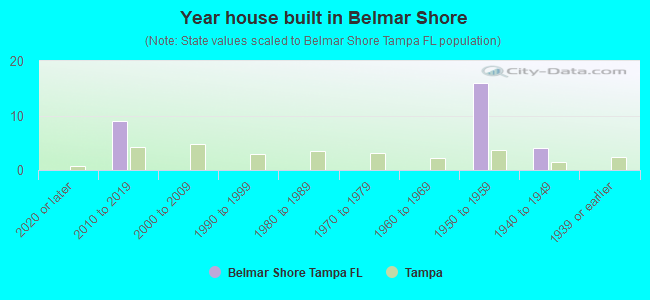
- Year house built in Belmar Shore
- 02020 or later
- 92010 to 2019
- 02000 to 2009
- 01990 to 1999
- 01980 to 1989
- 01970 to 1979
- 01960 to 1969
- 161950 to 1959
- 41940 to 1949
- 01939 or earlier
City-data.com crime index for city in 2020 (higher means more crime):
| City: | 212.7 |
| U.S. average: | 219.5 |
Travel time to work (commute)
![Travel time to work (commute)]()
- 310 to 14 minutes
- 615 to 19 minutes
- 520 to 24 minutes
- 225 to 29 minutes
- 530 to 34 minutes
- 140 to 44 minutes
- 245 to 59 minutes
- 160 to 89 minutes

Means of transportation to work
![Means of transportation to work]()
- 69.3%30Drove a car alone
- 2.3%1Carpooled
- 25.4%11Worked at home

Time leaving home to go to work
![Time leaving home to go to work]()
- 16:00 a.m. to 6:29 a.m.
- 26:30 a.m. to 6:59 a.m.
- 37:00 a.m. to 7:29 a.m.
- 57:30 a.m. to 7:59 a.m.
- 68:00 a.m. to 8:29 a.m.
- 48:30 a.m. to 8:59 a.m.
- 39:00 a.m. to 9:59 a.m.
- 110:00 a.m. to 10:59 a.m.

Occupations of males:
- Percentage of males in management occupations (except farmers):
Here: 36.5% city: 14.3%
- Percentage of males in business and financial operations occupations:
Here: 5.1% city: 7.8%
- Percentage of males in computer and mathematical occupations:
Here: 1.2% city: 6.0%
- Percentage of males in architecture and engineering occupations:
Here: 1.6% city: 2.6%
- Percentage of males in legal occupations:
Here: 8.1% city: 2.8%
- Percentage of males in education, training, and library occupations:
Here: 1.2% city: 2.2%
- Percentage of males in arts, design, entertainment, sports, and media occupations:
Here: 3.3% city: 2.5%
- Percentage of males in healthcare practitioners and technical occupations:
Here: 2.7% city: 4.9%
- Percentage of males in service occupations:
Here: 7.5% city: 13.7%
- Percentage of males in sales and office occupations:
Here: 24.3% city: 16.3%
- Percentage of males in construction, extraction, and maintenance occupations:
Here: 3.0% city: 8.2%
- Percentage of males in production occupations:
Here: 3.0% city: 3.7%
- Percentage of males in transportation occupations:
Here: 6.0% city: 5.8%
- Percentage of males in material moving occupations:
Here: 3.6% city: 3.8%
Occupations of females:
- Percentage of females in management occupations (except farmers):
Here: 15.0% city: 10.9%
- Percentage of females in business and financial operations occupations:
Here: 19.4% city: 8.5%
- Percentage of females in computer and mathematical occupations:
Here: 6.6% city: 2.4%
- Percentage of females in architecture and engineering occupations:
Here: 1.6% city: 0.6%
- Percentage of females in community and social services occupations:
Here: 6.2% city: 2.1%
- Percentage of females in legal occupations:
Here: 17.8% city: 2.7%
- Percentage of females in education, training, and library occupations:
Here: 6.2% city: 7.2%
- Percentage of females in arts, design, entertainment, sports, and media occupations:
Here: 1.7% city: 2.1%
- Percentage of females in healthcare practitioners and technical occupations:
Here: 5.0% city: 10.3%
- Percentage of females in service occupations:
Here: 2.8% city: 19.1%
- Percentage of females in sales and office occupations:
Here: 15.3% city: 27.1%
- Percentage of females in transportation occupations:
Here: 4.6% city: 1.3%
- Percentage of females in material moving occupations:
Here: 4.1% city: 1.4%
Percentage of people 16-64 in Armed Forces:
| Belmar Shore: | 0.6% |
| Tampa: | 1.1% |
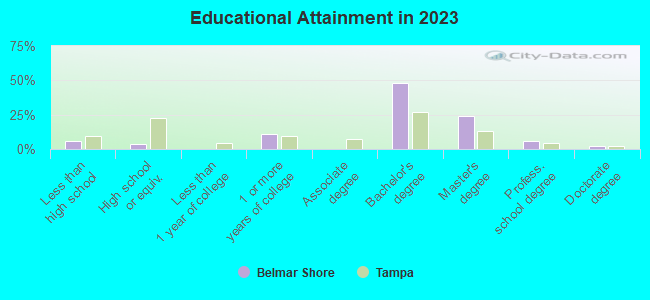
Education in this neighborhood (subdivision or community):
- Percentage of people 3 years and older in K-12 schools:
Belmar Shore: 12.7% Tampa: 14.3%
- Percentage of people 3 years and older in undergraduate colleges:
Belmar Shore: 1.3% Tampa: 7.8%
- Percentage of people 3 years and older in grad. or professional schools:
Belmar Shore: 2.5% Tampa: 2.0%
- Percentage of students K-12 enrolled in private schools:
Belmar Shore: 20.0% Tampa: 12.5%
Percentage of population below poverty level:
| Belmar Shore: | 0.9% |
| Tampa: | 16.3% |
Median year owner moved in (as recorded in 2022):
| Belmar Shore: | 2015 |
| Tampa: | 2013 |
Percentage of married-couple families with both working:
| Belmar Shore: | 83.9% |
| Tampa: | 70.4% |
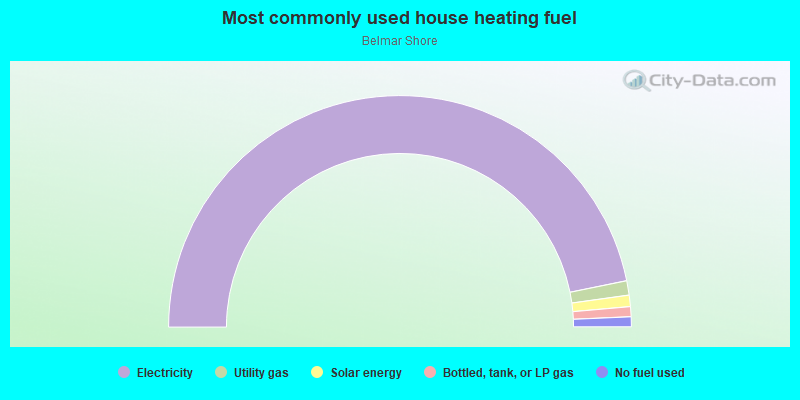
- 93.7%Electricity
- 2.0%Utility gas
- 1.6%Solar energy
- 1.4%Bottled, tank, or LP gas
- 1.4%No fuel used
Roads and streets:
S Lightner Dr
Length: 0.31 miles
Direction: N-S
Address range: 3400 to 3699
Direction: N-S
Address range: 3400 to 3699
S Omar Ave
Length: 0.30 miles
Direction: N-S
Address range: 3400 to 3699
Direction: N-S
Address range: 3400 to 3699
Co Rd 587 (S West Shore Blvd)
Length: 0.25 miles
Direction: N-S
Address range: 3415 to 3699
Direction: N-S
Address range: 3415 to 3699
W Euclid Ave
Length: 0.25 miles
Direction: E-W
Address range: 4800 to 4974
Direction: E-W
Address range: 4800 to 4974
W el Prado Blvd
Length: 0.25 miles
Direction: E-W
Address range: 4800 to 4999
Direction: E-W
Address range: 4800 to 4999
Belcher Dr
Length: 0.19 miles
Direction: N-S
Address range: 3550 to 3699
Direction: N-S
Address range: 3550 to 3699
S Gardenia Ave
Length: 0.19 miles
Direction: N-S
Address range: 3600 to 3699
Direction: N-S
Address range: 3600 to 3699
W Spring Lake Dr
Length: 0.06 miles
Directions: E-W, N-S
Address range: 4812 to 4910
Directions: E-W, N-S
Address range: 4812 to 4910