Battery Park neighborhood in Richmond, Virginia (VA), 23222 detailed profile
Settings
X


Business Search - 14 Million verified businesses
Area: 0.249 square miles
Population: 1,431
Population density:
| Battery Park: | 5,743 people per square mile |
| Richmond: | 3,819 people per square mile |

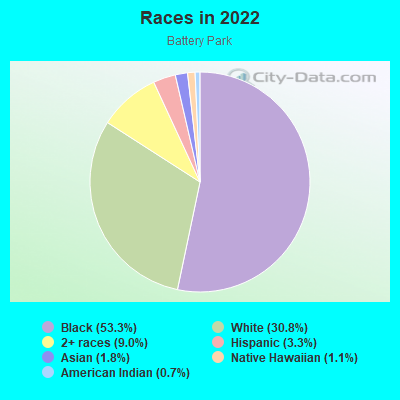
- 78453.3%Black
- 45330.8%White
- 1329.0%Two or more races
- 483.3%Hispanic or Latino
- 261.8%Asian
- 161.1%Native Hawaiian and Other
Pacific Islander - 110.7%American Indian
Median household income in 2022:
| Battery Park: | $73,345 |
| Richmond: | $58,988 |
Distribution of median household income
![Distribution of median household income]()
- 32Less than $10,000
- 94$10,000 to $19,999
- 73$20,000 to $29,999
- 48$30,000 to $39,999
- 54$40,000 to $49,999
- 44$50,000 to $59,999
- 46$60,000 to $74,999
- 87$75,000 to $99,999
- 43$100,000 to $124,999
- 67$125,000 to $149,999
- 60$150,000 to $199,999
- 41$200,000 or more

Distribution of owner-occupied house/condo value
![Distribution of owner-occupied house/condo value]()
- 12Less than $50,000
- 8$50,000 to $99,999
- 14$100,000 to $149,999
- 27$150,000 to $199,999
- 67$200,000 to $249,999
- 73$250,000 to $299,999
- 127$300,000 to $399,999
- 54$400,000 to $499,999
- 41$500,000 to $749,999
- 40$750,000 to $999,999
- 13$1,000,000 or more

Distribution of rent paid by renters
![Distribution of rent paid by renters]()
- 8Less than $100
- 30$100 to $199
- 37$300 to $399
- 17$400 to $499
- 30$500 to $599
- 49$600 to $699
- 14$700 to $799
- 56$800 to $899
- 60$900 to $999
- 57$1,000 to $1,249
- 20$1,250 to $1,499
- 37$1,500 to $1,999
- 26$2,000 or more

Median rent in 2022:
| Battery Park: | $996 |
| Richmond: | $1,050 |
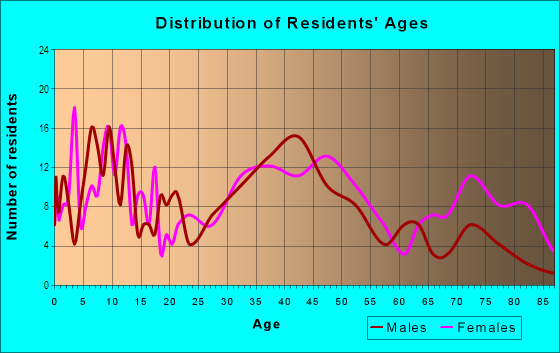
| Males: | 755 |
| Females: | 676 |
Males:
| This neighborhood: | 37.5 years |
| Whole city: | 34.4 years |
| This neighborhood: | 38.0 years |
| Whole city: | 35.1 years |
Average household size:
| Battery Park: | 2.4 people |
| Richmond: | 26.0 people |
Percentage of family households:
| Battery Park: | 45.4% |
| Richmond: | 31.3% |
| Here: | 38.7% |
| Richmond: | 25.2% |
Percentage of married-couple families with children (among all households):
| Battery Park: | 23.5% |
| Richmond: | 23.1% |
Percentage of single-mother households (among all households):
| Battery Park: | 10.8% |
| Richmond: | 19.2% |
Percentage of never married males 15 years old and over:
Percentage of never married females 15 years old and over:
| Battery Park: | 17.1% |
| Richmond: | 25.8% |
Percentage of never married females 15 years old and over:
| Battery Park: | 14.7% |
| city: | 27.8% |
Percentage of people that speak English not well or not at all:
| Battery Park: | 1.8% |
| Richmond: | 3.2% |
Percentage of people born in this state:
Percentage of people born in another U.S. state:
Percentage of native residents but born outside the U.S.:
Percentage of foreign born residents:
| Here: | 65.2% |
| Richmond: | 59.8% |
Percentage of people born in another U.S. state:
| Battery Park: | 28.4% |
| Richmond: | 31.3% |
Percentage of native residents but born outside the U.S.:
| Here: | 1.4% |
| city: | 1.7% |
Percentage of foreign born residents:
| Here: | 4.9% |
| Richmond: | 7.1% |
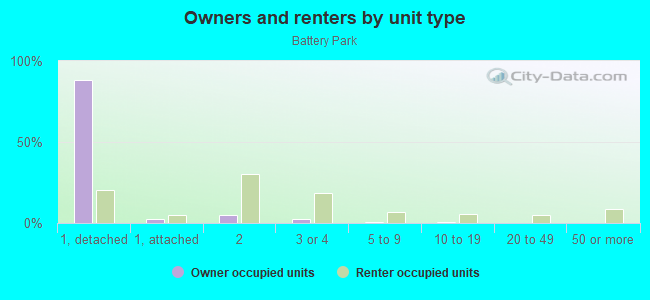
Owner-occupied
Renter-occupied

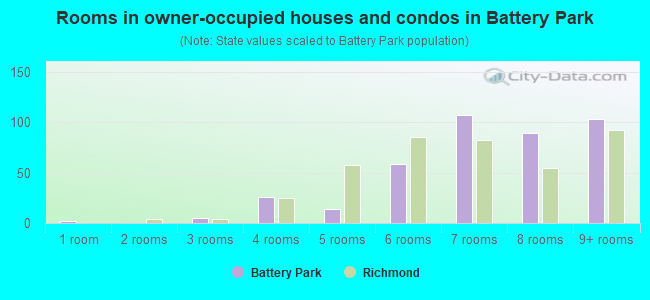
- Rooms in owner-occupied houses and condos in Battery Park
- 21 room
- 02 rooms
- 53 rooms
- 264 rooms
- 145 rooms
- 586 rooms
- 1077 rooms
- 898 rooms
- 1039+ rooms
- Rooms in renter-occupied apartments in Battery Park
- 361 room
- 202 rooms
- 173 rooms
- 314 rooms
- 595 rooms
- 706 rooms
- 217 rooms
- 808 rooms
- 239+ rooms
Owner-occupied
Renter-occupied
- Bedrooms in owner-occupied houses and condos in Battery Park
- 5no bedroom
- 241 bedroom
- 402 bedrooms
- 1443 bedrooms
- 1624 bedrooms
- 405+ bedrooms
- Bedrooms in renter-occupied apartments in Battery Park
- 27no bedroom
- 201 bedroom
- 772 bedrooms
- 743 bedrooms
- 354 bedrooms
- 15+ bedrooms
Average number of cars or other vehicles available in houses/condos:
Average number of cars or other vehicles available in apartments:
| This neighborhood: | 2.0 |
| Richmond: | 1.9 |
Average number of cars or other vehicles available in apartments:
| Here: | 1.3 |
| city: | 1.2 |
Percentage of units with a mortgage:
| Battery Park: | 72.2% |
| Richmond: | 70.8% |
- Year house built in Battery Park
- 22020 or later
- 392010 to 2019
- 162000 to 2009
- 211990 to 1999
- 621980 to 1989
- 361970 to 1979
- 231960 to 1969
- 361950 to 1959
- 901940 to 1949
- 4381939 or earlier
City-data.com crime index for city in 2020 (higher means more crime):
| City: | 274.8 |
| U.S. average: | 219.5 |
Travel time to work (commute)
![Travel time to work (commute)]()
- 16Less than 5 minutes
- 685 to 9 minutes
- 13510 to 14 minutes
- 14815 to 19 minutes
- 7120 to 24 minutes
- 4525 to 29 minutes
- 4330 to 34 minutes
- 1035 to 39 minutes
- 1340 to 44 minutes
- 2345 to 59 minutes
- 1960 to 89 minutes
- 1290 or more minutes

Means of transportation to work
![Means of transportation to work]()
- 67.9%513Drove a car alone
- 7.5%57Carpooled
- 3.4%26Bus
- 0.8%6Long-distance train or commuter rail
- 3.4%26Motorcycle
- 2.9%22Bicycle
- 3.0%23Walked
- 1.6%12Other means
- 18.5%140Worked at home

Time leaving home to go to work
![Time leaving home to go to work]()
- 2212:00 a.m. to 4:59 a.m.
- 235:00 a.m. to 5:29 a.m.
- 105:30 a.m. to 5:59 a.m.
- 246:00 a.m. to 6:29 a.m.
- 496:30 a.m. to 6:59 a.m.
- 527:00 a.m. to 7:29 a.m.
- 727:30 a.m. to 7:59 a.m.
- 828:00 a.m. to 8:29 a.m.
- 408:30 a.m. to 8:59 a.m.
- 509:00 a.m. to 9:59 a.m.
- 3110:00 a.m. to 10:59 a.m.
- 1511:00 a.m. to 11:59 a.m.
- 4412:00 p.m. to 3:59 p.m.
- 644:00 p.m. to 11:59 p.m.

Occupations of males:
- Percentage of males in management occupations (except farmers):
Here: 13.5% city: 10.7%
- Percentage of males in business and financial operations occupations:
Here: 2.6% city: 7.2%
- Percentage of males in computer and mathematical occupations:
Here: 5.5% city: 5.6%
- Percentage of males in architecture and engineering occupations:
Here: 3.6% city: 3.0%
- Percentage of males in life, physical, and social science occupations:
Here: 2.7% city: 1.7%
- Percentage of males in legal occupations:
Here: 1.7% city: 2.5%
- Percentage of males in education, training, and library occupations:
Here: 1.5% city: 4.6%
- Percentage of males in arts, design, entertainment, sports, and media occupations:
Here: 13.6% city: 2.9%
- Percentage of males in healthcare practitioners and technical occupations:
Here: 1.7% city: 3.0%
- Percentage of males in service occupations:
Here: 11.2% city: 15.4%
- Percentage of males in sales and office occupations:
Here: 10.6% city: 15.3%
- Percentage of males in construction, extraction, and maintenance occupations:
Here: 11.2% city: 7.8%
- Percentage of males in production occupations:
Here: 4.3% city: 3.8%
- Percentage of males in transportation occupations:
Here: 1.9% city: 4.8%
- Percentage of males in material moving occupations:
Here: 8.9% city: 7.1%
Occupations of females:
- Percentage of females in management occupations (except farmers):
Here: 13.2% city: 9.9%
- Percentage of females in business and financial operations occupations:
Here: 2.5% city: 8.0%
- Percentage of females in computer and mathematical occupations:
Here: 2.0% city: 1.7%
- Percentage of females in community and social services occupations:
Here: 8.9% city: 4.4%
- Percentage of females in legal occupations:
Here: 2.3% city: 1.7%
- Percentage of females in education, training, and library occupations:
Here: 5.7% city: 9.5%
- Percentage of females in arts, design, entertainment, sports, and media occupations:
Here: 7.3% city: 3.7%
- Percentage of females in healthcare practitioners and technical occupations:
Here: 8.9% city: 8.5%
- Percentage of females in service occupations:
Here: 7.3% city: 21.3%
- Percentage of females in sales and office occupations:
Here: 36.8% city: 23.3%
- Percentage of females in construction, extraction, and maintenance occupations:
Here: 1.8% city: 0.6%
- Percentage of females in production occupations:
Here: 1.5% city: 2.4%
Percentage of people 16-64 in Armed Forces:
| Battery Park: | 1.1% |
| Richmond: | 0.5% |
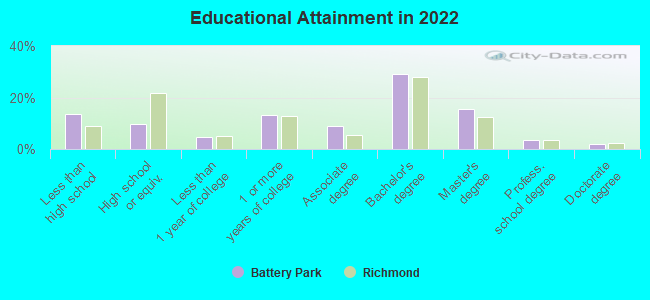
Education in this neighborhood (subdivision or community):
- Percentage of people 3 years and older in K-12 schools:
Battery Park: 12.3% Richmond: 11.5%
- Percentage of people 3 years and older in undergraduate colleges:
Battery Park: 4.5% Richmond: 10.1%
- Percentage of people 3 years and older in grad. or professional schools:
Battery Park: 2.8% Richmond: 1.5%
- Percentage of students K-12 enrolled in private schools:
Battery Park: 32.0% Richmond: 11.4%
Percentage of population below poverty level:
| Battery Park: | 20.1% |
| Richmond: | 21.7% |
Median year owner moved in (as recorded in 2022):
Median year renter moved in (as recorded in 2022):
| Battery Park: | 2009 |
| Richmond: | 2011 |
Median year renter moved in (as recorded in 2022):
| Battery Park: | 2017 |
| Richmond: | 2020 |
Percentage of married-couple families with both working:
| Battery Park: | 58.4% |
| Richmond: | 80.3% |
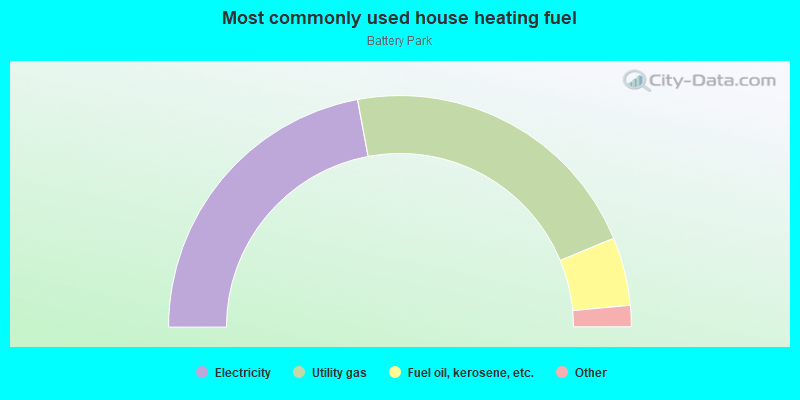
- 44.1%Electricity
- 43.3%Utility gas
- 9.5%Fuel oil, kerosene, etc.
- 1.0%Bottled, tank, or LP gas
- 1.0%Coal or coke
- 0.8%No fuel used
Roads and streets:
Overbrook Rd
Length: 0.62 miles
Direction: E-W
Address range: 1 to 750
Direction: E-W
Address range: 1 to 750
Hawthorne Ave
Length: 0.59 miles
Directions: E-W, N-S, SE-NW
Address range: 2300 to 2906
Directions: E-W, N-S, SE-NW
Address range: 2300 to 2906
W Lancaster Rd
Length: 0.56 miles
Direction: E-W
Address range: 1 to 750
Direction: E-W
Address range: 1 to 750
W Graham Rd
Length: 0.47 miles
Direction: E-W
Address range: 1 to 699
Direction: E-W
Address range: 1 to 699
Montrose Ave
Length: 0.36 miles
Directions: N-S, SE-NW
Address range: 2500 to 2899
Directions: N-S, SE-NW
Address range: 2500 to 2899
The Terrace
Length: 0.36 miles
Directions: E-W, N-S, SE-NW, SW-NE
Address range: 2400 to 2699
Directions: E-W, N-S, SE-NW, SW-NE
Address range: 2400 to 2699
Fendall Ave
Length: 0.27 miles
Directions: N-S, SW-NE
Address range: 2251 to 2611
Directions: N-S, SW-NE
Address range: 2251 to 2611
Edgewood Ave
Length: 0.24 miles
Directions: N-S, SW-NE
Address range: 2600 to 2899
Directions: N-S, SW-NE
Address range: 2600 to 2899
W Essex St
Length: 0.24 miles
Direction: E-W
Address range: 400 to 699
Direction: E-W
Address range: 400 to 699
Tazewell St
Length: 0.21 miles
Direction: N-S
Address range: 2400 to 2699
Direction: N-S
Address range: 2400 to 2699
Griffin Ave
Length: 0.19 miles
Direction: N-S
Address range: 2700 to 2899
Direction: N-S
Address range: 2700 to 2899
Dupont Cir
Length: 0.18 miles
Directions: E-W, N-S, SE-NW
Address range: 2800 to 2899
Directions: E-W, N-S, SE-NW
Address range: 2800 to 2899
W Hooper St
Length: 0.16 miles
Direction: E-W
Address range: 400 to 599
Direction: E-W
Address range: 400 to 599
Miller Ave
Length: 0.14 miles
Directions: N-S, SW-NE
Address range: 2400 to 2599
Directions: N-S, SW-NE
Address range: 2400 to 2599
Moss Side Ave
Length: 0.10 miles
Directions: E-W, N-S, SW-NE
Address range: 2800 to 2899
Directions: E-W, N-S, SW-NE
Address range: 2800 to 2899
The Plaza
Length: 0.09 miles
Direction: SW-NE
Address range: 2600 to 2699
Direction: SW-NE
Address range: 2600 to 2699
Edgehill Rd
Length: 0.05 miles
Direction: E-W
Address range: 600 to 750
Direction: E-W
Address range: 600 to 750