33rd Street Industrial neighborhood in Orlando, Florida (FL), 32805, 32811, 32839 detailed profile
Settings
X


Business Search - 14 Million verified businesses
Area: 0.863 square miles
Population: 1,091
Population density:
| 33rd Street Industrial: | 1,264 people per square mile |
| Orlando: | 3,381 people per square mile |

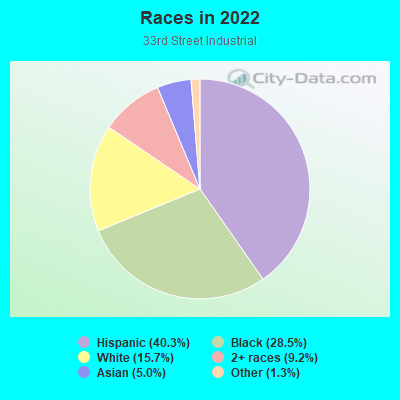
- 50340.3%Hispanic or Latino
- 35628.5%Black
- 19615.7%White
- 1159.2%Two or more races
- 625.0%Asian
- 161.3%Some other race
Median household income in 2022:
| 33rd Street Industrial: | $39,746 |
| Orlando: | $65,354 |
Distribution of median household income
![Distribution of median household income]()
- 16Less than $10,000
- 56$10,000 to $19,999
- 153$20,000 to $29,999
- 28$30,000 to $39,999
- 113$40,000 to $49,999
- 46$50,000 to $59,999
- 6$60,000 to $74,999
- 24$75,000 to $99,999
- 8$100,000 to $124,999
- 17$125,000 to $149,999
- 38$150,000 to $199,999
- 22$200,000 or more

Distribution of owner-occupied house/condo value
![Distribution of owner-occupied house/condo value]()
- 12Less than $50,000
- 98$50,000 to $99,999
- 102$100,000 to $149,999
- 48$150,000 to $199,999
- 25$200,000 to $249,999
- 35$250,000 to $299,999
- 25$400,000 to $499,999
- 14$1,000,000 or more

Distribution of rent paid by renters
![Distribution of rent paid by renters]()
- 41$100 to $199
- 26$400 to $499
- 19$600 to $699
- 11$700 to $799
- 39$800 to $899
- 69$900 to $999
- 175$1,000 to $1,249
- 59$1,250 to $1,499
- 10$1,500 to $1,999
- 23$2,000 or more

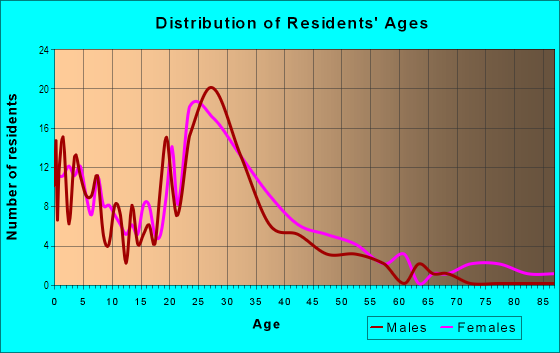
| Males: | 365 |
| Females: | 725 |
Males:
| This neighborhood: | 31.7 years |
| Whole city: | 34.1 years |
| This neighborhood: | 31.0 years |
| Whole city: | 37.3 years |
Average household size:
| 33rd Street Industrial: | 2.8 people |
| Orlando: | 2.3 people |
Percentage of family households:
| 33rd Street Industrial: | 58.9% |
| Orlando: | 43.6% |
| Here: | 34.3% |
| Orlando: | 35.3% |
Percentage of married-couple families with children (among all households):
| 33rd Street Industrial: | 16.3% |
| Orlando: | 25.1% |
Percentage of single-mother households (among all households):
| 33rd Street Industrial: | 14.7% |
| Orlando: | 15.2% |
Percentage of never married males 15 years old and over:
Percentage of never married females 15 years old and over:
| 33rd Street Industrial: | 11.5% |
| Orlando: | 21.6% |
Percentage of never married females 15 years old and over:
| 33rd Street Industrial: | 36.4% |
| city: | 19.5% |
Percentage of people that speak English not well or not at all:
| 33rd Street Industrial: | 53.0% |
| Orlando: | 8.8% |
Percentage of people born in this state:
Percentage of people born in another U.S. state:
Percentage of native residents but born outside the U.S.:
Percentage of foreign born residents:
| Here: | 28.8% |
| Orlando: | 34.9% |
Percentage of people born in another U.S. state:
| 33rd Street Industrial: | 18.0% |
| Orlando: | 33.1% |
Percentage of native residents but born outside the U.S.:
| Here: | 6.5% |
| city: | 8.5% |
Percentage of foreign born residents:
| Here: | 46.7% |
| Orlando: | 23.6% |
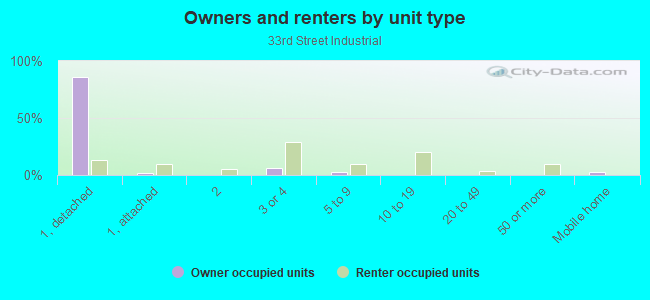
Owner-occupied
Renter-occupied

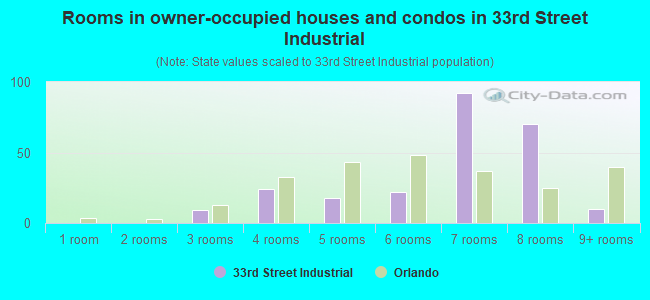
- Rooms in owner-occupied houses and condos in 33rd Street Industrial
- 01 room
- 02 rooms
- 93 rooms
- 244 rooms
- 185 rooms
- 226 rooms
- 927 rooms
- 708 rooms
- 109+ rooms
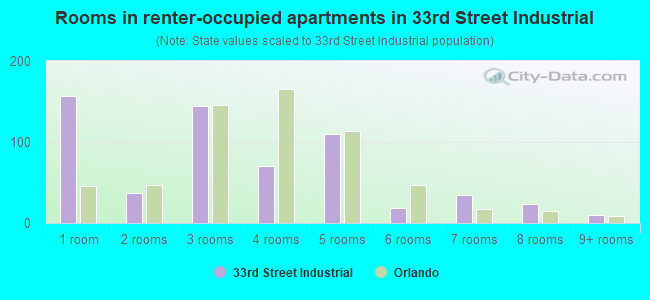
- Rooms in renter-occupied apartments in 33rd Street Industrial
- 1571 room
- 372 rooms
- 1453 rooms
- 704 rooms
- 1105 rooms
- 196 rooms
- 347 rooms
- 238 rooms
- 109+ rooms
Owner-occupied
Renter-occupied
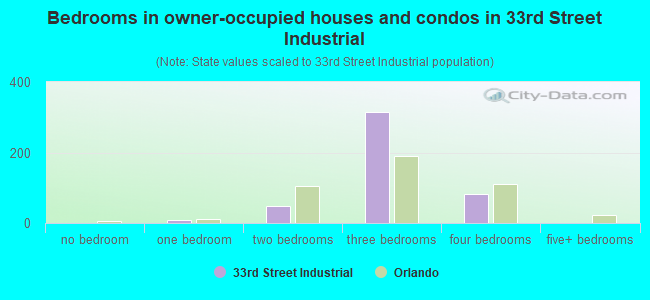
- Bedrooms in owner-occupied houses and condos in 33rd Street Industrial
- 0no bedroom
- 91 bedroom
- 472 bedrooms
- 3143 bedrooms
- 814 bedrooms
- 05+ bedrooms
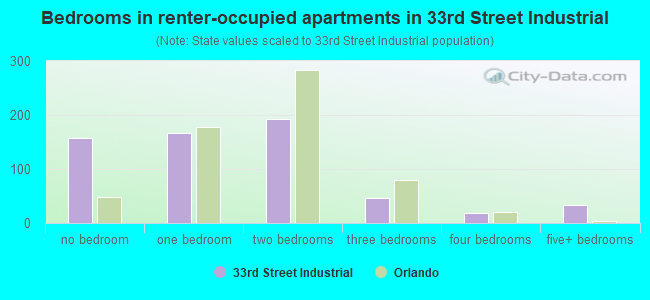
- Bedrooms in renter-occupied apartments in 33rd Street Industrial
- 157no bedroom
- 1661 bedroom
- 1932 bedrooms
- 473 bedrooms
- 194 bedrooms
- 335+ bedrooms
Average number of cars or other vehicles available in houses/condos:
Average number of cars or other vehicles available in apartments:
| This neighborhood: | 1.3 |
| Orlando: | 1.9 |
Average number of cars or other vehicles available in apartments:
| Here: | 1.2 |
| city: | 1.3 |
Percentage of units with a mortgage:
| 33rd Street Industrial: | 57.6% |
| Orlando: | 71.0% |
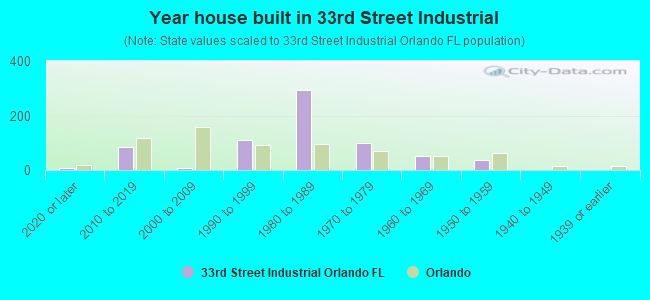
- Year house built in 33rd Street Industrial
- 82020 or later
- 852010 to 2019
- 72000 to 2009
- 1091990 to 1999
- 2951980 to 1989
- 981970 to 1979
- 521960 to 1969
- 371950 to 1959
- 01940 to 1949
- 01939 or earlier
City-data.com crime index for city in 2020 (higher means more crime):
| City: | 423.0 |
| U.S. average: | 219.5 |
Travel time to work (commute)
![Travel time to work (commute)]()
- 16Less than 5 minutes
- 395 to 9 minutes
- 21610 to 14 minutes
- 21615 to 19 minutes
- 28820 to 24 minutes
- 54225 to 29 minutes
- 38130 to 34 minutes
- 935 to 39 minutes
- 3440 to 44 minutes
- 3845 to 59 minutes
- 8560 to 89 minutes
- 12790 or more minutes

Means of transportation to work
![Means of transportation to work]()
- 57.1%292Drove a car alone
- 20.9%107Carpooled
- 8.4%43Bus
- 1.6%8Taxi
- 0.6%3Motorcycle
- 3.7%19Bicycle
- 8.8%45Walked
- 4.1%21Other means
- 4.9%25Worked at home

Time leaving home to go to work
![Time leaving home to go to work]()
- 39912:00 a.m. to 4:59 a.m.
- 405:00 a.m. to 5:29 a.m.
- 1025:30 a.m. to 5:59 a.m.
- 1076:00 a.m. to 6:29 a.m.
- 2406:30 a.m. to 6:59 a.m.
- 2877:00 a.m. to 7:29 a.m.
- 887:30 a.m. to 7:59 a.m.
- 1328:00 a.m. to 8:29 a.m.
- 1168:30 a.m. to 8:59 a.m.
- 1389:00 a.m. to 9:59 a.m.
- 910:00 a.m. to 10:59 a.m.
- 911:00 a.m. to 11:59 a.m.
- 17012:00 p.m. to 3:59 p.m.
- 1894:00 p.m. to 11:59 p.m.

Occupations of males:
- Percentage of males in management occupations (except farmers):
Here: 24.8% city: 13.1%
- Percentage of males in business and financial operations occupations:
Here: 23.7% city: 6.3%
- Percentage of males in computer and mathematical occupations:
Here: 11.7% city: 4.7%
- Percentage of males in architecture and engineering occupations:
Here: 1.1% city: 3.3%
- Percentage of males in arts, design, entertainment, sports, and media occupations:
Here: 27.8% city: 3.3%
- Percentage of males in healthcare practitioners and technical occupations:
Here: 5.6% city: 4.4%
- Percentage of males in service occupations:
Here: 11.8% city: 15.4%
- Percentage of males in sales and office occupations:
Here: 16.9% city: 18.7%
- Percentage of males in construction, extraction, and maintenance occupations:
Here: 36.2% city: 7.6%
- Percentage of males in production occupations:
Here: 2.1% city: 2.7%
- Percentage of males in transportation occupations:
Here: 7.1% city: 7.4%
- Percentage of males in material moving occupations:
Here: 44.5% city: 4.9%
Occupations of females:
- Percentage of females in management occupations (except farmers):
Here: 7.8% city: 10.7%
- Percentage of females in business and financial operations occupations:
Here: 2.5% city: 7.6%
- Percentage of females in architecture and engineering occupations:
Here: 4.4% city: 1.1%
- Percentage of females in community and social services occupations:
Here: 2.3% city: 2.0%
- Percentage of females in legal occupations:
Here: 1.1% city: 2.0%
- Percentage of females in education, training, and library occupations:
Here: 1.2% city: 6.5%
- Percentage of females in arts, design, entertainment, sports, and media occupations:
Here: 5.4% city: 2.5%
- Percentage of females in healthcare practitioners and technical occupations:
Here: 18.7% city: 8.2%
- Percentage of females in service occupations:
Here: 27.7% city: 20.2%
- Percentage of females in sales and office occupations:
Here: 35.0% city: 28.3%
- Percentage of females in farming, fishing, and forestry occupations:
Here: 4.2% city: 0.2%
- Percentage of females in production occupations:
Here: 1.7% city: 1.9%
- Percentage of females in transportation occupations:
Here: 12.4% city: 2.9%
- Percentage of females in material moving occupations:
Here: 3.0% city: 2.5%
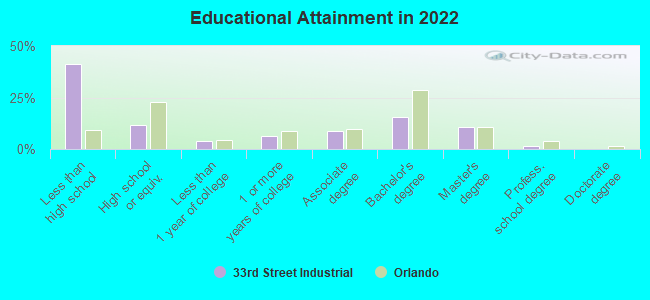
Education in this neighborhood (subdivision or community):
- Percentage of people 3 years and older in K-12 schools:
33rd Street Industrial: 21.6% Orlando: 14.9%
- Percentage of people 3 years and older in undergraduate colleges:
33rd Street Industrial: 7.2% Orlando: 5.5%
- Percentage of people 3 years and older in grad. or professional schools:
33rd Street Industrial: 7.4% Orlando: 1.6%
- Percentage of students K-12 enrolled in private schools:
33rd Street Industrial: 13.9% Orlando: 13.8%
Percentage of population below poverty level:
| 33rd Street Industrial: | 20.9% |
| Orlando: | 14.2% |
Median year owner moved in (as recorded in 2022):
Median year renter moved in (as recorded in 2022):
| 33rd Street Industrial: | 2006 |
| Orlando: | 2015 |
Median year renter moved in (as recorded in 2022):
| 33rd Street Industrial: | 2015 |
| Orlando: | 2020 |
Percentage of married-couple families with both working:
| 33rd Street Industrial: | 51.9% |
| Orlando: | 64.1% |
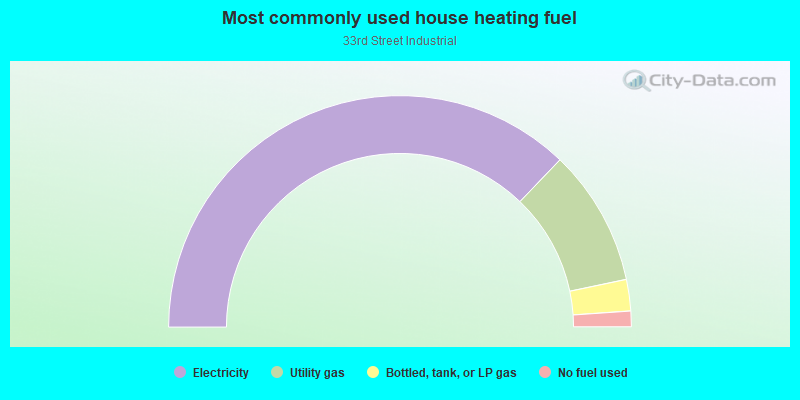
- 74.3%Electricity
- 19.1%Utility gas
- 4.4%Bottled, tank, or LP gas
- 2.2%No fuel used
Limited-access highways (interstate or state) in this neighborhood:
Roads and streets:
L B McLeod Rd
Length: 1.26 miles
Directions: E-W, SW-NE
Address range: 4000 to 4755
Directions: E-W, SW-NE
Address range: 4000 to 4755
34th St
Length: 1.05 miles
Directions: E-W, SE-NW
Address range: 3500 to 4699
Directions: E-W, SE-NW
Address range: 3500 to 4699
35th St
Length: 0.87 miles
Directions: E-W, SE-NW, SW-NE
Address range: 3300 to 4699
Directions: E-W, SE-NW, SW-NE
Address range: 3300 to 4699
36th St
Length: 0.65 miles
Directions: E-W, SW-NE
Address range: 4343 to 4799
Directions: E-W, SW-NE
Address range: 4343 to 4799
Vineland Rd
Length: 0.54 miles
Directions: N-S, SW-NE
Address range: 3300 to 3937
Directions: N-S, SW-NE
Address range: 3300 to 3937
Maggie Blvd
Length: 0.36 miles
Directions: N-S, SE-NW
Address range: 3300 to 3599
Directions: N-S, SE-NW
Address range: 3300 to 3599
St Valentine Way
Length: 0.30 miles
Directions: E-W, SW-NE
Address range: 3400 to 3865
Directions: E-W, SW-NE
Address range: 3400 to 3865
Crossroads Ct
Length: 0.30 miles
Directions: E-W, N-S, SE-NW, SW-NE
Address range: 4270 to 4466
Directions: E-W, N-S, SE-NW, SW-NE
Address range: 4270 to 4466
Bartlett Blvd
Length: 0.20 miles
Direction: N-S
Address range: 3300 to 3498
Direction: N-S
Address range: 3300 to 3498
Rio Vista Ave
Length: 0.12 miles
Direction: N-S
Address range: 3500 to 3799
Direction: N-S
Address range: 3500 to 3799
37th St
Length: 0.08 miles
Directions: E-W, N-S, SW-NE
Directions: E-W, N-S, SW-NE
Bruton Blvd
Length: 0.06 miles
Direction: N-S
Address range: 3301 to 3358
Direction: N-S
Address range: 3301 to 3358
SW Sewage Treatment Plant
Length: 0.06 miles
Direction: N-S
Direction: N-S