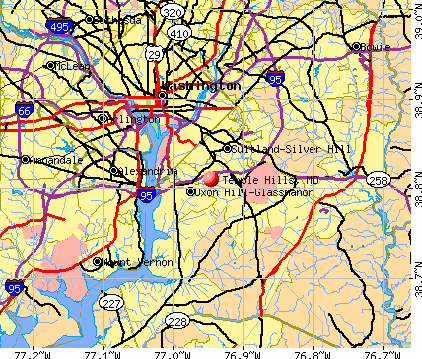
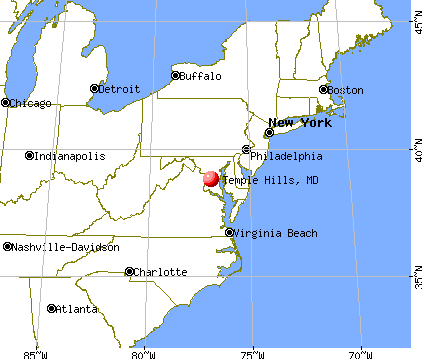
Temple Hills, Maryland
Submit your own pictures of this place and show them to the world
- OSM Map
- General Map
- Google Map
- MSN Map
Population change since 2000: +0.8%
| Males: 3,433 | |
| Females: 4,419 |
| Median resident age: | 37.7 years |
| Maryland median age: | 39.7 years |
Zip codes: 20748.
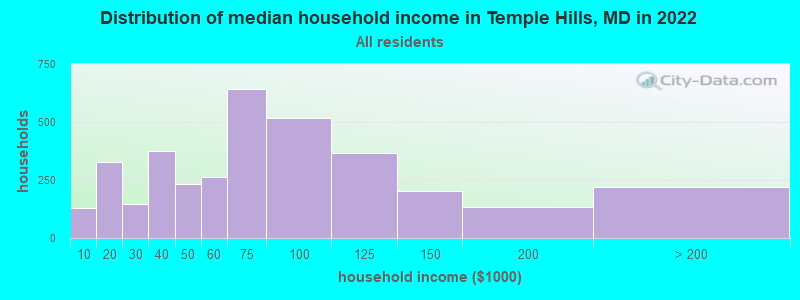
| Temple Hills: | $65,601 |
| MD: | $94,991 |
Estimated per capita income in 2022: $34,706 (it was $21,939 in 2000)
Temple Hills CDP income, earnings, and wages data
Estimated median house or condo value in 2022: $343,431 (it was $136,800 in 2000)
| Temple Hills: | $343,431 |
| MD: | $398,100 |
Mean prices in 2022: all housing units: $305,744; detached houses: $353,375; townhouses or other attached units: $290,669; in 5-or-more-unit structures: $162,440
Median gross rent in 2022: $1,553.
(12.7% for Black residents, 1.4% for Hispanic or Latino residents, 3.1% for two or more races residents)
Detailed information about poverty and poor residents in Temple Hills, MD

Compare current foreclosures in Temple Hills, MD:
| Photo | Address | Area | Beds / Baths | Price | Details |
|---|---|---|---|---|---|

|
#1
Henson Ln
Temple Hills, MD 20748
|
1,566 sq. feet
|
2 baths 3 beds |
$300,000
|
show details |

|
#2
Portal Ave
Temple Hills, MD 20748
|
1,315 sq. feet
|
2 baths 3 beds |
show details | |

|
#3
28th Pkwy
Temple Hills, MD 20748
|
1,000 sq. feet
|
1 baths 3 beds |
show details | |

|
#4
Lansing Dr
Temple Hills, MD 20748
|
1,344 sq. feet
|
3 baths - beds |
show details | |

|
#5
Keith St
Temple Hills, MD 20748
|
1,260 sq. feet
|
2 baths - beds |
show details | |

|
#6
Culver St
Temple Hills, MD 20748
|
1,040 sq. feet
|
1 baths - beds |
show details | |

|
#7
Brinkley Rd
Temple Hills, MD 20748
|
1,204 sq. feet
|
1 baths - beds |
show details | |

|
#8
Danville Dr
Temple Hills, MD 20748
|
1,652 sq. feet
|
3 baths - beds |
show details | |

|
#9
Lansing Dr
Temple Hills, MD 20748
|
2,200 sq. feet
|
3 baths - beds |
show details | |

|
#10
Dawn Ln
Temple Hills, MD 20748
|
1,452 sq. feet
|
3 baths - beds |
show details |
| Photo | Address | Area | Beds / Baths | Price | Details |
|---|---|---|---|---|---|

|
#11
Frazier Ter
Temple Hills, MD 20748
|
1,590 sq. feet
|
4 baths - beds |
show details | |

|
#12
Oxon Run Dr
Temple Hills, MD 20748
|
1,191 sq. feet
|
2 baths - beds |
show details | |

|
#13
Sharon Rd
Temple Hills, MD 20748
|
1,232 sq. feet
|
3 baths - beds |
show details | |

|
#14
23rd Pl
Temple Hills, MD 20748
|
1,260 sq. feet
|
2 baths - beds |
show details | |

|
#15
Keating St
Temple Hills, MD 20748
|
1,260 sq. feet
|
2 baths - beds |
show details | |

|
#16
Oxon Run Ct
Temple Hills, MD 20748
|
988 sq. feet
|
2 baths - beds |
show details | |

|
#17
Colon Ter
Temple Hills, MD 20748
|
1,026 sq. feet
|
2 baths - beds |
show details | |

|
#18
Bushey Dr
Temple Hills, MD 20748
|
1,620 sq. feet
|
3 baths - beds |
show details | |

|
#19
Afton St
Temple Hills, MD 20748
|
988 sq. feet
|
2 baths - beds |
show details | |

|
#20
Claridge Rd
Temple Hills, MD 20748
|
1,975 sq. feet
|
3 baths - beds |
show details |
| Photo | Address | Area | Beds / Baths | Price | Details |
|---|---|---|---|---|---|

|
#21
Akron St
Temple Hills, MD 20748
|
1,040 sq. feet
|
1 baths - beds |
show details | |

|
#22
25th Pl
Temple Hills, MD 20748
|
1,191 sq. feet
|
1 baths - beds |
show details | |

|
#23
Southgate Dr
Temple Hills, MD 20748
|
1,128 sq. feet
|
3 baths - beds |
show details | |

|
#24
19th Ave
Temple Hills, MD 20748
|
1,392 sq. feet
|
2 baths - beds |
show details | |

|
#25
19th Ave
Temple Hills, MD 20748
|
1,392 sq. feet
|
2 baths - beds |
show details | |

|
#26
Hope Dr
Temple Hills, MD 20748
|
1,596 sq. feet
|
3 baths - beds |
show details | |

|
#27
Larwin Dr
Temple Hills, MD 20748
|
1,215 sq. feet
|
3 baths - beds |
show details | |

|
#28
Kenton Pl
Temple Hills, MD 20748
|
1,260 sq. feet
|
1 baths - beds |
show details | |

|
#29
Danville Dr
Temple Hills, MD 20748
|
1,356 sq. feet
|
2 baths - beds |
show details | |

|
#30
Summit Dr
Temple Hills, MD 20748
|
1,642 sq. feet
|
2 baths - beds |
show details |
| Photo | Address | Area | Beds / Baths | Price | Details |
|---|---|---|---|---|---|

|
#31
Canterbury Way
Temple Hills, MD 20748
|
1,296 sq. feet
|
2 baths - beds |
show details | |

|
#32
Gaither St
Temple Hills, MD 20748
|
1,175 sq. feet
|
1 baths - beds |
show details | |

|
#33
Gaither St
Temple Hills, MD 20748
|
1,315 sq. feet
|
2 baths - beds |
show details | |

|
#34
Colebrooke Dr
Temple Hills, MD 20748
|
1,144 sq. feet
|
1 baths - beds |
show details | |

|
#35
Avon Ct
Temple Hills, MD 20748
|
1,296 sq. feet
|
2 baths - beds |
show details | |

|
#36
Fisher Rd
Temple Hills, MD 20748
|
1,275 sq. feet
|
2 baths - beds |
show details | |

|
#37
Colonial Dr
Temple Hills, MD 20748
|
1,593 sq. feet
|
3 baths - beds |
show details | |

|
#38
Lyons St
Temple Hills, MD 20748
|
1,156 sq. feet
|
1 baths - beds |
show details | |

|
#39
Lyons St
Temple Hills, MD 20748
|
1,156 sq. feet
|
1 baths - beds |
show details | |

|
#40
Huntley Square Dr Apt B2
Temple Hills, MD 20748
|
1,056 sq. feet
|
- baths - beds |
show details |
| Photo | Address | Area | Beds / Baths | Price | Details |
|---|---|---|---|---|---|

|
#41
Brinkley Rd Apt 204
Temple Hills, MD 20748
|
612 sq. feet
|
- baths - beds |
show details | |

|
#42
Westchester Ct
Temple Hills, MD 20748
|
2,184 sq. feet
|
3 baths - beds |
show details | |

|
#43
Lansing Dr
Temple Hills, MD 20748
|
2,200 sq. feet
|
2 baths - beds |
show details | |

|
#44
Middleton Ln
Temple Hills, MD 20748
|
1,344 sq. feet
|
3 baths - beds |
show details | |

|
#45
Oxon Run Ct
Temple Hills, MD 20748
|
988 sq. feet
|
1 baths - beds |
show details | |

|
#46
Catskill St
Temple Hills, MD 20748
|
1,320 sq. feet
|
2 baths - beds |
show details | |

|
#47
27th Ave
Temple Hills, MD 20748
|
1,156 sq. feet
|
1 baths - beds |
show details | |

|
#48
Aley Rd
Temple Hills, MD 20748
|
1,125 sq. feet
|
2 baths - beds |
show details | |

|
#49
Orme Dr
Temple Hills, MD 20748
|
1,235 sq. feet
|
2 baths - beds |
show details | |

|
Check over 1 million property listings on Foreclosure.com!
|
browse all offers | |||


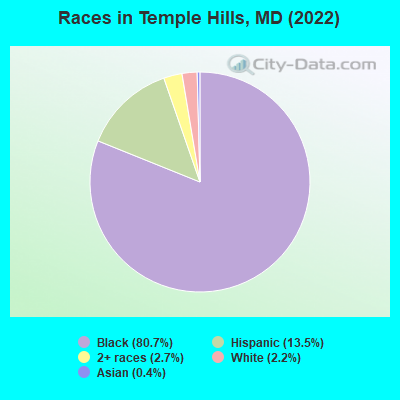
- 6,63280.7%Black alone
- 1,10613.5%Hispanic
- 2252.7%Two or more races
- 1792.2%White alone
- 300.4%Asian alone
Races in Temple Hills detailed stats: ancestries, foreign born residents, place of birth
According to our research of Maryland and other state lists, there were 79 registered sex offenders living in Temple Hills, Maryland as of June 12, 2024.
The ratio of all residents to sex offenders in Temple Hills is 101 to 1.
 Recent articles from our blog. Our writers, many of them Ph.D. graduates or candidates, create easy-to-read articles on a wide variety of topics.


Latest news from Temple Hills, MD collected exclusively by city-data.com from local newspapers, TV, and radio stations
Ancestries: American (2.5%), Irish (2.4%).
Current Local Time: EST time zone
Elevation: 250 feet
Land area: 1.35 square miles.
Population density: 5,800 people per square mile (average).
780 residents are foreign born (6.9% Latin America, 1.1% Africa).
| This place: | 9.5% |
| Maryland: | 15.7% |
Median real estate property taxes paid for housing units with mortgages in 2022: $3,838 (1.1%)
Median real estate property taxes paid for housing units with no mortgage in 2022: $3,039 (0.9%)
Nearest city with pop. 50,000+: Alexandria, VA  (6.7 miles , pop. 128,283).
Nearest city with pop. 200,000+: Washington, DC (8.0 miles , pop. 572,059).
Nearest city with pop. 1,000,000+: Philadelphia, PA (126.6 miles , pop. 1,517,550).
Nearest cities:
), ), ), ), ), ), ), )Latitude: 38.81 N, Longitude: 76.95 W
Daytime population change due to commuting: -2,440 (-29.7%)
Workers who live and work in this place: 626 (15.9%)
Property values in Temple Hills, MD
| Here: | 2.1% |
| Maryland: | 2.0% |
- Public administration (20.2%)
- Health care (8.3%)
- Educational services (7.3%)
- Professional, scientific, technical services (6.7%)
- Administrative & support & waste management services (5.5%)
- Construction (5.5%)
- Accommodation & food services (4.6%)
- Public administration (16.1%)
- Construction (12.2%)
- Accommodation & food services (6.6%)
- Administrative & support & waste management services (6.0%)
- Health care (5.1%)
- Professional, scientific, technical services (4.6%)
- Furniture & home furnishings, household appliance stores (4.0%)
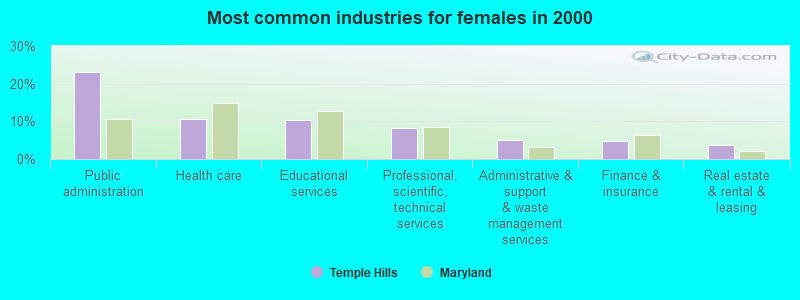
- Public administration (23.2%)
- Health care (10.6%)
- Educational services (10.4%)
- Professional, scientific, technical services (8.2%)
- Administrative & support & waste management services (5.1%)
- Finance & insurance (4.8%)
- Real estate & rental & leasing (3.7%)
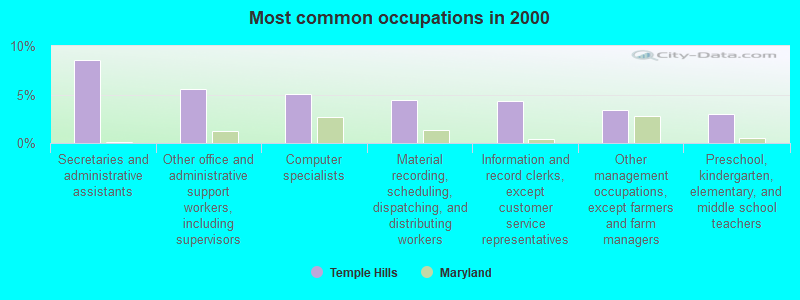
- Secretaries and administrative assistants (8.6%)
- Other office and administrative support workers, including supervisors (5.5%)
- Computer specialists (5.0%)
- Material recording, scheduling, dispatching, and distributing workers (4.4%)
- Information and record clerks, except customer service representatives (4.4%)
- Other management occupations, except farmers and farm managers (3.4%)
- Preschool, kindergarten, elementary, and middle school teachers (3.0%)
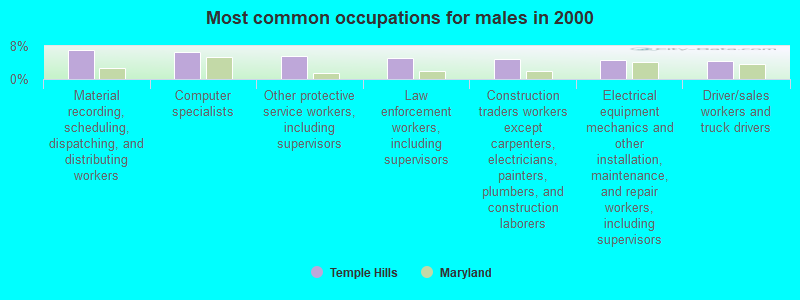
- Material recording, scheduling, dispatching, and distributing workers (7.0%)
- Computer specialists (6.6%)
- Other protective service workers, including supervisors (5.5%)
- Law enforcement workers, including supervisors (5.1%)
- Construction traders workers except carpenters, electricians, painters, plumbers, and construction laborers (4.9%)
- Electrical equipment mechanics and other installation, maintenance, and repair workers, including supervisors (4.5%)
- Driver/sales workers and truck drivers (4.5%)
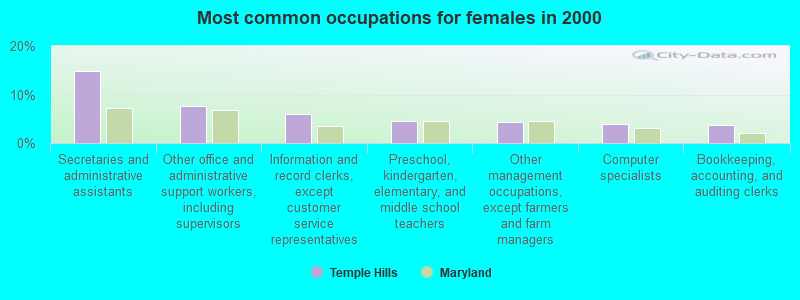
- Secretaries and administrative assistants (14.8%)
- Other office and administrative support workers, including supervisors (7.6%)
- Information and record clerks, except customer service representatives (6.0%)
- Preschool, kindergarten, elementary, and middle school teachers (4.5%)
- Other management occupations, except farmers and farm managers (4.3%)
- Computer specialists (3.9%)
- Bookkeeping, accounting, and auditing clerks (3.6%)
Average climate in Temple Hills, Maryland
Based on data reported by over 4,000 weather stations


(lower is better)
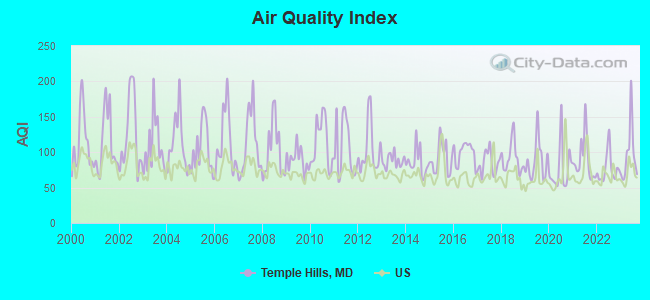
Air Quality Index (AQI) level in 2023 was 96.6. This is worse than average.
| City: | 96.6 |
| U.S.: | 72.6 |
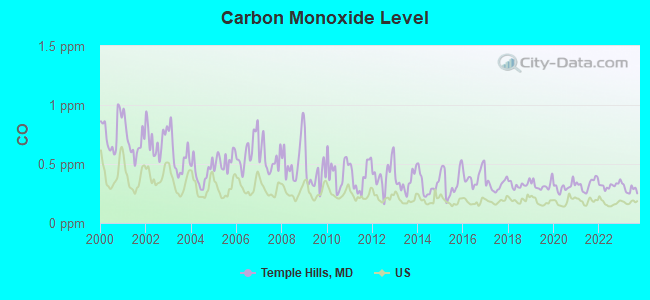
Carbon Monoxide (CO) [ppm] level in 2023 was 0.287. This is about average. Closest monitor was 2.9 miles away from the city center.
| City: | 0.287 |
| U.S.: | 0.251 |
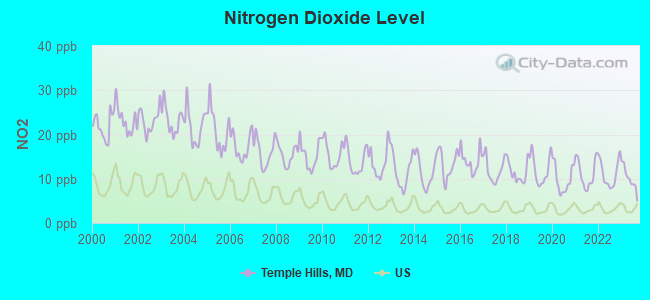
Nitrogen Dioxide (NO2) [ppb] level in 2023 was 10.1. This is significantly worse than average. Closest monitor was 2.5 miles away from the city center.
| City: | 10.1 |
| U.S.: | 5.1 |
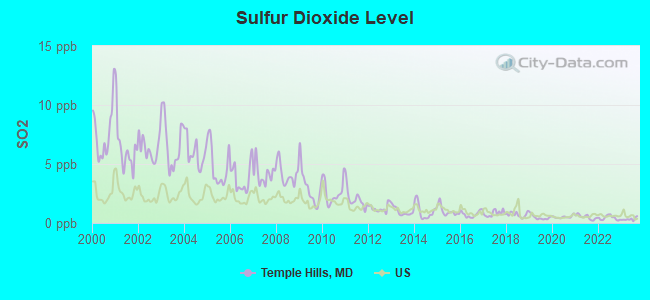
Sulfur Dioxide (SO2) [ppb] level in 2023 was 0.331. This is significantly better than average. Closest monitor was 2.5 miles away from the city center.
| City: | 0.331 |
| U.S.: | 1.515 |
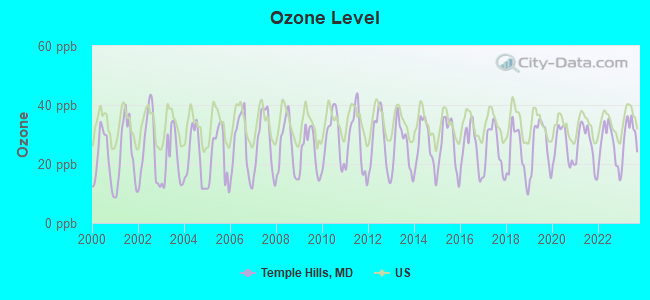
Ozone [ppb] level in 2023 was 29.9. This is about average. Closest monitor was 2.9 miles away from the city center.
| City: | 29.9 |
| U.S.: | 33.3 |
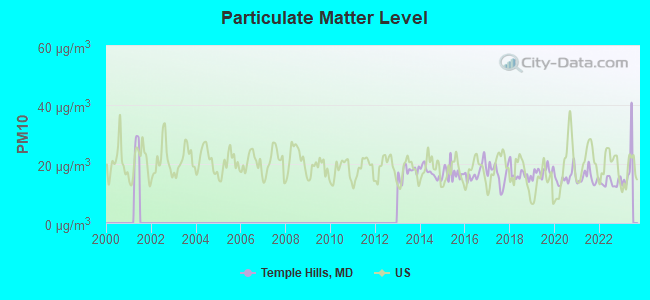
Particulate Matter (PM10) [µg/m3] level in 2022 was 13.9. This is better than average. Closest monitor was 2.9 miles away from the city center.
| City: | 13.9 |
| U.S.: | 19.2 |
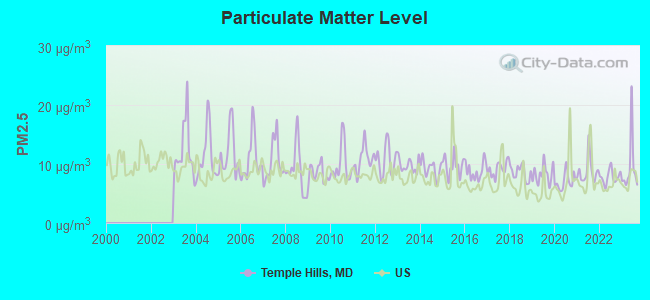
Particulate Matter (PM2.5) [µg/m3] level in 2023 was 9.34. This is about average. Closest monitor was 2.9 miles away from the city center.
| City: | 9.34 |
| U.S.: | 8.11 |
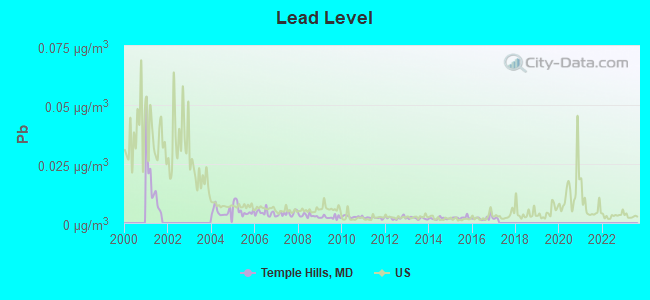
Lead (Pb) [µg/m3] level in 2016 was 0.00212. This is significantly better than average. Closest monitor was 2.7 miles away from the city center.
| City: | 0.00212 |
| U.S.: | 0.00931 |
Tornado activity:
Temple Hills-area historical tornado activity is slightly above Maryland state average. It is 8% greater than the overall U.S. average.
On 4/28/2002, a category F4 (max. wind speeds 207-260 mph) tornado 22.0 miles away from the Temple Hills place center killed 3 people and injured 122 people and caused $124 million in damages.
On 9/5/1979, a category F3 (max. wind speeds 158-206 mph) tornado 7.5 miles away from the place center killed one person and injured 6 people and caused between $500,000 and $5,000,000 in damages.
Earthquake activity:
Temple Hills-area historical earthquake activity is significantly above Maryland state average. It is 57% smaller than the overall U.S. average.On 8/23/2011 at 17:51:04, a magnitude 5.8 (5.8 MW, Depth: 3.7 mi, Class: Moderate, Intensity: VI - VII) earthquake occurred 82.3 miles away from Temple Hills center
On 8/25/2011 at 05:07:52, a magnitude 4.5 (4.5 ML, Depth: 4.2 mi, Class: Light, Intensity: IV - V) earthquake occurred 81.4 miles away from Temple Hills center
On 1/16/1994 at 01:49:16, a magnitude 4.6 (4.6 MB, 4.6 LG, Depth: 3.1 mi) earthquake occurred 115.7 miles away from Temple Hills center
On 12/9/2003 at 20:59:18, a magnitude 4.5 (4.5 ML, Depth: 6.2 mi) earthquake occurred 95.2 miles away from Temple Hills center
On 12/9/2003 at 20:59:14, a magnitude 4.5 (4.5 MB, 4.5 LG) earthquake occurred 99.3 miles away from the city center
On 9/25/1998 at 19:52:52, a magnitude 5.2 (4.8 MB, 4.3 MS, 5.2 LG, 4.5 MW, Depth: 3.1 mi) earthquake occurred 260.0 miles away from the city center
Magnitude types: regional Lg-wave magnitude (LG), body-wave magnitude (MB), local magnitude (ML), surface-wave magnitude (MS), moment magnitude (MW)
Natural disasters:
The number of natural disasters in Prince George's County (16) is near the US average (15).Major Disasters (Presidential) Declared: 11
Emergencies Declared: 5
Causes of natural disasters: Hurricanes: 5, Winter Storms: 5, Snowstorms: 3, Floods: 2, Storms: 2, Tropical Storms: 2, Blizzard: 1, Heavy Rain: 1, Ice Storm: 1, Snowfall: 1 (Note: some incidents may be assigned to more than one category).

Hospitals and medical centers in Temple Hills:
Other hospitals and medical centers near Temple Hills:
- RIVERTOWNE DIALYSIS CENTER (Dialysis Facility, about 3 miles away; OXON HILL, MD)
- QUALITY CARE DIALYSIS - SOUTHERN MARYLAND (Dialysis Facility, about 3 miles away; CAMP SPRINGS, MD)
- GSEH HOME HEALTH (Home Health Center, about 3 miles away; WASHINGTON, DC)
- UNITED MEDICAL CENTER Acute Care Hospitals (about 3 miles away; WASHINGTON, DC)
- GREATER SOUTHEAST COMMUNITY DIALYSIS CENTER (Dialysis Facility, about 3 miles away; WASHINGTON, DC)
- CAROLYN BOONE LEWIS HEALTH CARE CENTER (Nursing Home, about 3 miles away; WASHINGTON, DC)
- RENAL ADVANTAGE INC - OXON HILL (Dialysis Facility, about 3 miles away; OXON HILL, MD)
Amtrak stations near Temple Hills:
- 7 miles: ALEXANDRIA (110 CALLAHAN DR.) . Services: ticket office, partially wheelchair accessible, enclosed waiting area, public restrooms, public payphones, vending machines, ATM, free short-term parking, free long-term parking, call for car rental service, call for taxi service, public transit connection.
- 7 miles: WASHINGTON (50 MASSACHUSETTS AVE. N.E.) . Services: ticket office, fully wheelchair accessible, enclosed waiting area, public restrooms, public payphones, full-service food facilities and snack bar, ATM, paid short-term parking, paid long-term parking, car rental agency, taxi stand, public transit connection.
- 11 miles: NEW CARROLLTON (4300 GARDEN CITY DR.) . Services: ticket office, fully wheelchair accessible, enclosed waiting area, public restrooms, public payphones, snack bar, ATM, paid short-term parking, paid long-term parking, call for car rental service, taxi stand, public transit connection.
Colleges/universities with over 2000 students nearest to Temple Hills:
- Strayer University-Maryland (about 2 miles; Suitland, MD; Full-time enrollment: 2,748)
- Strayer University-Global Region (about 9 miles; Washington, DC; FT enrollment: 2,613)
- George Washington University (about 9 miles; Washington, DC; FT enrollment: 18,928)
- Prince George's Community College (about 9 miles; Largo, MD; FT enrollment: 8,537)
- Howard University (about 9 miles; Washington, DC; FT enrollment: 7,838)
- Catholic University of America (about 10 miles; Washington, DC; FT enrollment: 5,365)
- Strayer University-Virginia (about 10 miles; Arlington, VA; FT enrollment: 7,005)
Public high schools in Temple Hills:
- CROSSLAND HIGH (Location: 6901 TEMPLE HILL ROAD, Grades: 9-12)
- CROSSLAND EVENING/SATURDAY HIGH (Location: 6901 TEMPLE HILL RD, Grades: 9-12)
Private high schools in Temple Hills:
Public elementary/middle schools in Temple Hills:
- ALLENWOOD ELEMENTARY (Location: 6300 HARLEY LN, Grades: PK-6)
- HILLCREST HEIGHTS ELEMENTARY (Location: 4305 22ND PLACE, Grades: PK-5)
- OVERLOOK ELEMENTARY (Location: 3298 CURTIS DR, Grades: PK-5)
- SAMUEL CHASE ELEMENTARY (Location: 5700 FISHER RD, Grades: PK-5)
- BENJAMIN STODDERT MIDDLE (Location: 2501 OLSON ST, Grades: 6-8)
- THURGOOD MARSHALL MIDDLE SCHOOL (Location: 4909 BRINKLEY RD, Grades: 6-8)
- JOHN HANSON FRENCH IMMERSION (Location: 2000 CALLAWAY ST, Grades: KG-8)
- PANORAMA ELEMENTARY (Location: 2002 CALLAWAY ST, Grades: PK-6)
- IMAGINE LINCOLN PUBLIC CHARTER (Location: 4207 NORCROSS STREET, Grades: KG-8, Charter school)
Private elementary/middle schools in Temple Hills:
- FIRM FOUNDATION & FAITH ACADEMY (Students: 67, Location: 2261 OXON RUN DR, Grades: PK-2)
- GENISUS LEARNING CENTER (Students: 33, Location: 5001 SAINT BARNABAS RD, Grades: KG-8)
Points of interest:
Churches in Temple Hills include: Cong Shaare Tikvah (A), Corkran Memorial Methodist Church (B). Display/hide their locations on the map
Tourist attraction: Kiddie Cabaret (Amusement & Theme Parks; 4410 Stamp Rd Suite 200- C).
Hotels: M.C. Ifill's Discount Travel Club (3938 23rd Parkway), Budget Inn (Branch Avenue).
Birthplace of: Julian Peterson - 2005 NFL player (San Francisco 49ers, born: Jul 28, 1978), Augustus Parrish - College football player (Kent State Golden Flashes), Kiel Butler - College basketball player (Mt. St. Marys Mountaineers), Mark Washington (Canadian football) - Football player, Phil Goss - College basketball player (Drexel Dragons), Reggie Berry - College football player (James Madison Dukes).
| This place: | 2.4 people |
| Maryland: | 2.6 people |
| This place: | 57.7% |
| Whole state: | 67.1% |
| This place: | 8.6% |
| Whole state: | 6.4% |
Likely homosexual households (counted as self-reported same-sex unmarried-partner households)
- Lesbian couples: 0.5% of all households
- Gay men: 0.3% of all households
People in group quarters in Temple Hills in 2010:
- 7 people in nursing facilities/skilled-nursing facilities
- 5 people in correctional residential facilities
- 4 people in other noninstitutional facilities
- 3 people in group homes intended for adults
4 people in religious group quarters in 2000
Banks with branches in Temple Hills (2011 data):
- Bank of America, National Association: Woodberry Square Branch at 6966 Temple Hills Road, branch established on 1964/12/19. Info updated 2009/11/18: Bank assets: $1,451,969.3 mil, Deposits: $1,077,176.8 mil, headquarters in Charlotte, NC, positive income, 5782 total offices, Holding Company: Bank Of America Corporation
For population 15 years and over in Temple Hills:
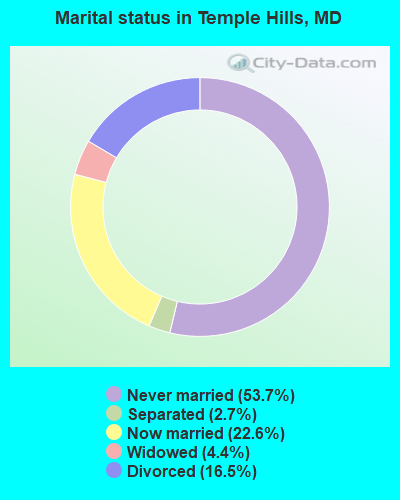
- Never married: 53.7%
- Now married: 22.6%
- Separated: 2.7%
- Widowed: 4.4%
- Divorced: 16.5%
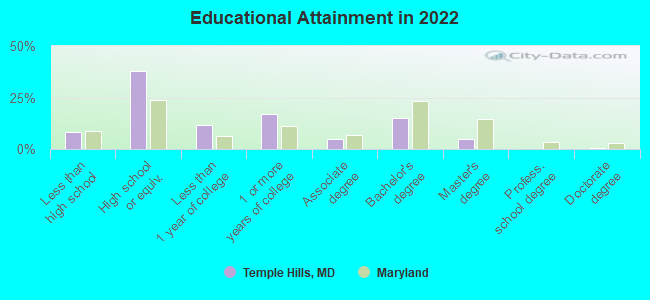
For population 25 years and over in Temple Hills:
- High school or higher: 91.9%
- Bachelor's degree or higher: 19.8%
- Graduate or professional degree: 5.1%
- Unemployed: 3.8%
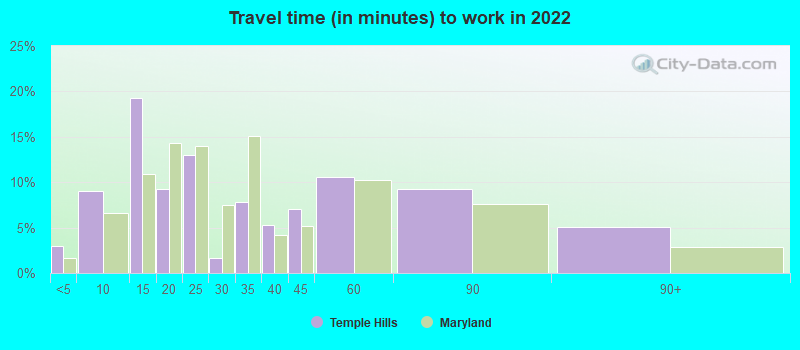
- Mean travel time to work (commute): 29.7 minutes
| Here: | 10.6 |
| Maryland average: | 12.7 |
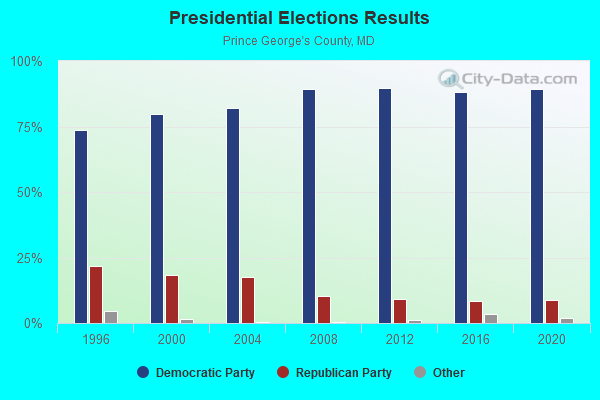
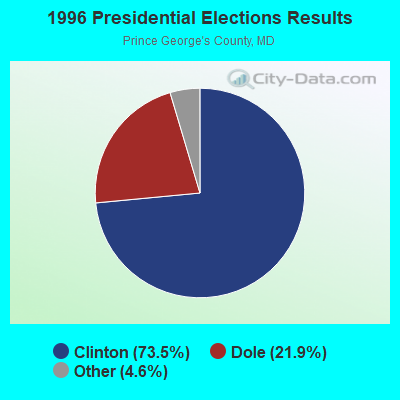
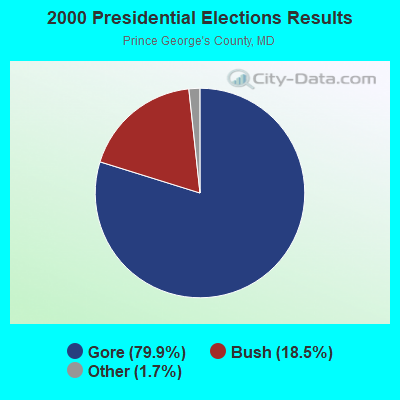
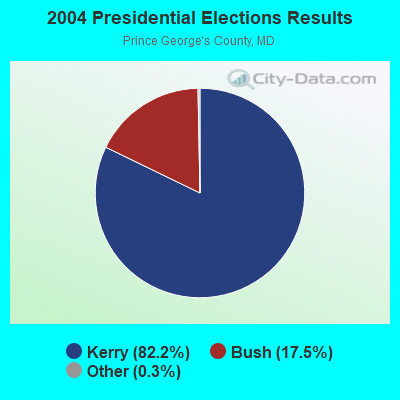
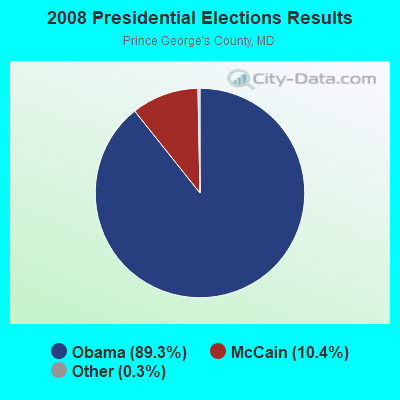

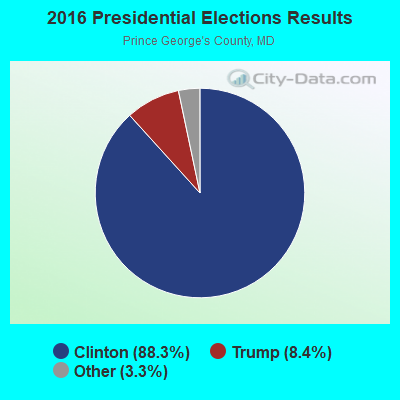
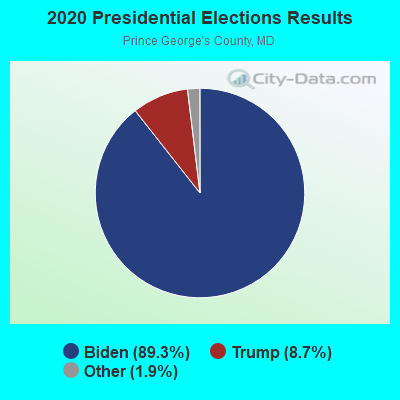
Graphs represent county-level data. Detailed 2008 Election Results
Religion statistics for Temple Hills, MD (based on Prince George's County data)
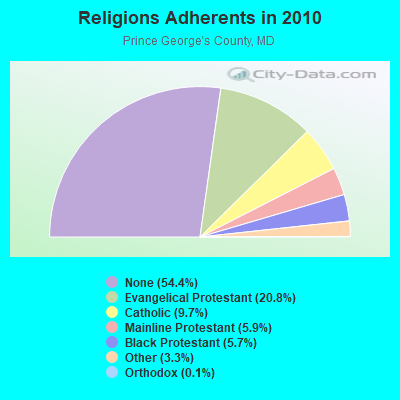
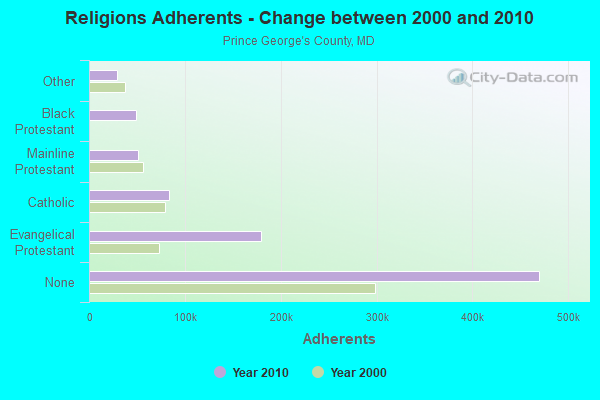
| Religion | Adherents | Congregations |
|---|---|---|
| Evangelical Protestant | 179,374 | 430 |
| Catholic | 83,959 | 35 |
| Mainline Protestant | 51,153 | 156 |
| Black Protestant | 48,984 | 66 |
| Other | 28,743 | 57 |
| Orthodox | 1,218 | 6 |
| None | 469,989 | - |
Food Environment Statistics:
| Here: | 1.70 / 10,000 pop. |
| Maryland: | 1.96 / 10,000 pop. |
| Here: | 0.02 / 10,000 pop. |
| Maryland: | 0.07 / 10,000 pop. |
| Prince George's County: | 1.60 / 10,000 pop. |
| Maryland: | 1.22 / 10,000 pop. |
| This county: | 1.66 / 10,000 pop. |
| Maryland: | 2.05 / 10,000 pop. |
| Prince George's County: | 3.24 / 10,000 pop. |
| State: | 5.40 / 10,000 pop. |
| This county: | 10.5% |
| Maryland: | 9.1% |
| Prince George's County: | 30.7% |
| State: | 26.7% |
| This county: | 16.7% |
| State: | 15.5% |
Health and Nutrition:
| Temple Hills: | 46.9% |
| Maryland: | 50.1% |
| Temple Hills: | 46.2% |
| Maryland: | 47.6% |
| Temple Hills: | 30.2 |
| Maryland: | 28.8 |
| Temple Hills: | 18.3% |
| Maryland: | 20.0% |
| This city: | 13.2% |
| Maryland: | 11.3% |
| Temple Hills: | 6.6 |
| Maryland: | 6.8 |
| Temple Hills: | 36.1% |
| Maryland: | 34.1% |
| Here: | 54.7% |
| Maryland: | 56.5% |
| Here: | 84.6% |
| State: | 80.5% |
More about Health and Nutrition of Temple Hills, MD Residents
6.37% of this county's 2021 resident taxpayers lived in other counties in 2020 ($55,200 average adjusted gross income)
| Here: | 6.37% |
| Maryland average: | 7.42% |
0.04% of residents moved from foreign countries ($466 average AGI)
Prince George's County: 0.04% Maryland average: 0.05%
Top counties from which taxpayers relocated into this county between 2020 and 2021:
| from District of Columbia, DC | |
| from Montgomery County, MD | |
| from Anne Arundel County, MD |
8.15% of this county's 2020 resident taxpayers moved to other counties in 2021 ($59,145 average adjusted gross income)
| Here: | 8.15% |
| Maryland average: | 7.91% |
0.05% of residents moved to foreign countries ($401 average AGI)
Prince George's County: 0.05% Maryland average: 0.04%
Top counties to which taxpayers relocated from this county between 2020 and 2021:
| to Montgomery County, MD | |
| to Anne Arundel County, MD | |
| to District of Columbia, DC |
| Businesses in Temple Hills, MD | ||||
| Name | Count | Name | Count | |
|---|---|---|---|---|
| 7-Eleven | 1 | MasterBrand Cabinets | 5 | |
| AMF Bowling | 1 | Papa John's Pizza | 1 | |
| AutoZone | 1 | Payless | 1 | |
| Cricket Wireless | 2 | Pizza Hut | 2 | |
| Decora Cabinetry | 2 | Quiznos | 1 | |
| Domino's Pizza | 1 | Safeway | 1 | |
| FedEx | 3 | Subway | 1 | |
| GNC | 1 | Taco Bell | 1 | |
| H&R Block | 1 | UPS | 1 | |
| KFC | 1 | Wendy's | 1 | |
Strongest AM radio stations in Temple Hills:
- WPGC (1580 AM; 50 kW; MORNINGSIDE, MD; Owner: INFINITY WPGC(AM), INC.)
- WTEM (980 AM; 50 kW; WASHINGTON, DC; Owner: AMFM RADIO LICENSES, L.L.C.)
- WWGB (1030 AM; daytime; 50 kW; INDIAN HEAD, MD; Owner: GOOD BODY MEDIA, LLC)
- WTOP (1500 AM; 50 kW; WASHINGTON, DC; Owner: BONNEVILLE HOLDING COMPANY)
- WKDL (730 AM; 8 kW; ALEXANDRIA, VA; Owner: MEGA COMMUNICATIONS OF ALEXANDRIA LICENSEE, LLC)
- WUST (1120 AM; daytime; 20 kW; WASHINGTON, DC)
- WBIS (1190 AM; 50 kW; ANNAPOLIS, MD; Owner: NATIONS RADIO, LLC)
- WMET (1150 AM; 50 kW; GAITHERSBURG, MD; Owner: BELTWAY ACQUISITION CORPORATION)
- WCBM (680 AM; 50 kW; BALTIMORE, MD; Owner: WCBM MARYLAND, INC.)
- WABS (780 AM; daytime; 5 kW; ARLINGTON, VA; Owner: SALEM MEDIA OF VIRGINIA, INC.)
- WYCB (1340 AM; 1 kW; WASHINGTON, DC; Owner: RADIO ONE LICENSES, LLC)
- WBAL (1090 AM; 50 kW; BALTIMORE, MD; Owner: HEARST RADIO, INC.)
- WFAX (1220 AM; 5 kW; FALLS CHURCH, VA; Owner: NEWCOMB BROADCASTING CORP.)
Strongest FM radio stations in Temple Hills:
- WPGC-FM (95.5 FM; MORNINGSIDE, MD; Owner: INFINITY BROADCASTING CORPORATION OF MARYLAND)
- WHFS (99.1 FM; ANNAPOLIS, MD; Owner: INFINITY BROADCASTING OPERATIONS, INC.)
- WRQX (107.3 FM; WASHINGTON, DC; Owner: WMAL, INC.)
- WHUR-FM (96.3 FM; WASHINGTON, DC; Owner: THE HOWARD UNIVERSITY)
- WASH (97.1 FM; WASHINGTON, DC; Owner: AMFM RADIO LICENSES, L.L.C.)
- WKYS (93.9 FM; WASHINGTON, DC; Owner: RADIO ONE LICENSES, LLC)
- WWZZ (104.1 FM; WALDORF, MD; Owner: BONNEVILLE HOLDING COMPANY)
- WBIG-FM (100.3 FM; WASHINGTON, DC; Owner: AMFM RADIO LICENSES, L.L.C.)
- WARW (94.7 FM; BETHESDA, MD; Owner: INFINITY BROADCASTING OPERATIONS, INC.)
- WETA (90.9 FM; WASHINGTON, DC; Owner: GREATER WASHINGTON EDUCATIONAL TELECOMMUNICATIONS ASSN.)
- WIHT (99.5 FM; WASHINGTON, DC; Owner: AMFM RADIO LICENSES, L.L.C.)
- WGTS (91.9 FM; TAKOMA PARK, MD; Owner: COLUMBIA UNION COLLEGE BROADCASTING, INC.)
- WCSP-FM (90.1 FM; WASHINGTON, DC; Owner: NATIONAL CABLE SATELLITE CORPORATION)
- WWDC-FM (101.1 FM; WASHINGTON, DC; Owner: AMFM RADIO LICENSES, L.L.C.)
- WAVA (105.1 FM; ARLINGTON, VA; Owner: SALEM MEDIA OF VIRGINIA, INC.)
- WGMS-FM (103.5 FM; WASHINGTON, DC; Owner: BONNEVILLE HOLDING COMPANY)
- WJFK-FM (106.7 FM; MANASSAS, VA; Owner: INFINITY BROADCASTING CORP. OF WASHINGTON, DC)
- WAMU (88.5 FM; WASHINGTON, DC; Owner: THE EXEC. COMM. OF THE BD. OF TRUSTEES OF AMERICAN UNIV.)
- WMMJ (102.3 FM; BETHESDA, MD; Owner: RADIO ONE LICENSES, LLC)
- WJZW (105.9 FM; WOODBRIDGE, VA; Owner: WMAL, INC.)
TV broadcast stations around Temple Hills:
- WJLA-TV (Channel 7; WASHINGTON, DC; Owner: ACC LICENSEE, INC.)
- WUSA (Channel 9; WASHINGTON, DC; Owner: THE DETROIT NEWS, INC.)
- WTTG (Channel 5; WASHINGTON, DC; Owner: FOX TELEVISION STATIONS, INC.)
- WBDC-TV (Channel 50; WASHINGTON, DC; Owner: WBDC BROADCASTING, INC.)
- WHUT-TV (Channel 32; WASHINGTON, DC; Owner: HOWARD UNIVERSITY)
- WRC-TV (Channel 4; WASHINGTON, DC; Owner: NBC SUBSIDIARY (WRC-TV), INC.)
- WETA-TV (Channel 26; WASHINGTON, DC; Owner: THE GREATER WASHINGTON ED TELECOMM. ASSOC)
- WDCA (Channel 20; WASHINGTON, DC; Owner: FOX TELEVISION STATIONS, INC.)
- WIAV-LP (Channel 58; WASHINGTON, DC; Owner: ASIAVISION, INC.)
- WNVC (Channel 56; FAIRFAX, VA; Owner: COMMONWEALTH PUBLIC BROADCASTING CORPORATION)
- W28BY (Channel 63; BALTIMORE, MD; Owner: INFORMATION SUPER STATION, L.L.C.)
- WZDC-LP (Channel 64; WASHINGTON, DC; Owner: ONDA CAPITAL, INC.)
- WMPT (Channel 22; ANNAPOLIS, MD; Owner: MARYLAND PUBLIC BROADCASTING COMMISSION)
- WMDO-CA (Channel 30; WASHINGTON, DC; Owner: ENTRAVISION HOLDINGS, LLC)
- WBAL-TV (Channel 11; BALTIMORE, MD; Owner: WBAL HEARST-ARGYLE TV, INC. (CA CORP.))
- WMAR-TV (Channel 2; BALTIMORE, MD; Owner: SCRIPPS HOWARD BROADCASTING COMPANY)
- WBFF (Channel 45; BALTIMORE, MD; Owner: CHESAPEAKE TELEVISION LICENSEE, LLC)
- WNUV (Channel 54; BALTIMORE, MD; Owner: BALTIMORE (WNUV-TV) LICENSEE, INC.)
- WKRP-LP (Channel 42; WASHINGTON, DC; Owner: CAPITAL MEDIA, LLC)
- WPXW (Channel 66; MANASSAS, VA; Owner: PAXSON WASHINGTON LICENSE, INC.)
- WUTB (Channel 24; BALTIMORE, MD; Owner: FOX TELEVISION STATIONS, INC.)
- WJZ-TV (Channel 13; BALTIMORE, MD; Owner: VIACOM INC.)
- WMPB (Channel 67; BALTIMORE, MD; Owner: MARYLAND PUBLIC BROADCASTING COMMISSION)
- WNVT (Channel 53; GOLDVEIN, VA; Owner: COMMONWEALTH PUBLIC BROADCASTING CORPORATION)
- W63BP (Channel 63; ANNAPOLIS, MD; Owner: ANNAPOLIS BROADCASTING COMPANY, INC.)
- National Bridge Inventory (NBI) Statistics
- 7Number of bridges
- 59ft / 18.4mTotal length
- $1,136,000Total costs
- 403,191Total average daily traffic
- 16,388Total average daily truck traffic
FCC Registered Antenna Towers:
45 (See the full list of FCC Registered Antenna Towers in Temple Hills)FCC Registered Broadcast Land Mobile Towers:
6- 4744 Clifton Rd (Lat: 38.824833 Lon: -76.943583), Call Sign: KOB553, Licensee ID: L00865076,
Assigned Frequencies: 150.815 MHz, Grant Date: 05/19/2004, Expiration Date: 06/22/2014, Cancellation Date: 08/23/2014, Registrant: M & N Towing, 4744 Clifton Rd, Temple Hills, MD 20748, Phone: (301) 423-4206
- 3636 Branch Avenue (Lat: 38.842389 Lon: -76.949000), Call Sign: WQCC439,
Assigned Frequencies: 151.895 MHz, 33.1400 MHz, 30.8400 MHz, 154.540 MHz, 33.4000 MHz, 154.515 MHz, 33.1600 MHz, 151.655 MHz, 151.670 MHz, 30.5800 MHz... (+26 more), Grant Date: 12/11/2014, Expiration Date: 01/28/2025, Certifier: Renee L Siebert, Registrant: Npc Quality Burgers, Inc., 720 W 20th Street, Pittsburg, KS 66762, Phone: (620) 231-3390, Fax: (620) 232-6101, Email:
- Lat: 38.855139 Lon: -76.939056, Call Sign: WQCE958,
Assigned Frequencies: 159.787 MHz, 159.787 MHz, Grant Date: 02/17/2005, Expiration Date: 02/17/2015, Cancellation Date: 04/25/2015, Certifier: Matthew Jones Jr, Registrant: Business Radio Licensing, 26941 Cabot Road #134, Laguna Hills, CA 92653, Phone: (949) 348-8510, Fax: (949) 348-8514, Email:
- Lat: 38.823333 Lon: -76.953556, Call Sign: WQEV268,
Assigned Frequencies: 464.675 MHz, 468.525 MHz, 468.975 MHz, 469.675 MHz, Grant Date: 04/24/2006, Expiration Date: 04/24/2016, Cancellation Date: 06/25/2016, Certifier: Mike Humble, Registrant: Metro 2 Way, Brookeville, MD 20833, Phone: (202) 882-4420, Fax: (202) 722-4606, Email:
- Lat: 38.802972 Lon: -76.937500, Call Sign: WQGH516,
Assigned Frequencies: 464.625 MHz, 469.625 MHz, 464.950 MHz, 469.950 MHz, Grant Date: 01/26/2017, Expiration Date: 01/18/2027, Certifier: Dennis Morgan, Registrant: Metrocom, Inc, P O Box 134, Brookeville, MD 20833, Phone: (202) 437-2022, Fax: (301) 570-7523, Email:
- TEMPLE HILLS, Temple Hills Road (Lat: 38.772889 Lon: -76.920917), Type: Tower, Structure height: 86.9 m, Overall height: 91.1 m, Call Sign: WQGV455,
Assigned Frequencies: 155.790 MHz, 155.685 MHz, 155.685 MHz, Grant Date: 03/04/2017, Expiration Date: 04/25/2027, Certifier: Wayne A Mcbride, Registrant: Prince George\'s County Public Safety Communications, 7911 Anchor St, Landover, MD 20785, Phone: (240) 832-0715, Fax: (717) 334-4739, Email:
FCC Registered Microwave Towers:
8 (See the full list of FCC Registered Microwave Towers in this town)FCC Registered Amateur Radio Licenses:
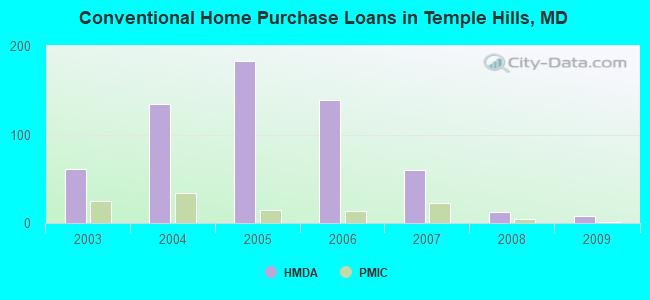
88 (See the full list of FCC Registered Amateur Radio Licenses in Temple Hills)| Home Mortgage Disclosure Act Aggregated Statistics For Year 2009 (Based on 1 full and 2 partial tracts) | ||||||||||||
| A) FHA, FSA/RHS & VA Home Purchase Loans | B) Conventional Home Purchase Loans | C) Refinancings | D) Home Improvement Loans | F) Non-occupant Loans on < 5 Family Dwellings (A B C & D) | G) Loans On Manufactured Home Dwelling (A B C & D) | |||||||
|---|---|---|---|---|---|---|---|---|---|---|---|---|
| Number | Average Value | Number | Average Value | Number | Average Value | Number | Average Value | Number | Average Value | Number | Average Value | |
| LOANS ORIGINATED | 28 | $183,354 | 8 | $111,514 | 89 | $208,811 | 7 | $77,617 | 7 | $146,536 | 1 | $118,000 |
| APPLICATIONS APPROVED, NOT ACCEPTED | 3 | $159,043 | 0 | $0 | 15 | $195,055 | 1 | $42,140 | 1 | $69,410 | 0 | $0 |
| APPLICATIONS DENIED | 7 | $175,961 | 4 | $109,405 | 66 | $211,270 | 10 | $53,269 | 6 | $183,358 | 3 | $65,193 |
| APPLICATIONS WITHDRAWN | 10 | $169,929 | 2 | $242,315 | 35 | $196,436 | 0 | $0 | 1 | $106,890 | 0 | $0 |
| FILES CLOSED FOR INCOMPLETENESS | 0 | $0 | 0 | $0 | 9 | $234,247 | 0 | $0 | 0 | $0 | 0 | $0 |
Detailed HMDA statistics for the following Tracts: 8017.01 , 8017.02, 8019.01
| Private Mortgage Insurance Companies Aggregated Statistics For Year 2009 (Based on 2 partial tracts) | ||
| A) Conventional Home Purchase Loans | ||
|---|---|---|
| Number | Average Value | |
| LOANS ORIGINATED | 1 | $129,100 |
| APPLICATIONS APPROVED, NOT ACCEPTED | 0 | $0 |
| APPLICATIONS DENIED | 0 | $0 |
| APPLICATIONS WITHDRAWN | 0 | $0 |
| FILES CLOSED FOR INCOMPLETENESS | 1 | $147,150 |
Detailed PMIC statistics for the following Tracts: 8017.01 , 8017.02, 8019.01
| Most common first names in Temple Hills, MD among deceased individuals | ||
| Name | Count | Lived (average) |
|---|---|---|
| James | 164 | 68.9 years |
| Mary | 157 | 78.3 years |
| John | 150 | 72.2 years |
| William | 148 | 72.3 years |
| Robert | 100 | 69.2 years |
| Charles | 99 | 71.0 years |
| Joseph | 85 | 69.6 years |
| George | 64 | 72.1 years |
| Helen | 62 | 77.8 years |
| Margaret | 54 | 79.1 years |
| Most common last names in Temple Hills, MD among deceased individuals | ||
| Last name | Count | Lived (average) |
|---|---|---|
| Smith | 69 | 69.6 years |
| Williams | 61 | 65.4 years |
| Johnson | 61 | 73.0 years |
| Jones | 59 | 71.6 years |
| Brown | 48 | 65.7 years |
| Davis | 43 | 66.3 years |
| Jackson | 39 | 74.3 years |
| Thomas | 32 | 70.2 years |
| Anderson | 31 | 70.1 years |
| Harris | 28 | 72.5 years |
- 55.4%Utility gas
- 26.8%Electricity
- 16.3%Fuel oil, kerosene, etc.
- 0.8%Solar energy
- 0.7%Bottled, tank, or LP gas
- 71.8%Electricity
- 26.7%Utility gas
- 0.6%Bottled, tank, or LP gas
- 0.5%Fuel oil, kerosene, etc.
- 0.4%No fuel used
Temple Hills compared to Maryland state average:
- Unemployed percentage significantly below state average.
- Black race population percentage significantly above state average.
- Foreign-born population percentage below state average.
- Renting percentage above state average.
- Length of stay since moving in significantly above state average.
- Number of rooms per house below state average.
- Percentage of population with a bachelor's degree or higher below state average.
Temple Hills on our top lists:
- #17 on the list of "Top 100 cities with longest commuting times (pop. 5,000+)"
- #19 on the list of "Top 101 cities with largest percentage of males in occupations: fire fighting and prevention workers including supervisors (population 5,000+)"
- #34 on the list of "Top 101 cities with largest percentage of males in industries: management of companies and enterprises (population 5,000+)"
- #43 on the list of "Top 101 cities with the most residents born in Nigeria (population 500+)"
- #55 on the list of "Top 101 cities with largest percentage of females in industries: public administration (population 5,000+)"
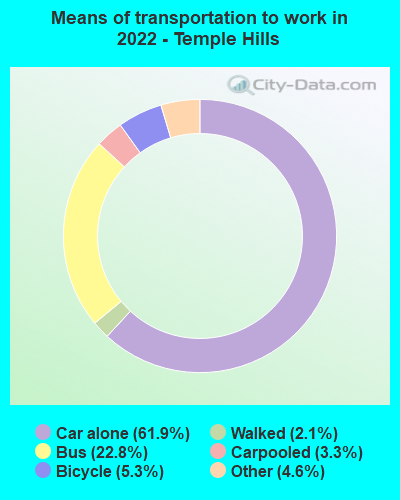
- #56 on the list of "Top 101 cities with the most people taking a bus, a trolley bus, a streetcar, or a trolley car to work (population 5,000+)"
- #65 on the list of "Top 101 cities with the most people born in other U.S. states (population 5,000+)"
- #87 on the list of "Top 101 cities with the most residents born in Western Africa (population 500+)"
- #91 on the list of "Top 101 cities with largest percentage of females in occupations: law enforcement workers including supervisors (population 5,000+)"
- #99 on the list of "Top 101 cities with the most people taking subway or elevated to work (population 5,000+)"
- #75 (20748) on the list of "Top 101 zip codes with the largest charity contributions deductions as a percentage of AGI in 2012 (pop 5,000+)"
- #5 on the list of "Top 101 counties with highest percentage of residents voting for Obama (Democrat) in the 2012 Presidential Election"
- #12 on the list of "Top 101 counties with the highest number of infant deaths per 1000 residents 2007-2013 (pop. 50,000+)"
- #13 on the list of "Top 101 counties with the highest average weight of females"
- #14 on the list of "Top 101 counties with the highest Nitrogen Dioxide air pollution readings in 2012 (ppm)"
- #14 on the list of "Top 101 counties with the most Black Protestant adherents"

|
|
Total of 8 patent applications in 2008-2024.