The median household income in Wallingford Center, CT in 2022 was $81,964, which was 7.9% less than the median annual income of $88,429 across the entire state of Connecticut. Compared to the median income of $45,827 in 2000 this represents an increase of 44.1%. The per capita income in 2022 was $43,683, which means an increase of 48.0% compared to 2000 when it was $22,724.
Whole page based on the data from 2000 / 2022 when the population of Wallingford Center, Connecticut was 17,509 / 18,815
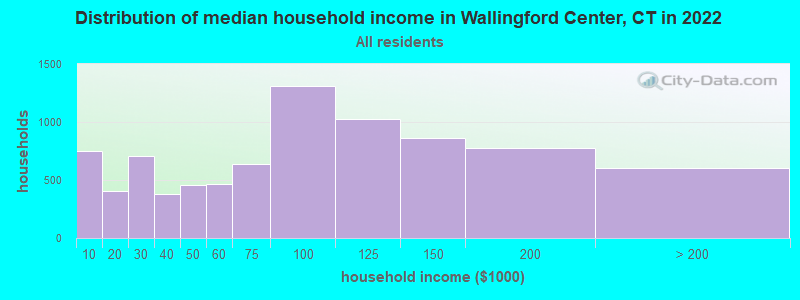
Income statistics for all residents
Median household income in Wallingford Center, CT in 2022:
Wallingford Center:
$81,964
State:
$88,429
Change in median household income between 2000 and 2022:
Wallingford Center, Connecticut:
+78.9%
Connecticut:
+64.0%
Number of households with income < $10k:
Wallingford Center:
9.0% (753)
State:
5.1% (72,746)
Number of households with income $10k - 20k:
Wallingford Center:
4.9% (408)
State:
5.7% (81,643)
Number of households with income $20k - 30k:
Wallingford Center:
8.4% (706)
State:
6.5% (92,844)
Number of households with income $30k - 40k:
Wallingford Center:
4.6% (383)
State:
5.9% (83,934)
Number of households with income $40k - 50k:
Wallingford Center:
5.5% (459)
State:
5.8% (83,025)
Number of households with income $50k - 60k:
Wallingford Center:
5.5% (465)
Connecticut:
5.7% (81,788)
Number of households with income $60k - 75k:
Wallingford Center:
7.6% (637)
Connecticut:
8.1% (115,651)
Number of households with income $75k - 100k:
Wallingford Center:
15.6% (1,311)
State:
12.6% (180,173)
Number of households with income $100k - 125k:
Wallingford Center:
12.2% (1,027)
Connecticut:
9.9% (141,231)
Number of households with income $125k - 150k:
Wallingford Center:
10.3% (861)
Connecticut:
7.9% (112,826)
Number of households with income $150k - 200k:
Wallingford Center:
9.2% (774)
Connecticut:
10.8% (154,641)
Number of households with income > $200k:
Wallingford Center:
7.2% (605)
State:
16.3% (233,133)
Aggregate household income in Wallingford Center in 2022: $789,806,097
Median family income in Wallingford Center in 2022:
Wallingford Center:
$109,319
Connecticut:
$115,183
Number of families with income < $10k:
Wallingford Center:
3.3% (142)
State:
2.6% (23,251)
Number of families with income $10k - 20k:
Wallingford Center:
1.2% (53)
State:
2.8% (25,184)
Number of families with income $20k - 30k:
Wallingford Center:
3.3% (140)
Connecticut:
4.1% (36,835)
Number of families with income $30k - 40k:
Wallingford Center:
2.4% (104)
Connecticut:
4.2% (38,052)
Number of families with income $40k - 50k:
Wallingford Center:
4.0% (171)
State:
4.8% (43,104)
Number of families with income $50k - 60k:
Wallingford Center:
2.7% (114)
Connecticut:
4.8% (43,284)
Number of families with income $60k - 75k:
Wallingford Center:
7.2% (308)
State:
7.4% (66,521)
Number of families with income $75k - 100k:
Wallingford Center:
19.4% (833)
State:
12.9% (116,232)
Number of families with income $100k - 125k:
Wallingford Center:
17.2% (739)
State:
10.6% (95,504)
Number of families with income $125k - 150k:
Wallingford Center:
15.0% (645)
State:
9.5% (86,149)
Number of families with income $150k - 200k:
Wallingford Center:
14.6% (630)
State:
14.0% (125,908)
Number of families with income > $200k:
Wallingford Center:
9.7% (419)
State:
22.4% (202,515)
Median non-family income in Wallingford Center in 2022:
Wallingford Center:
$44,460
Connecticut:
$50,964
Change in median non-family income between 2000 and 2022:
Wallingford Center, Connecticut:
+52.2%
State:
+65.1%
Median per capita income in Wallingford Center in 2022:
Wallingford Center:
$43,683
State:
$51,581
Change in median per capita income between 2000 and 2022:
Wallingford Center, Connecticut:
+92.2%
State:
+79.3%
Income statistics for White residents
Median household income in Wallingford Center, CT in 2022:
Wallingford Center:
$77,398
Connecticut:
$96,890
Change in median household income between 2000 and 2022:
Wallingford Center, Connecticut:
+69.3%
Connecticut:
+68.5%
Number of households with income < $10k:
Wallingford Center:
9.7% (658)
State:
4.2% (42,265)
Number of households with income $10k - 20k:
Wallingford Center:
5.9% (402)
State:
4.8% (48,323)
Number of households with income $20k - 30k:
Wallingford Center:
8.9% (605)
Connecticut:
5.7% (57,716)
Number of households with income $30k - 40k:
Wallingford Center:
4.8% (322)
Connecticut:
5.3% (53,827)
Number of households with income $40k - 50k:
Wallingford Center:
5.1% (344)
State:
5.3% (53,301)
Number of households with income $50k - 60k:
Wallingford Center:
5.9% (400)
State:
5.5% (55,690)
Number of households with income $60k - 75k:
Wallingford Center:
7.4% (503)
State:
8.0% (80,329)
Number of households with income $75k - 100k:
Wallingford Center:
15.3% (1,038)
Connecticut:
12.7% (128,070)
Number of households with income $100k - 125k:
Wallingford Center:
10.5% (710)
State:
10.0% (101,210)
Number of households with income $125k - 150k:
Wallingford Center:
8.8% (593)
Connecticut:
8.0% (81,250)
Number of households with income $150k - 200k:
Wallingford Center:
10.3% (695)
State:
11.8% (119,527)
Number of households with income > $200k:
Wallingford Center:
7.3% (495)
State:
18.6% (187,875)
Aggregate household income in Wallingford Center in 2022: $630,738,050
Median family income in Wallingford Center in 2022:
Wallingford Center:
$111,917
State:
$128,955
Number of families with income < $10k:
Wallingford Center:
3.6% (118)
State:
1.9% (11,537)
Number of families with income $10k - 20k:
Wallingford Center:
1.5% (50)
State:
1.8% (11,289)
Number of families with income $20k - 30k:
Wallingford Center:
2.7% (86)
State:
3.0% (18,506)
Number of families with income $30k - 40k:
Wallingford Center:
2.5% (81)
Connecticut:
2.9% (18,160)
Number of families with income $40k - 50k:
Wallingford Center:
4.8% (155)
Connecticut:
3.9% (24,550)
Number of families with income $50k - 60k:
Wallingford Center:
2.9% (95)
State:
4.3% (26,723)
Number of families with income $60k - 75k:
Wallingford Center:
6.3% (204)
State:
7.1% (44,075)
Number of families with income $75k - 100k:
Wallingford Center:
19.6% (636)
State:
12.5% (77,679)
Number of families with income $100k - 125k:
Wallingford Center:
16.8% (544)
State:
11.1% (69,086)
Number of families with income $125k - 150k:
Wallingford Center:
12.0% (388)
Connecticut:
9.6% (59,616)
Number of families with income $150k - 200k:
Wallingford Center:
17.3% (561)
Connecticut:
15.7% (97,890)
Number of families with income > $200k:
Wallingford Center:
10.0% (324)
Connecticut:
26.3% (163,417)
Median non-family income in Wallingford Center in 2022:
Wallingford Center:
$41,489
Connecticut:
$54,067
Change in median non-family income between 2000 and 2022:
Wallingford Center, Connecticut:
+42.7%
Connecticut:
+68.7%
Median per capita income in Wallingford Center in 2022:
Wallingford Center:
$47,461
State:
$59,916
Change in median per capita income between 2000 and 2022:
Wallingford Center, Connecticut:
+103.9%
State:
+90.2%
Income statistics for Black or African American residents
Median household income in Wallingford Center, CT in 2022:
Wallingford Center:
$48,197
Connecticut:
$61,803
Change in median household income between 2000 and 2022:
Wallingford Center, Connecticut:
+10.2%
State:
+76.1%
Number of households with income < $10k:
Wallingford Center:
5.8% (7)
State:
6.8% (9,494)
Number of households with income $10k - 20k:
Wallingford Center:
0.0% (0)
Connecticut:
7.9% (11,003)
Number of households with income $20k - 30k:
Wallingford Center:
10.0% (12)
Connecticut:
10.8% (15,045)
Number of households with income $30k - 40k:
Wallingford Center:
27.5% (33)
State:
8.2% (11,501)
Number of households with income $40k - 50k:
Wallingford Center:
11.7% (14)
Connecticut:
7.4% (10,416)
Number of households with income $50k - 60k:
Wallingford Center:
27.5% (33)
Connecticut:
7.5% (10,534)
Number of households with income $60k - 75k:
Wallingford Center:
0.0% (0)
Connecticut:
8.0% (11,244)
Number of households with income $75k - 100k:
Wallingford Center:
10.0% (12)
State:
9.6% (13,370)
Number of households with income $100k - 125k:
Wallingford Center:
0.0% (0)
Connecticut:
10.2% (14,244)
Number of households with income $125k - 150k:
Wallingford Center:
0.0% (0)
Connecticut:
8.0% (11,246)
Number of households with income $150k - 200k:
Wallingford Center:
7.5% (9)
State:
7.7% (10,727)
Number of households with income > $200k:
Wallingford Center:
0.0% (0)
State:
7.9% (11,086)
Aggregate household income in Wallingford Center in 2022: $7,713,227
Median non-family income in Wallingford Center in 2022:
Wallingford Center:
$65,131
State:
$38,608
Change in median non-family income between 2000 and 2022:
Wallingford Center, Connecticut:
+148.1%
State:
+77.0%
Median per capita income in Wallingford Center in 2022:
Wallingford Center:
$34,996
State:
$36,289
Change in median per capita income between 2000 and 2022:
Wallingford Center, Connecticut:
+95.4%
State:
+117.5%
Income statistics for Asian residents
Median household income in Wallingford Center, CT in 2022:
Wallingford Center:
$135,991
State:
$110,568
Change in median household income between 2000 and 2022:
Wallingford Center, Connecticut:
+100.9%
State:
+79.5%
Number of households with income < $10k:
Wallingford Center:
0.0% (0)
Connecticut:
7.1% (4,245)
Number of households with income $10k - 20k:
Wallingford Center:
0.0% (0)
State:
3.5% (2,087)
Number of households with income $20k - 30k:
Wallingford Center:
10.0% (29)
Connecticut:
4.1% (2,464)
Number of households with income $30k - 40k:
Wallingford Center:
2.4% (7)
State:
4.1% (2,478)
Number of households with income $40k - 50k:
Wallingford Center:
4.8% (14)
State:
3.3% (1,983)
Number of households with income $50k - 60k:
Wallingford Center:
0.0% (0)
State:
3.9% (2,328)
Number of households with income $60k - 75k:
Wallingford Center:
11.4% (33)
State:
7.0% (4,228)
Number of households with income $75k - 100k:
Wallingford Center:
5.5% (16)
State:
11.5% (6,911)
Number of households with income $100k - 125k:
Wallingford Center:
2.8% (8)
Connecticut:
10.2% (6,127)
Number of households with income $125k - 150k:
Wallingford Center:
41.9% (121)
State:
8.5% (5,079)
Number of households with income $150k - 200k:
Wallingford Center:
11.4% (33)
State:
12.4% (7,434)
Number of households with income > $200k:
Wallingford Center:
9.7% (28)
State:
24.4% (14,661)
Aggregate household income in Wallingford Center in 2022: $33,978,975
Median family income in Wallingford Center in 2022:
Wallingford Center:
$141,667
Connecticut:
$134,548
Number of families with income $20k - 30k:
Wallingford Center:
12.6% (32)
Connecticut:
3.8% (1,682)
Number of families with income $30k - 40k:
Wallingford Center:
3.9% (10)
State:
3.8% (1,652)
Number of families with income $60k - 75k:
Wallingford Center:
12.8% (32)
State:
6.0% (2,651)
Number of families with income $75k - 100k:
Wallingford Center:
3.6% (9)
Connecticut:
11.0% (4,844)
Number of families with income $125k - 150k:
Wallingford Center:
42.9% (108)
Connecticut:
8.2% (3,588)
Number of families with income $150k - 200k:
Wallingford Center:
12.7% (32)
State:
14.2% (6,237)
Number of families with income > $200k:
Wallingford Center:
11.5% (29)
State:
30.8% (13,522)
Median per capita income in Wallingford Center in 2022:
Wallingford Center:
$46,166
State:
$55,295
Change in median per capita income between 2000 and 2022:
Wallingford Center, Connecticut:
+149.2%
State:
+97.8%
Income statistics for Hispanic or Latino residents
Median household income in Wallingford Center, CT in 2022:
Wallingford Center:
$101,892
State:
$60,275
Change in median household income between 2000 and 2022:
Wallingford Center, Connecticut:
+121.2%
Connecticut:
+87.9%
Number of households with income < $10k:
Wallingford Center:
6.7% (82)
State:
8.7% (18,584)
Number of households with income $10k - 20k:
Wallingford Center:
3.6% (44)
Connecticut:
9.1% (19,235)
Number of households with income $20k - 30k:
Wallingford Center:
3.1% (38)
State:
8.9% (18,989)
Number of households with income $30k - 40k:
Wallingford Center:
4.7% (58)
Connecticut:
7.5% (15,967)
Number of households with income $40k - 50k:
Wallingford Center:
5.4% (66)
Connecticut:
8.7% (18,466)
Number of households with income $50k - 60k:
Wallingford Center:
5.0% (61)
Connecticut:
6.9% (14,706)
Number of households with income $60k - 75k:
Wallingford Center:
4.7% (58)
Connecticut:
8.9% (18,888)
Number of households with income $75k - 100k:
Wallingford Center:
20.9% (257)
State:
13.5% (28,669)
Number of households with income $100k - 125k:
Wallingford Center:
24.4% (300)
State:
8.2% (17,434)
Number of households with income $125k - 150k:
Wallingford Center:
13.4% (165)
Connecticut:
6.5% (13,752)
Number of households with income $150k - 200k:
Wallingford Center:
2.9% (35)
Connecticut:
6.6% (14,114)
Number of households with income > $200k:
Wallingford Center:
5.2% (64)
State:
6.4% (13,630)
Aggregate household income in Wallingford Center in 2022: $108,950,716
Median family income in Wallingford Center in 2022:
Wallingford Center:
$105,510
Connecticut:
$68,336
Number of families with income < $10k:
Wallingford Center:
7.2% (65)
State:
5.2% (7,456)
Number of families with income $10k - 20k:
Wallingford Center:
1.7% (15)
State:
6.0% (8,616)
Number of families with income $20k - 30k:
Wallingford Center:
5.1% (45)
State:
8.9% (12,680)
Number of families with income $30k - 40k:
Wallingford Center:
6.4% (57)
State:
8.5% (12,090)
Number of families with income $50k - 60k:
Wallingford Center:
6.4% (58)
State:
8.4% (11,924)
Number of families with income $60k - 75k:
Wallingford Center:
2.2% (20)
State:
8.9% (12,677)
Number of families with income $75k - 100k:
Wallingford Center:
22.5% (202)
State:
14.3% (20,457)
Number of families with income $100k - 125k:
Wallingford Center:
20.2% (182)
State:
8.2% (11,720)
Number of families with income $125k - 150k:
Wallingford Center:
19.0% (171)
State:
8.2% (11,729)
Number of families with income $150k - 200k:
Wallingford Center:
3.6% (32)
State:
7.1% (10,096)
Number of families with income > $200k:
Wallingford Center:
5.7% (51)
State:
7.4% (10,622)
Median non-family income in Wallingford Center in 2022:
Wallingford Center:
$78,736
State:
$36,714
Median per capita income in Wallingford Center in 2022:
Wallingford Center:
$29,147
Connecticut:
$28,507
Change in median per capita income between 2000 and 2022:
Wallingford Center, Connecticut:
+109.3%
State:
+117.2%
Income statistics for American Indian and Alaska Native residents
Median per capita income in Wallingford Center in 2022:
Wallingford Center:
$4,044
Connecticut:
$25,355
Change in median per capita income between 2000 and 2022:: -78.9%
Wallingford Center, Connecticut:
-78.9%
State:
+39.4%
Income statistics for Multirace residents
Median household income in Wallingford Center, CT in 2022:
Wallingford Center:
$99,671
State:
$77,277
Change in median household income between 2000 and 2022:
Wallingford Center, Connecticut:
+139.2%
State:
+113.6%
Number of households with income < $10k:
Wallingford Center:
10.7% (63)
Connecticut:
6.0% (7,457)
Number of households with income $10k - 20k:
Wallingford Center:
0.0% (0)
Connecticut:
8.1% (10,139)
Number of households with income $20k - 30k:
Wallingford Center:
0.0% (0)
State:
7.0% (8,702)
Number of households with income $30k - 40k:
Wallingford Center:
0.0% (0)
State:
6.9% (8,546)
Number of households with income $40k - 50k:
Wallingford Center:
5.9% (35)
Connecticut:
7.0% (8,712)
Number of households with income $50k - 60k:
Wallingford Center:
4.4% (26)
State:
5.9% (7,331)
Number of households with income $60k - 75k:
Wallingford Center:
4.8% (28)
State:
8.5% (10,634)
Number of households with income $75k - 100k:
Wallingford Center:
37.5% (221)
State:
14.1% (17,600)
Number of households with income $100k - 125k:
Wallingford Center:
17.0% (100)
Connecticut:
9.9% (12,383)
Number of households with income $125k - 150k:
Wallingford Center:
7.6% (45)
Connecticut:
7.2% (8,921)
Number of households with income $150k - 200k:
Wallingford Center:
2.5% (15)
State:
8.8% (10,922)
Number of households with income > $200k:
Wallingford Center:
9.5% (56)
State:
10.6% (13,247)
Aggregate household income in Wallingford Center in 2022: $56,282,245
Median family income in Wallingford Center in 2022:
Wallingford Center:
$94,270
State:
$84,255
Number of families with income $50k - 60k:
Wallingford Center:
7.6% (24)
State:
7.6% (6,420)
Number of families with income $60k - 75k:
Wallingford Center:
4.8% (15)
State:
7.8% (6,550)
Number of families with income $75k - 100k:
Wallingford Center:
47.4% (149)
State:
14.5% (12,236)
Number of families with income $100k - 125k:
Wallingford Center:
1.8% (6)
Connecticut:
9.2% (7,787)
Number of families with income $125k - 150k:
Wallingford Center:
15.7% (49)
State:
8.9% (7,503)
Number of families with income $150k - 200k:
Wallingford Center:
4.5% (14)
State:
9.3% (7,818)
Number of families with income > $200k:
Wallingford Center:
18.4% (58)
State:
13.7% (11,603)
Median non-family income in Wallingford Center in 2022:
Wallingford Center:
$76,078
State:
$44,462
Change in median non-family income between 2000 and 2022:
Wallingford Center, Connecticut:
+141.0%
Connecticut:
+97.6%
Median per capita income in Wallingford Center in 2022:
Wallingford Center:
$35,054
Connecticut:
$32,794
Change in median per capita income between 2000 and 2022:
Wallingford Center, Connecticut:
+118.5%
Connecticut:
+117.2%
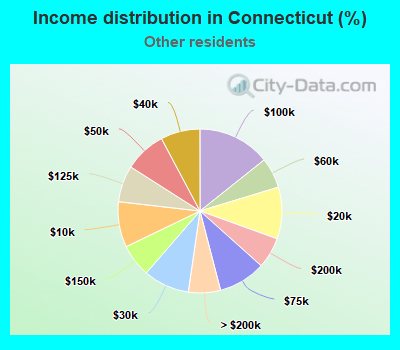
Income statistics for other residents
Median household income in Wallingford Center, CT in 2022:
Wallingford Center:
$124,730
State:
$59,588
Number of households with income < $10k:
Wallingford Center:
4.0% (23)
Connecticut:
9.0% (8,596)
Number of households with income $10k - 20k:
Wallingford Center:
0.0% (0)
Connecticut:
10.2% (9,773)
Number of households with income $20k - 30k:
Wallingford Center:
2.3% (13)
State:
9.1% (8,691)
Number of households with income $30k - 40k:
Wallingford Center:
0.0% (0)
State:
7.8% (7,447)
Number of households with income $40k - 50k:
Wallingford Center:
6.9% (40)
State:
8.2% (7,860)
Number of households with income $50k - 60k:
Wallingford Center:
0.0% (0)
State:
6.0% (5,757)
Number of households with income $60k - 75k:
Wallingford Center:
12.5% (72)
Connecticut:
9.3% (8,942)
Number of households with income $75k - 100k:
Wallingford Center:
9.9% (57)
State:
14.3% (13,700)
Number of households with income $100k - 125k:
Wallingford Center:
38.0% (219)
Connecticut:
7.2% (6,906)
Number of households with income $125k - 150k:
Wallingford Center:
19.6% (113)
State:
6.5% (6,215)
Number of households with income $150k - 200k:
Wallingford Center:
0.0% (0)
Connecticut:
6.1% (5,865)
Number of households with income > $200k:
Wallingford Center:
6.8% (39)
Connecticut:
6.3% (6,065)
Aggregate household income in Wallingford Center in 2022: $65,131,226
Median family income in Wallingford Center in 2022:
Wallingford Center:
$129,055
Connecticut:
$67,610
Number of families with income < $10k:
Wallingford Center:
3.6% (16)
State:
5.0% (3,311)
Number of families with income $20k - 30k:
Wallingford Center:
2.6% (12)
State:
8.7% (5,752)
Number of families with income $60k - 75k:
Wallingford Center:
14.5% (66)
State:
9.4% (6,232)
Number of families with income $75k - 100k:
Wallingford Center:
11.9% (54)
State:
15.7% (10,362)
Number of families with income $100k - 125k:
Wallingford Center:
36.3% (165)
State:
6.8% (4,502)
Number of families with income $125k - 150k:
Wallingford Center:
26.4% (120)
State:
9.0% (5,971)
Number of families with income > $200k:
Wallingford Center:
4.7% (21)
State:
7.1% (4,717)
Median per capita income in Wallingford Center in 2022:
Wallingford Center:
$32,504
State:
$29,353
Change in median per capita income between 2000 and 2022:
Wallingford Center, Connecticut:
+134.5%
State:
+165.8%
Discuss Wallingford Center, Connecticut (CT) on our hugely popular Connecticut forum.